


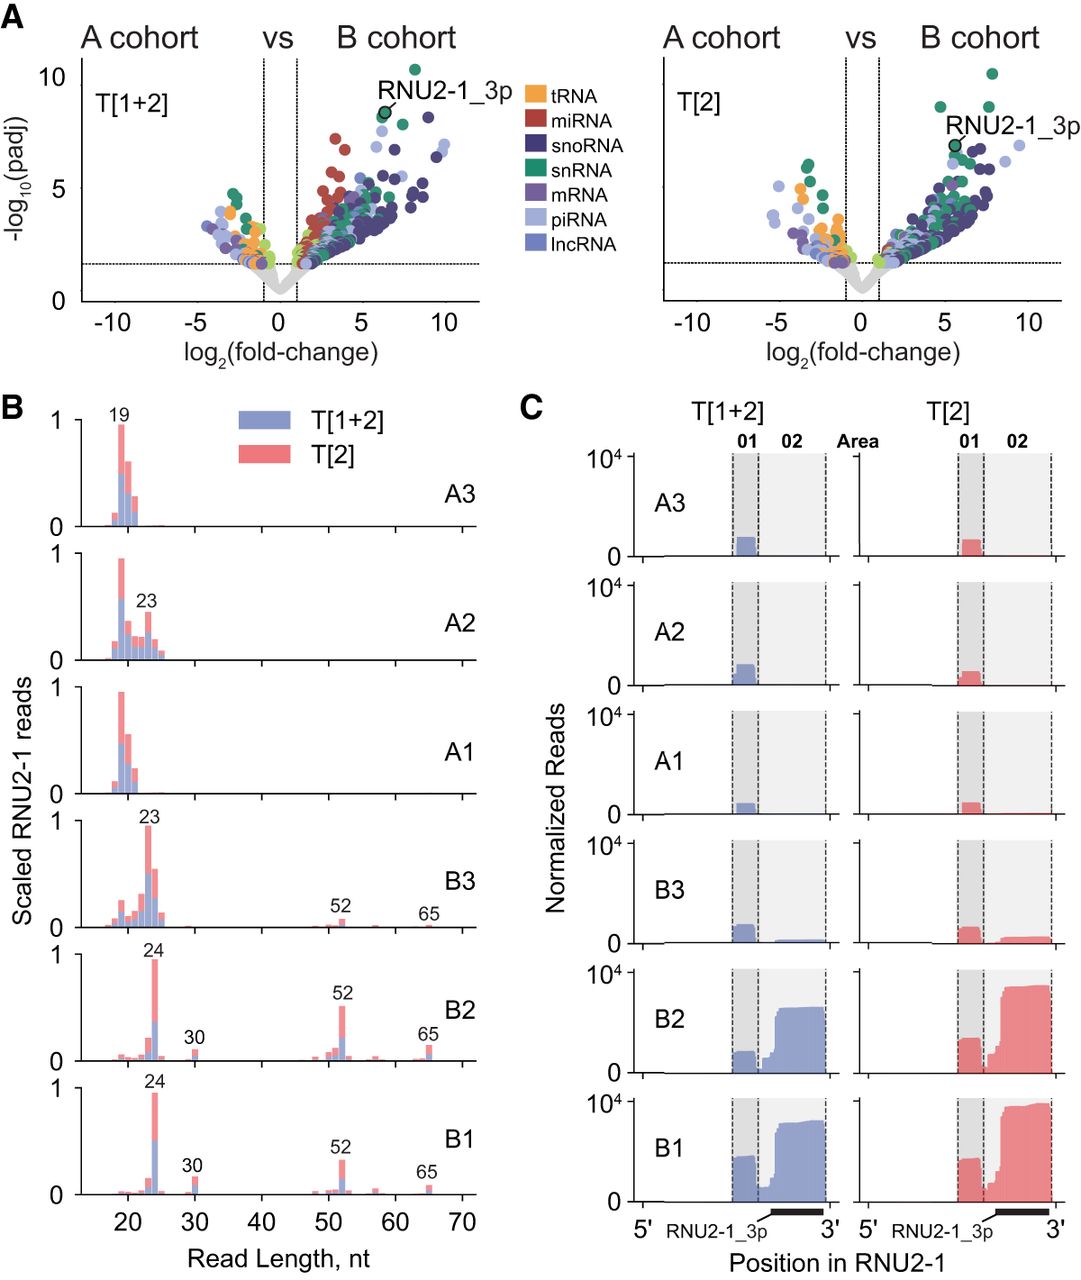
Comparison of differentially enriched sRNAs detected in the plasma RNA samples from A and B cohorts. (A) Volcano plots showing the significant changes (|log2fc| >1, Padj < 0.05) in the abundance of sRNAs indicated by dots, whose colors correspond to transcripts of the indicated RNA classes they were derived from. Average data calculated for all individual plasma RNA samples among each A and B cohort for libraries prepared by protocols T[1 + 2] and T[2] are shown in the left and right panels, respectively. (B) Overlapped sequencing length profiles for sRNAs derived from the RNU2-1 snRNA for libraries prepared using either protocol T[1 + 2] (blue) or T[2] (red) for each individual plasma RNA sample from A and B cohorts. (C) Read coverage profiles for those reads mapping to the RNU2-1 snRNA using either protocol T[1 + 2] (blue; left) or T[2] (red; right) for individual plasma RNA samples of A and B cohorts. The region corresponding to the counts associated with the RNU2-1_3p feature in A is underlined, as well as the designated areas “01” and “02” of the RNU2-1 snRNA transcript whose sequences are shown in Supplemental Figure S26.




