


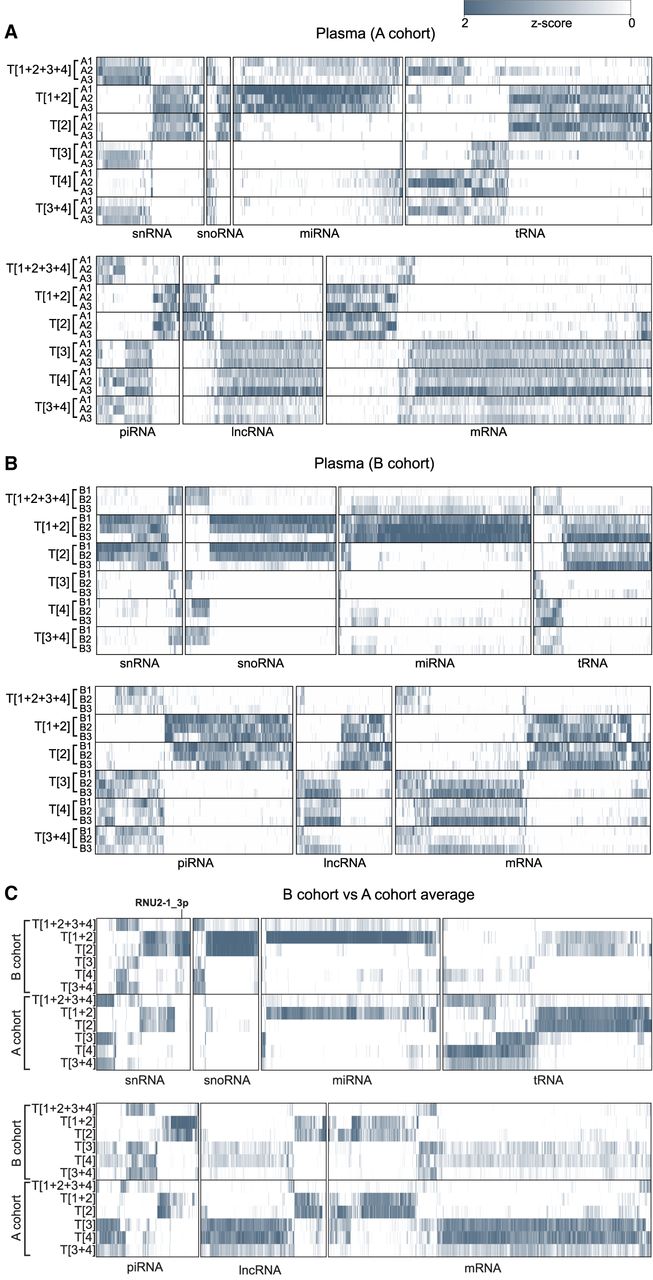
FIGURE 8.
Hierarchically clustered heat maps showing the relative abundance (row-wise Z-score) of sRNA sequences aligned to significantly enriched RNA transcripts and/or their fragments of main RNA classes among RiboMarker protocols (DESeq2 LRT; Padj < 0.05) detected in the individual plasma RNA samples of (A) A cohort, (B) B cohort, and (C) comparison of average Z-scores calculated for all individual plasma RNA samples among each A and B cohort for libraries prepared by indicated RiboMarker protocols. Darker rows indicate a higher relative abundance of the corresponding RNA transcripts.




