


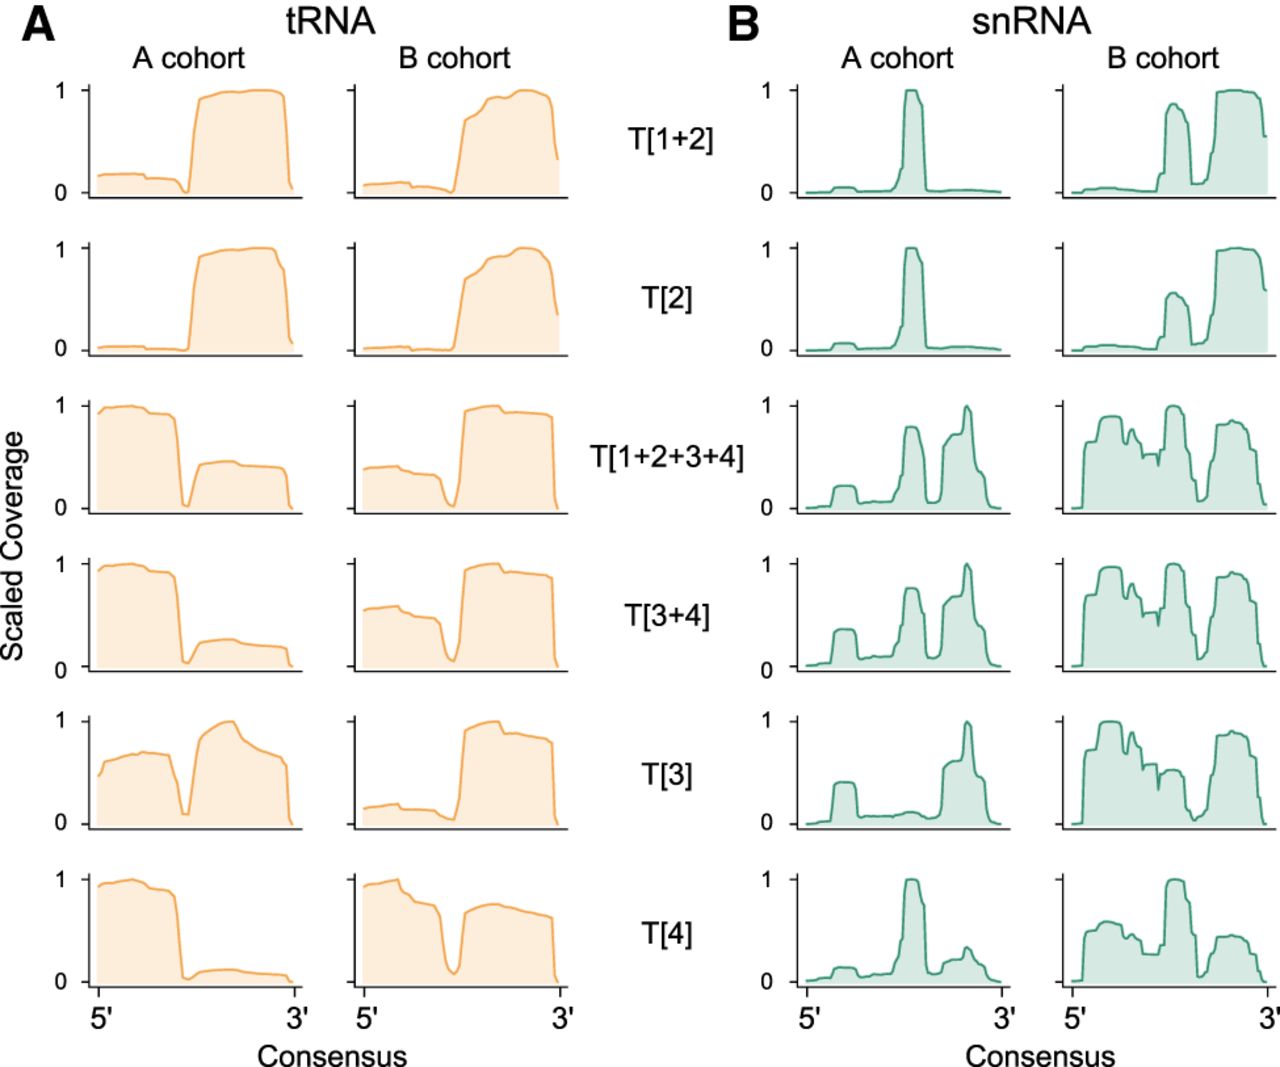
FIGURE 7.
Comparison of consensus sequencing read coverage profiles for all (A) tRNA and (B) snRNA molecules, using the average distribution in A and B cohorts’ plasma RNA samples for libraries prepared by all RiboMarker protocols (indicated for each row).




