


Pseudouridine reprogramming in the human T-cell epitranscriptome: from primary to immortalized states
- Oleksandra Fanari1,
- Dylan Bloch1,
- Yuchen Qiu1,
- Michele Meseonznik1,
- Dinara Boyko1,
- Amr Makhamreh1,
- Meni Wanunu1,2 and
- Sara H. Rouhanifard1
- 1Department of Bioengineering, Northeastern University, Boston, Massachusetts 02120, USA
- 2Department of Physics, Northeastern University, Boston, Massachusetts 02115, USA
- Corresponding author: s.rouhanifard{at}northeastern.edu
-
Handling editor: Anna Marie Pyle
Abstract
Immortalized cell lines are commonly used as proxies for primary cells in human biology research. For example, Jurkat leukemic T cells fundamentally contributed to uncovering T-cell signaling, activation, and immune responses. However, the immortalization process can alter key cellular properties, and researchers widely believe this process could significantly change RNA modification machinery and modification sites. In this study, we focus on pseudouridine (ψ), one of the most abundant mRNA modifications, and compare ψ profiles in mRNA from primary and immortalized T cells using direct RNA sequencing (DRS). Surprisingly, 87% of ψ-sites were shared between the two cell types, primarily in transcripts encoding proteins involved in essential cellular processes, including RNA-modification regulation. Furthermore, the analysis of the 13% of sites unique to each cell type reveals that Jurkat cells contained transcripts linked to immune activation and oncogenesis, while primary T cells contained transcripts associated with calcium signaling and intracellular trafficking. We provide a list of these genes, which should be considered when using immortalized cells to study RNA modifications in immunology contexts. Most differences were driven by whether the mRNA was present or absent in the immortalized or primary cell type. Interestingly, RNA-modification enzyme expression levels were highly conserved in both cell types. This suggests that site-specific differences in ψ levels arise from regulatory processes acting in trans rather than differences in modification enzyme levels.
Keywords
INTRODUCTION
RNA modifications are enzyme-mediated chemical changes to the canonical RNA nucleotides. More than 170 RNA modifications have been identified in all types of RNA (Roundtree et al. 2017), including mRNAs, but investigating the roles of mRNA modifications in cell function is an ongoing area of research (Carlile et al. 2019; Parr et al. 2020; Franco and Koutmou 2022). The cumulative abundance of mRNA modifications in various organisms reaches several percentages (Jones et al. 2020), and these are purported to influence various cellular functions, including tasks associated with immune response and cellular metabolism (Borchardt et al. 2020; Parr et al. 2020; Cui et al. 2022). Yet, to date, most data on RNA modifications have been gathered on immortalized cell lines. Immortalized cell lines are attractive models of primary cell types, although they exhibit “cancer-like” properties, such as uncontrolled growth and genomic instability (Murnane et al. 1994; Hahn et al. 1999; Shay and Wright 2000). These studies suggest, and it is widely believed, that cell immortalization can lead to disruptions in RNA modification machinery and site-specific occurrence of RNA modifications. However, to date, no study has compared the extent of any RNA modification or RNA machinery levels in immortalized versus primary cells.
Pseudouridine (ψ) modifications on mRNA are abundant, constituting 0.2%–0.6% of the total uridines in mammalian mRNAs extracted from human cells (Li et al. 2015, 2016), mediate splicing (Martinez et al. 2022), and readthrough of stop codons (Karijolich and Yu 2011), and can lead to amino acid substitutions (Eyler et al. 2019). We and others have profiled ψ modifications across immortalized human cell types (Dai et al. 2023; Tavakoli et al. 2023; Zhang et al. 2023), demonstrating that ψ modifications (both occupancy and presence) can have cell type–specific (McCormick et al. 2024b) or cell state–specific (Fanari et al. 2025) expression. Our work and others have also shown that Ψ modifications can respond dynamically to their environment (Carlile et al. 2014; Schwartz et al. 2014; Fanari et al. 2025). Unlike common RNA methylation modifications, such as m6A, m5C, m1A, and m7G, regulated by “eraser” enzymes, ψ is believed to be nonreversible (Chen et al. 2024). We focused our analysis on a nonreversible modification to attribute condition-dependent changes in ψ levels due to changes in RNA degradation and export pathways rather than the action of eraser enzymes. Moreover, unlike other irreversible modifications such as inosine and dihydrouridine, ψ is highly abundant in mRNAs (Paul and Bass 1998; Carlile et al. 2019; Draycott et al. 2022). Recent studies have identified proteins that specifically recognize ψ, including methionine aminoacyl tRNA synthetase (MetRS) in yeast and profilin-1 (PFN1) in human cells, suggesting that ψ-mediated regulation may involve dedicated reader proteins, similar to the way other RNA modifications are recognized (Levi and Arava 2021; Wei et al. 2025).These characteristics make ψ particularly valuable for exploring the role of stable RNA modifications in biological systems.
Here, we use nanopore direct RNA sequencing (DRS) to report the first transcriptome-wide profile of pseudouridine (ψ) levels across immortalized versus primary cells, focusing as a model system on T lymphocytes due to the demonstrated impact of their RNA modification profiles on immune cell biology (Meyer et al. 2012; Cui et al. 2022; Dutta et al. 2022). Several studies have shown that RNA modifications regulate key aspects of immune cell function, including T-cell homeostasis, CD4 T-cell activation, NK cell–mediated antitumor and antiviral immunity, and immune memory (Li et al. 2017; Ma et al. 2021; Bannister et al. 2022; van Vroonhoven et al. 2023). Alterations in RNA modification profiles, such as m6A, m5C, Ψ, and m1A, have also been implicated in developing and progressing diseases, including cancer (Cui et al. 2022; Zhou et al. 2022; Chen et al. 2024; Liu et al. 2024). We measured ψ profiles and compared RNA-modification machinery levels between primary (naive T cells from human blood) and immortalized (Jurkat) T cells (Abraham and Weiss 2004; Evnouchidou et al. 2020). By applying DRS to extracted transcriptomes and applying our Mod-p ID analysis pipeline (Tavakoli et al. 2023) that has been used extensively for Ψ analysis (McCormick et al. 2024b; Fanari et al. 2025). Nanopore DRS detects RNA modifications at single-nucleotide resolution without requiring reverse transcription or amplification. We evaluated Ψ sites using Mod-p ID because our method compares sequences against an unmodified in vitro transcribed (IVT) transcriptome control (McCormick et al. 2024a) and provides conservative ψ calls that account for the presence of single-nucleotide variants (SNVs) and problematic k-mers. DRS also allows for distinguishing multiple modifications on the same transcript and those that are proximal to each other (McCormick et al. 2024b).
Furthermore, many methods claim to measure ψ occupancy levels quantitatively. However, robust validation of this quantification remains challenging due to the lack of ground truth synthetic RNA controls. The inability to quantify ψ levels is agnostic to the method, spanning from chemical methods that involve bisulfite and other agents (Li et al. 2015; Dai et al. 2023; Zhang et al. 2023) to nanopore DRS-based approaches (Begik et al. 2021; Huang et al. 2021, 2024; Tavakoli et al. 2023). We, therefore, assert that a differential analysis is a more conservative approach and have recently shown using a neuronal model system (Fanari et al. 2025) and across multiple human cell lines (McCormick et al. 2024b) that differential analysis of uncalibrated ψ levels obtained using Mod-p-ID provides a relativistic comparison of unnormalized ψ profiles. Further, machine-learning-based recorrection of ψ occupancies using synthetic controls that recapitulate the sequence context of identified ψ sites leads to vastly improved quantification of ψ levels at those sites of interest (Makhamreh et al. 2024).
Here, we used Mod-p-ID to identify ψ sites and curated a transcriptome-wide map of ψ profiles in both primary and immortalized T cells. In addition, we evaluated the expression levels of the full suite of known RNA-modifying enzymes across the two cell types. We then validated our results with RNA-seq data from paired primary and immortalized cell lines in the Human Protein Atlas (Digre and Lindskog 2023) to assess the expression levels of RNA modification machinery-associated genes. We found that most differences were driven by the presence or absence of a given gene in the immortalized or primary cell, rather than modification levels and machinery. Our findings reveal that although the overall ψ modification landscape and RNA modification machinery remain broadly consistent between primary naive T cells and immortalized Jurkat cells, immortalization introduces distinct, site-specific variations in ψ modification occupancy.
RESULTS
Mapping of ψ-sites in transcripts coexpressed in primary and immortalized T cells
To quantify transcriptome-wide differences in ψ expression between primary and immortalized cells, we isolated and sequenced poly(A) selected RNA from (i) Jurkat cells and (ii) primary human T cells. We first analyzed transcript expression in primary and immortalized T cells, observing that most transcripts were expressed (>20 reads) in both cell types. Specifically, 63% of transcripts were coexpressed in both cell types, 12% were uniquely expressed in primary T cells, and 25% were exclusive to immortalized cells (Supplemental Fig. 1). Pseudouridine can be present in both coexpressed and uniquely expressed transcripts. In particular, when present on coexpressed transcripts, pseudouridine sites can be unique (ON/OFF patterns) or shared at different occupancy levels. In contrast, when pseudouridine is found on transcripts uniquely expressed in only one cell line, ψ presence reflects transcript-specific expression levels rather than differential modification. We began our RNA modification analysis by focusing on the prevalent set of coexpressed transcripts that were present in both cell types because such variations may indicate epitranscriptomic modulation.
To assign Ψ-sites, we used Mod-p ID (Tavakoli et al. 2023), which compares DRS reads to a reference IVT-derived unmodified transcriptome (see Materials and Methods; McCormick et al. 2024a) to detect characteristic U-to-C base-calling errors that occur at Ψ sites. While the IVT control does have the potential to produce an error when it passes through a modified site, we exclude the sites that have a mismatch in the IVT sample and do not match the reference sequence, resulting in a conservative analysis with the potential for false negatives rather than false positives. Ψ-sites were filtered to include only those with >20 reads in the DRS sample (Supplemental Fig. 2A), resulting in 449 Ψ-sites detected in coexpressed transcripts (Supplemental Table 1). This filtration step ensured that the mRNAs were highly expressed in immortalized and primary cell types. Mod-p ID enables differential analysis of relative occupancy for the same sites across samples, as shown previously (McCormick et al. 2024b; Fanari et al. 2025).
To provide broader context, we also assessed the global distribution of all ψ sites detected in each cell type, including both coexpressed and cell type–specific transcripts, identifying 553 sites in Jurkat and 488 in naive T cells with mismatch rates above 30%. This transcriptome-wide overview complements our focused analysis on coexpressed genes, where we specifically examined ψ-site regulation independent of gene expression differences between the two cell types.
To understand the variability of Ψ occupancy within transcripts that were expressed in both cell types, we categorized the identified Ψ-sites into three groups based on their relative positional occupancy levels: sites unique to immortalized T cells, sites unique to primary T cells, and sites shared between the two cell types (Fig. 1A; Supplemental Table 1). Following established criteria (McCormick et al. 2024b), we defined high occupancy as >30% U-to-C mismatch error and low occupancy as <10%. First, we used a U-to-C mismatch error threshold of 30% to define high-occupancy positions in primary and immortalized libraries (McCormick et al. 2024b). If the high-occupancy site found in one cell line was matched by a mismatch % <10 in the other cell line, we defined that site as unique; otherwise, when the matching mismatch error was above 10%, we defined the site shared as it is a common position to both cell lines with different occupancy levels. This manuscript will define “relative positional occupancy” as the differential U-to-C mismatch error for a given position within a transcript. Our analysis revealed that most Ψ-sites (87%) were shared (i.e., conserved) between primary and immortalized T cells, albeit at differing occupancy levels. The remaining 13% of Ψ-sites were unique to one cell type (Fig. 1A).
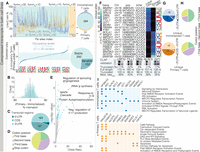
Pseudouridine profiles on coexpressed transcripts have mainly conserved positions with different occupancy levels and a limited set of unique sites in Jurkat and Naive libraries. (A, top left) Positional occupancy (mm%) for ψ sites in primary (orange) and immortalized (blue) cells, classified as unique (colored backgrounds) or shared (turquoise) based on U-to-C mismatch thresholds. The modification rate is a relative rate that can only be used to compare the same position within two cell types. (Top right) Venn diagram of unique and common ψ sites. (Bottom left) Δ occupancy (%) for shared ψ sites (primary minus immortalized) with a 20% threshold separating stable and variable sites; inset shows sequence logos by differential occupancy. (Bottom right) Pie chart of stable (light turquoise) versus variable (dark turquoise) shared sites. (B) Histogram showing a bimodal distribution of differential occupancy (U-to-C mismatch differences) for shared ψ sites. (C) Distribution of common ψ sites across the 5′ UTR, CDS, and 3′ UTR. (D) Common ψ-site distribution within the CDS by codon position (first, second, third nucleotide or stop codon). (E) Volcano plot of enriched GO Biological Process 2023 terms: odds ratio versus −log10(P-value); larger, darker points indicate higher significance (gray points: P > 0.05; labeled: P < 0.01). (F) Heat map of the top 10 unique ψ sites in immortalized and primary libraries (ranked by differential occupancy) with insets showing sequence logos for unique primary (orange) and immortalized (blue) sites; CLAP gel confirms ψ incorporation in Jurkat cells (see Supplemental Fig. 4A). (G) Distribution of ψ sites across the 5′ UTR, CDS, and 3′ UTR. (H) ψ-site distribution within the CDS by codon position (first, second, or third nucleotide). (I) Enriched GO Reactome Pathways 2024 terms for immortalized (blue, top) and primary (orange, bottom) T cells.
To assess external support for these findings, we cross-validated the detected Ψ-sites with four orthogonal “non-nanopore” methods: CeU-seq (Li et al. 2015), BID-seq (Dai et al. 2023), PRAISE (Zhang et al. 2023), and RBS-seq (Khoddami et al. 2019). We found that 17% of the shared sites were confirmed by at least one of these data sets (Supplemental Table 1). As expected, none of the cell type–specific sites were confirmed by orthogonal methods, which have not previously been applied to T cells. This likely reflects the cell-type coverage of current chemical-labeling data sets rather than a lack of specificity in our findings.
Conserved ψ sites have stable and variable occupancy levels
Our initial analysis revealed that most (87%) of ψ sites were conserved between primary and immortalized T cells. However, this analysis treated ψ sites as binary (present or absent) by imposing conservative minimum U-to-C mismatch error % cutoffs. A deeper analysis of differential occupancy levels at particular sites is needed to compare across these cell types because high-occupancy ψ sites may display functional differences from low-occupancy sites in a given cell type. To gain insight into ψ level variations, we performed a differential analysis to examine changes in mismatch % (Δ occupancy) at common ψ sites for primary T cells and immortalized cells. Shared ψ sites were classified into two categories according to their occupancy levels: stable sites (Δ occupancy <20%) and variable occupancy sites (Δ occupancy >20%; Fig. 1A). We selected this cutoff by examining the minimum difference in occupancy for sites that were unique to one cell line (Supplemental Fig. 2B). It is important to categorize these cases separately because they still indicate potentially significant differences in regulation. We found that 74% of the sites conserved between immortalized and primary T cells displayed stable occupancy, while 26% exhibited variable occupancy (Fig. 1B).
Next, we studied the sites within these clusters to investigate whether specific sequence motifs are associated with stable or variable occupancy. We generated sequence logos for five categories defined by Δ occupancy between primary and immortalized T cells (Fig. 1A). Notably, a TRUB1 recognition motif (GUUCN) (Safra et al. 2017) was significantly enriched among the most stable sites, occurring in 18% of high-stability sites compared to 12% in the remaining four categories (P = 0.01, binomial test).
The TRUB1 motif has been previously implicated in directing site-specific pseudouridylation that enhances RNA stability and translational efficiency (Safra et al. 2017). TRUB1 itself is a nuclear pseudouridine synthase broadly expressed in human tissues and associated with conserved ψ-sites across the human transcriptome. Its enrichment among stable sites in our data set suggests that TRUB1-mediated pseudouridylation may contribute to the maintenance of a core, tightly regulated epitranscriptomic program—particularly in genes relevant to T-cell identity and function. This finding supports a model in which TRUB1 activity reinforces transcript-level regulatory stability, even as other ψ sites vary across cellular states.
We also observed that cytidine frequently occurred at the −1 position in the non-highly stable groups, reaching 43% in variable sites with higher relative occupancy in immortalized cells and 54% in those with higher occupancy in primary cells. This enrichment suggests that the −1 cytidine context may be a feature of more dynamically regulated ψ sites, potentially influencing site-specific pseudouridylation sensitivity to cellular state or RNA-binding protein interactions.
We then examined the transcript-level localization of common ψ sites and found that the majority were located in the 3′ untranslated region (UTR) and coding sequence (CDS; Fig. 1C). For ψ sites within the CDS, we further analyzed their position within codons and observed a distribution across all three codon positions (Fig. 1D). These findings suggest that pseudouridylation is positioned to influence both post-transcriptional regulation through 3′UTR modification and potential cotranslational effects via codon-associated ψ sites.
Gene ontology analysis of conserved ψ sites
Gene ontology (GO) analysis of conserved ψ sites revealed significant enrichment in transcripts encoding proteins involved in core housekeeping functions (see Materials and Methods; Supplemental Table 2). Among these, RNA modification pathways such as tRNA methylation (P = 0.03) and rRNA pseudouridine synthesis (P = 0.001; Fig. 1E) were notably represented. The RNA modification GO term includes eight proteins (THUMPD3, FDXACB1, TRMT10C, DKC1, TRMO, TSR3, TRMT12, and RPUSD3) whose mRNAs contain ψ sites shared between immortalized and primary T cells (Supplemental Fig. 3). This enrichment provides insight into the selective conservation of pseudouridylation at transcripts that are essential for maintaining RNA processing fidelity. It also suggests that pseudouridylation may preferentially stabilize transcripts encoding components of the cell's own RNA modification and translation machinery.
Quantification of ψ occupancy of the conserved sites
While analyzing the relative positional occupancy of sites helps to understand variations in ψ levels between primary and immortalized cells, we were interested in more quantitative assignments of occupancy levels at select sites. To achieve quantification, a common approach is to produce synthetic RNA controls that bear a modification of interest (Fleming et al. 2019; Liu et al. 2019) and then use DRS to look at the base-calling statistics and/or to analyze the signal current levels. For this study, we used ModQuant (Makhamreh et al. 2024), a machine-learning (ML)-based approach that uses synthetic RNA controls as ground truth standards for quantification (Makhamreh et al. 2024; Fanari et al. 2025). For each ψ-bearing control studied, we also had a matching unmodified control bearing uridine. We trained six site-specific supervised ML models to quantify the occupancy of these shared ψ-sites (Supplemental Table 3) in the primary and immortalized T-cell transcripts (see Materials and Methods). For all ML models, we obtained classification accuracies of >95%. The ML model predicts the occupancy levels based on features that include signal and base-calling information. As previously shown (Tavakoli et al. 2023), U-to-C mismatch % levels are under-called for all the sites, with SLC2A1 (chr1: 42926727) as an example of a conserved site between immortalized (84% ML-predicted occupancy, 21% U-to-C mismatch) and primary T cells (94% ML-predicted occupancy, 33% U-to-C mismatch) that shows the highest difference between the ModQuant results and U-to-C mismatch levels. This highlights the importance of generating synthetic controls for the quantification of occupancy. Quantification was performed on a few select sites due to the prohibitive costs of producing a large set of synthetic RNA modification controls.
Primary and immortalized cells exhibit site-specific ψ presence/absence
Although unique sites represent a minority of the total sites detected, we sought to compare those exhibiting an on/off pattern between immortalized and primary T cells, as these instances may reflect epitranscriptomic specialization. Unique sites were ranked by their difference in occupancy levels, with the top 20 sites selected—10 uniquely expressed in immortalized T cells and 10 in primary T cells (Fig. 1F). To validate some of the sites that were unique to one cell type, we analyzed unique sites found in Jurkat cells using the CLAP method (CMC-RT and ligation assisted PCR analysis of ψ modification) (Zhang et al. 2019) as these cell type–specific sites were not covered by any of the “non-nanopore” orthogonal data sets used in our previous validation analysis. CLAP confirmed five of these unique sites identified by Mod-p ID as ψ (Fig. 1F). We could not perform this analysis on the primary T cells because the input requirement is very high for this analysis, and opted to validate just sites from one cell type to support the claim that unique ψ sites exist.
To address the limitation of not performing CLAP in primary T cells due to high input requirements, we provided additional validation for the unique ψ sites detected in these cells. First, we confirmed that the corresponding genomic DNA (gDNA) for these sites does not harbor single-nucleotide variants (SNVs), supporting the interpretation that the mismatches identified by Mod-p ID are of post-transcriptional origin rather than genomic (Supplemental Fig. 4B,D). This strengthens our classification of these sites as ψ modifications, particularly since they passed all stringency filters in the Mod-p ID pipeline. Second, we analyzed the ionic current traces at these unique sites and observed differences in signal profiles between primary and immortalized T cells across 5 nt windows centered on the candidate sites (Supplemental Fig. 4C,E). While signal differences can be subtle—even for CLAP-validated ψ sites such as TTLL1—the presence of distinct ionic traces, in combination with clean gDNA and Mod-p ID ψ-calls, supports the existence of site-specific pseudouridylation in primary T cells. This multilayered validation approach reinforces the biological relevance of the unique ψ-sites, even without direct orthogonal confirmation by CLAP in primary cells. Our CLAP results, which validated five orthogonally unconfirmed sites to be ψ, further confirm that orthogonally unconfirmed sites could be explained by using T cells, which have not been previously analyzed. Sequence logos for these unique sites revealed a pyrimidine-rich pattern among primary ψ sites (Fig. 1F).
We examined the localization of uniquely expressed ψ sites within transcripts. Under both conditions, the majority were located in the 3′UTR region, followed by the CDS (Fig. 1G), similarly to what we find for the common sites (Fig. 1C). Further analysis of their position within codons showed that immortalized cells had a higher proportion of ψ sites at the wobble position (Fig. 1H), which resembled more the distribution found in common sites (Fig. 1D). However, given the limited number of identified sites within the CDS (n = 6 for Jurkat cells, n = 15 for naive T cells), the codon position distributions for these sites should not be overinterpreted.
Gene ontology analysis revealed that unique ψ sites in immortalized cells were enriched in transcripts associated with immune system processes (P < 0.05, see Materials and Methods), oncogenic pathways, and cancer-related signaling—reflecting the altered regulatory landscape of T-cell signaling and leukemic transformation. In contrast, ψ sites unique to primary T cells were enriched in transcripts involved in calcium-dependent signaling, apoptotic regulation, and intracellular trafficking (Fig. 1I; Supplemental Table 2). These distinct enrichment profiles suggest that pseudouridylation may fine-tune transcriptomes in a context-specific manner, reinforcing proliferative and immune signaling in immortalized cells while modulating survival and homeostatic signaling in primary T cells.
Mapping of ψ-sites in transcripts uniquely expressed in primary and immortalized T cells
While our initial focus was on pseudouridine profiles within transcripts coexpressed across cell types—where differences reflect epitranscriptomic regulation—we also wanted to determine whether transcripts uniquely expressed in primary or immortalized T cells have unique pseudouridine sites. In such cases, the presence or absence of ψ-sites would be driven by transcript expression itself, rather than by differential modification levels or the activity of the pseudouridylation machinery. To assess these extreme occurrences of ψ-sites, transcripts were analyzed to determine if they were uniquely expressed in primary or immortalized T cells (Fig. 2A; Supplemental Table 4). ψ-sites were detected in these two groups and filtered to be significant and with sufficient coverage in both IVT (>10 reads) and DRS samples (>20 reads) (see Materials and Methods; Fig. 2B). Next, GO analysis was performed on primary and immortalized data sets to rule out their possible functions and focused on biological processes for the sites found on differentially expressed transcripts (Fig. 1B,C; Supplemental Table 5). We found that the transcripts with ψ-sites encoded for proteins implicated in various housekeeping cellular processes, which were different for primary and immortalized cells.
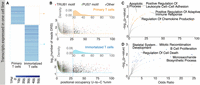
Pseudouridine profiles on transcripts uniquely expressed in immortalized or primary T cells. (A) Transcriptome-wide expression (TPMs) of unique transcripts in primary (orange) and immortalized T cells (blue). (B) Positional occupancy (U-to-C %mm) versus log-total reads for putative ψ sites (P < 0.001) in primary (top) and immortalized (bottom) cells. Red and green highlight known TRUB1 (GUUCN) and PUS7 (UNUAR) motifs, respectively; black points lack a motif. Dashed lines show minimum thresholds. (C) Volcano plot of GO Biological Process 2023 terms for ψ-sites on unique transcripts in primary (top) and immortalized (bottom) cells. Larger points indicate higher significance; gray points are nonsignificant (P > 0.05), with select terms labeled for P < 0.01.
Pseudouridine profiles in Jurkat cells reflect T-cell identity over immortalization status
After observing a strong degree of similarity in ψ modification patterns between immortalized Jurkat and primary T cells, we asked whether this resemblance was primarily driven by shared lineage (T cells identity) or by immortalization status. To answer this question, we analyzed ψ profiles and transcriptomes across three cell types: primary naive T cells, Jurkat T cells (immortalized), and HeLa cells, an immortalized epithelial cervical cancer line (Tavakoli et al. 2023).
To enable comparison with the HeLa cell line—which was sequenced by Tavakoli et al. at lower depth using a MinION flowcell (∼3 million reads per sample)—we applied a distinct filtering strategy from that used in Figure 1. This analysis includes all ψ-sites detected in both coexpressed and uniquely expressed transcripts across the three cell types, using a more permissive U-to-C mismatch threshold (>10%) to accommodate lower coverage. Additionally, we did not apply pan-IVT enrichment (i.e., no lympho-IVT; see Materials and Methods), but instead relied on paired IVT controls specific to each sample. This approach ensured consistent detection criteria across all conditions, including HeLa, which was sequenced with a single IVT reference.
At the transcriptome level, we found that 6317 genes were commonly expressed across all three cell types. Notably, 1571 genes were shared only between Jurkat and naive T cells, compared to 1235 shared between Jurkat and HeLa (Fig. 3B), suggesting a modest but meaningful bias toward lineage-specific transcriptional similarity.
We then examined whether this trend held for pseudouridine modifications. If immortalization were the dominant driver, we would expect greater overlap between Jurkat and HeLa. Instead, we observed that Jurkat cells shared 445 ψ-modified sites with primary naive T cells, but only 227 with HeLa (Fig. 3C). These findings suggest that cell lineage exerts a stronger influence than immortalization on shaping the ψ epitranscriptome, reinforcing the idea that pseudouridylation patterns are guided by cell identity rather than transformation status alone.
We then focused on sites shared between the three cellular lines and characterized hypermodified type I sites (Fig. 3D), defined as sites with an occupancy >40% (Tavakoli et al. 2023). We found 73 hypermodified type I sites in at least two out of three cell lines (Supplemental Fig. 4), which we validated using orthogonal methods, finding that 51% of these were detected as ψ-sites by non-nanopore methods (Fig. 3D; Supplemental Fig. 4). The shared hypermodified type I sites were harbored by a TRUB1 motif (GUUCN; Fig. 3E).
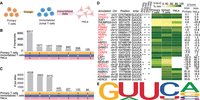
Comparison of immortalized and primary T cells to HeLa immortalized cell line. (A) Schematic representation of the comparison between immortalized state (immortalized Jurkat T cells vs. HeLa) and lineage (immortalized Jurkat T cells vs. Primary T cells). (B) Intersection of highly expressed transcripts (number of reads >20) across immortalized T cells, primary T cells, and HeLa cells. The histogram represents the number of transcripts shared among the indicated cell types. Black dots below each bar indicate which groups contribute to the intersection. (C) Intersection of ψ-sites detected in immortalized T cells, primary T cells, and HeLa cells (% U-to-C mismatch >10). The histogram represents the number of ψ modifications found in the indicated combinations of cell types. Black dots below each bar indicate which groups contribute to the intersection. (D) Heat map of hypermodified type I sites (% U-to-C mismatch >40) found in the three cell lines validated with orthogonal methods. For clarity, we only show the top five hypermodified type I sites found in two out of three conditions. Sites surrounded by a TRUB1 motif are highlighted in red, and sites surrounded by a PUS7 motif are highlighted in blue. (E) Sequencing logo of the hypermodified type I sites shared by immortalized T cells, primary T cells and HeLa.
Type II hypermodification patterning in primary and immortalized T cells
Type II hypermodifications, defined as transcripts containing more than one Ψ site (Tavakoli et al. 2023), may have biological significance by influencing RNA structure, stability, or translation efficiency in a region-specific or combinatorial manner. Such densely modified transcripts may be subject to distinct regulatory mechanisms compared to singly modified RNAs (Motorin and Helm 2011, 2022). While dense modification patterns are well-documented in structured RNA such as tRNAs—where they are critical for proper folding and function (Motorin and Helm 2011; Jackman and Alfonzo 2013)—their role in mRNAs remains largely unexplored.
In both primary and immortalized T cells, we observed up to four Ψ sites per transcript, with the majority of hypermodified type II sites containing two sites (Fig. 4A). To further characterize these transcripts, we assessed several features. First, we examined whether transcript length correlated with the spacing of Ψ sites and found minimal correlation, indicating that hypermodification is not merely a byproduct of transcript size (Supplemental Fig. 4A,B). We then analyzed the regional distribution of type II Ψ sites across 5′ UTRs, CDSs, and 3′ UTRs. As expected, Ψ sites were rarely observed in the 5′ UTR, likely reflecting coverage biases in direct RNA sequencing (Supplemental Fig. 6C).
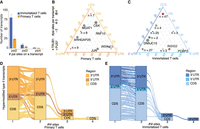
Hypermodified type II pseudouridine sites in immortalized and primary T cells. (A) Hypermodified type II transcripts with two to four putative ψ sites in primary (orange) and immortalized (blue) T cells; points represent in silico replicate detections. (B) Ternary plot showing the distribution of ψ sites across the 5′ UTR, CDS, and 3′ UTR in primary T cells; point size reflects the number of ψ sites on the same transcript, with transcripts harboring a TRUB1 motif in red and a PUS7 motif in green. Data points are annotated with the number of transcripts sharing the same UTR/CDS distribution. Transcript names are labeled for n = 1. (C) Ternary plot showing the distribution of ψ sites across the 5′ UTR, CDS, and 3′ UTR in immortalized T cells; point size reflects the number of ψ sites on the same transcript, with transcripts harboring a TRUB1 motif in red and a PUS7 motif in green. The number of hypermodified type II transcripts with the same UTR/CDS distribution is annotated next to each data point. Transcript names are labeled for n = 1. (D) Plot representing the distribution of Ψ sites and how they transition across transcript regions in primary T cells. Hypermodified type II transcripts have multiple Ψ sites, each localized in the 5′-UTR, CDS, or 3′-UTR regions of the transcript. (E) Plot representing the distribution of Ψ sites and how they transition across transcript regions in immortalized T cells. Hypermodified type II transcripts have multiple Ψ sites, each localized in the 5′-UTR, CDS, or 3′-UTR regions of the transcript.
We next examined whether type II ψ sites tend to cluster within the same transcript region or span multiple regions. Across both cell types, we observed a mix of region-restricted and region-distributed patterns, with the majority of ψ sites localized to the CDS and 3′ UTR (Fig. 4B,C). These findings suggest that certain transcripts may localize multiple ψ sites within a single functional domain, potentially reinforcing effects on translation efficiency (CDS) or mRNA stability (3′ UTR), while others exhibit dispersed ψ patterns that could integrate cotranslational and post-transcriptional regulatory inputs.
Interestingly, immortalized T cells displayed a distinct pattern of clustering: Type II ψ sites were more frequently confined to a single transcript region, forming dense modification blocks predominantly within the CDS or 3′UTR, particularly in transcripts with one or two ψ sites (Fig. 4E). In contrast, primary T cells exhibited a more regionally diverse distribution of ψ sites, with transcripts harboring two or three ψ sites more commonly spanning both the CDS and 3′UTR (Fig. 4D). This suggests that primary T cells may use regionally distributed pseudouridylation as a mechanism to coordinate multiple layers of gene regulation, while immortalized cells tend to exhibit more localized, region-specific modification patterns. Such compartmentalized clustering in immortalized cells could reflect a reprogramming of RNA modification dynamics, potentially favoring simplified or dysregulated pseudouridylation control that contributes to the altered gene expression programs characteristic of transformed states.
To explore whether known sequence motifs drive hypermodification, we extracted 5-mers centered on each Ψ site. Surprisingly, canonical motifs were rare: We identified only 18 TRUB1- and three PUS7-associated sites in immortalized cells and just four TRUB1-associated sites in primary cells (Supplemental Table 6). In both cell types, TRUB1 motifs appeared predominantly in transcripts bearing two Ψ sites (83% in Jurkat, 100% in primary T cells), suggesting that while some hypermodification may be enzyme-guided, most does not occur at well-defined motif sites.
Given the complexity of signal interpretation in nanopore sequencing, it is not surprising that some hypermodified type II sites may reflect interference from other uridine modifications or the combined effect of multiple modifications on the same transcript. This challenge is well-documented in structured RNAs such as tRNAs and rRNAs, where closely spaced modifications can distort local ionic current signals and reduce base-calling accuracy (Liu et al. 2019; Begik et al. 2021). In contrast, mRNAs typically harbor well-separated modifications, making them less susceptible to such interference under standard conditions. Thus, this limitation is primarily relevant for the subset of mRNAs bearing multiple nearby modifications—such as the hypermodified type II transcripts analyzed here—and is unlikely to affect the majority of singly modified mRNAs. Alternatively, some of the observed noncanonical ψ sites may arise from the activity of lesser-characterized pseudouridine synthases (PUS) lacking known sequence motifs, highlighting the current limits of motif-based inference in mRNA pseudouridylation.
The RNA-modification machinery shows similar expression levels across primary and immortalized T cells
To investigate the origin of the 13% of Ψ-sites that are uniquely detected in either primary or immortalized T cells—despite being on coexpressed transcripts—we considered whether these differences might arise from variation in the expression of PUS or other components of the RNA modification machinery. Although our study focuses specifically on pseudouridylation, we briefly assessed whether broader changes in RNA-modifying enzyme expression might help explain cell type–specific ψ patterns.
We compared the expression levels of known RNA modification enzymes—including PUS (enzymes)—to those of all other expressed transcripts in both primary and immortalized T cells using our DRS data set. By calculating log2 fold changes transcriptome-wide and ranking RNA-modification genes within that distribution, we found that these enzymes consistently fell between the 40th and 80th percentiles (Supplemental Fig. 7A), indicating modest and broadly similar expression levels across cell types.
While this analysis suggests that global differences in enzyme expression are unlikely to explain the cell type–specific pseudouridylation patterns we observe, it does not rule out the possibility of post-transcriptional regulation, isoform-specific activity, or differential recruitment of enzymes to particular transcripts. Thus, although RNA modification enzyme expression appears comparable overall, additional mechanisms likely contribute to the observed divergence in ψ-site occupancy.
RNA-seq data for primary and immortalized cell types confirm DRS results and show RNA-mod machinery is conserved across cell types
The DRS primary T cells analyzed were extracted from a single individual, which has the potential to introduce bias. Therefore, we complemented our analysis with publicly available data from the Human Protein Atlas's primary and immortalized cell lines. This approach allowed us to account for person-to-person variability in our DRS primary sample, as we included data from different individuals. We performed a differential comparison of five pairs of primary and immortalized cells from diverse tissue types (see Materials and Methods). These were selected because they had a paired primary and immortalized single-cell type in the Human Protein Atlas data set (Digre and Lindskog 2023).
We first examined the expression levels of modification machinery-associated genes relative to all transcript levels between primary cells and their immortalized counterparts. We did this by calculating the difference in expression for all transcripts and measuring the positions of mRNAs encoding RNA-modification machinery-associated genes relative to the population distribution found in the RNA-seq data (Supplemental Fig. 7B–G). As in our DRS data, the RNA-modification machinery falls near the middle of the transcriptome-wide expression levels distribution (Supplemental Fig. 7J), indicating that the RNA-modification machinery has similar expression in primary versus immortalized cells.
The transcriptome-wide expression levels for primary and immortalized T cells showed high concordance (root mean squared error [RMSE] = 2.08) between DRS and the Human Protein Atlas data (Supplemental Fig. 7H). The RNA-mod enzymes also showed high concordance across the two sequencing methods (Supplemental Fig. 7I). However, the two sequencing approaches showed some differences. The most significant differences (|log2FC| > 2) were found for the TRUB2, PUS7L, ZC3H13, and WTAP genes, which had a negative log2 fold change in the RNA-seq data set (lower expression in the immortalized Jurkat cells) and a positive log2 fold change in the DRS data set (higher expression in the immortalized sample).
Despite these fluctuations, the RNA-modification enzymes cluster around the 60th–90th percentile of log2 fold changes between cell pairings (Supplemental Fig. 7J). Although the RNA-seq data fall within a broader range of percentiles, the expression of RNA-modification machinery-associated genes is still consistent between primary and immortalized cells across all five paired cell types, which aligns with what we find for the DRS primary and immortalized sample (Supplemental Fig. 7A).
DISCUSSION
The use of immortalized cell lines is foundational in biomedical research. Jurkat leukemic T cells, in particular, have served as a critical model for uncovering mechanisms of T-cell signaling, activation, and immune response. However, the process of immortalization can lead to widespread molecular reprogramming, including alterations in transcription, RNA processing, and post-transcriptional regulation. It has been widely assumed—but not directly tested—that immortalization may reprogram the RNA modification landscape, including pseudouridylation. Here, we address this gap by using DRS to map transcriptome-wide ψ modifications in primary naive T cells and immortalized Jurkat cells.
Using our Mod‐p ID pipeline for high-confidence ψ detection, we found that 87% of ψ sites on coexpressed transcripts were conserved between primary and immortalized T cells, while 13% were cell type–specific. These results suggest that while the core pseudouridine landscape is largely maintained, immortalization induces targeted reprogramming at a subset of sites—potentially enabling new regulatory interactions or functional adaptations in transformed cells.
To further distinguish the effects of cell identity from immortalization, we compared ψ profiles across Jurkat, primary T cells, and HeLa cells. Jurkat cells shared more ψ-modified sites with primary T cells than with HeLa, paralleling similarities in gene expression. This reinforces the idea that ψ modifications are more strongly shaped by lineage than by immortalization status alone, with cell identity preserving core epitranscriptomic features even in the context of transformation.
Functionally, ψ sites conserved across cell types were enriched in housekeeping genes and RNA modification pathways, while sites unique to Jurkat were associated with immune signaling and oncogenic processes. These shifts point to a selective reprogramming of pseudouridylation in pathways relevant to T-cell activation and leukemic transformation. Furthermore, stable high-occupancy sites were enriched for the TRUB1 recognition motif (GUUCN), highlighting TRUB1's role in maintaining a core set of pseudouridylation events likely important for transcript stability and efficient translation. This suggests that while TRUB1 activity enforces a conserved pseudouridine program, context-specific reprogramming may emerge through additional factors, including variable transcript expression or targeting by other synthases.
Importantly, the expression of RNA modification enzymes—including those responsible for pseudouridylation (TRUB1, PUS7) as well as m6A, A-to-I, and dihydrouridine writers—was consistent across primary and immortalized T cells. This indicates that ψ-site divergence is not driven by broad shifts in enzyme abundance but is more likely explained by cell state–dependent differences in RNA substrates, subcellular localization, or regulatory cofactors. Indeed, the most pronounced differences in ψ-site presence occurred on transcripts uniquely expressed in one cell type, reinforcing a model in which transcript availability and context-specific RNA processing underlie ψ reprogramming during immortalization.
In summary, this study presents the first transcriptome-wide map of ψ modifications in primary and immortalized T cells, revealing a largely conserved pseudouridylation landscape with select site-specific differences introduced by immortalization. Although we do not resolve the underlying mechanisms driving these changes—beyond excluding global differences in enzyme expression—we uncovered key insights into T-cell pseudouridylation patterns. Conserved ψ sites were enriched in housekeeping and RNA processing genes, while cell type–specific sites were associated with immune signaling, oncogenic pathways, and apoptosis, suggesting links to cell state and function. Additionally, immortalized T cells exhibited more regionally clustered ψ patterns, potentially reflecting altered or simplified modification control compared to primary T cells. Together, these findings provide a valuable resource for studying pseudouridine regulation in T cells and emphasize the need to consider cellular context when interpreting RNA modification landscapes. Our data highlight both the utility and the caveats of using immortalized T cells as models for pseudouridylation studies and set the stage for future work to define the functional roles of ψ in immune cell biology and transformation.
MATERIALS AND METHODS
Cell lines
Jurkat cells were obtained from the ATCC (Clone E6-1; ATCC TIB-15) and maintained in RPMI 1640 (Cat No. 11-875-093) supplemented with 10% fetal bovine serum (Fisher Scientific, FB12999102) and 1% penicillin-streptomycin (Lonza, 17602E) at 37°C, with 5% CO2 in T75 flask containing 30 mL of complete growth medium. Human peripheral blood naive pan T cells were obtained from STEMCELL (STEMCELL: 200-0170) and directly used for RNA extraction.
Total RNA extraction
Total RNA was extracted from cells using a TRIzol (Invitrogen, 15596026) RNA extraction and the PureLink RNA Mini Kit (Invitrogen, 12183025). Briefly, cells were washed with ice-cold PBS and incubated for 5 min in TRIzol at RT (12 mL per flask containing ∼15 × 106 cells). Then, the solution was transferred to Eppendorf tubes, and 200 μL of chloroform (Thermo Scientific Chemicals, AC423555000) was added to each 1 mL of TRIzol. The solution was mixed by shaking it for 15 sec and incubated at RT for 3 min, followed by centrifugation for 15 min at 12,000g at 4°C. The aqueous supernatant was then transferred to a new tube, and the manufacturer's recommended protocol was followed for PureLink RNA Mini Kit RNA extraction. RNA was quantified using the RNA Qubit RNA High Sensitivity (HS) assay (Thermo Fisher, Q32852).
Poly(A) RNA isolation
According to the manufacturer's protocol, poly(A) mRNA was selected using the NEBNext Poly(A) mRNA Magnetic Isolation Module (E7490L). RNA was quantified using the RNA Qubit assay.
Direct RNA sequencing library preparation
A direct RNA sequencing library (SQK-RNA002) was prepared following the manufacturer's instructions. Poly(A) tailed RNA (500 ng) was ligated to ONT RT adaptor (RTA) using T4 DNA ligase (NEB, M0202M) and reverse transcribed by SuperScript III Reverse transcriptase (Invitrogen, 18080044). The product was then purified using Agencourt RNAClean XP beads (Beckman, A63987), ligated to the RNA adaptor (RMX), and purified by Agencourt RNAClean XP beads, followed by washing with wash buffer (WSB) and eluted in elution buffer (ELB). The final product was mixed with an RNA running buffer and loaded into PromethION flow cells (ONT, FLO-PRO002RA, R9 chemistry).
Genomic DNA extraction and library preparation
Genomic DNA was extracted using the Puregene Cell Kit (8 × 10⁸, QIAGEN, 158767) after the ONT lsk-114 protocol directions. This was followed by the standard ONT lsk-114 ligation protocol. Samples were sequenced on a PromethION device using R10 flow cells.
IVT library preparation
According to Tavakoli et al. (2023), we generated two paired IVT libraries for Jurkat and Naive T cells. Briefly, polyadenylated RNA samples were reverse transcribed to cDNAs and then in vitro transcribed into RNA using canonical nucleotides to delete the RNA modifications.
Base-calling and alignment
Guppy version 6.4.2 was used to base-call fast5 files. The base-called FASTQ files were then aligned to the human reference genome (hg38) using Minimap2 version 2.17 with the “-ax splice -uf -k 14” option. The aligned SAM files were converted to BAM and indexed using samtools version 2.8.13.
TPM calculations for DRS data
Transcript quantification for both libraries was performed using NanoCount version v1.o.0.post6 (Gleeson et al. 2022). Reads were aligned to the human reference transcriptome (gencode.v43) using minimap2 version 2.17 with the “-N 1” option to retain primary mappings.
Bootstrapping
According to McCormick et al. (2024a), we performed in silico resampling to generate five computational replicates for the DRS libraries of comparable size, each randomly sampled from the base-called FASTQ files for each cell line. This allows us to assess the statistical robustness of hypermodified type II ψ-site detection in the absence of biological replicates, allowing us to evaluate the consistency of ψ-site distributions and reduce the likelihood that observed patterns arose by random chance. We relaxed the threshold from 20 to 10 direct reads at a query position to account for the reduced number of reads. We used a 30% U-to-C mismatch value as the occupancy cutoff to define hypermodified type II sites in at least one replicate.
Pseudouridine detection and paired IVT enrichment
Using the same approach described by Fanari et al. (2025), we enriched the paired IVT with a pan-lymph-IVT obtained by merging the immortalized and primary T-cell IVT libraries. After defining the appropriate IVT control for each site between the paired and pan-lymph IVT sets, we detected the putative ψ sites using Mod-p ID. We then filtered the putative ψ to significant ones with a P-value <0.01 in at least one of the two conditions. We further filtered the sites to have >10 reads in the IVT sample, and to account for the presence of SNVs, we filtered the significant sites with sufficient coverage to those with a U-to-C base-calling error <10 in the IVT library.
Gene ontology analysis
Gene ontology (GO) analysis was performed using the Enrichr R package (v3.4) (Kuleshov et al. 2016). Separate enrichment analyses were conducted for transcripts containing conserved pseudouridine sites (i.e., shared between both cell lines), those containing unique ψ sites in primary cells, and those containing unique ψ sites in immortalized cells. As a background, we used the set of all genes with at least one uridine that was detectable with sufficient coverage in our direct RNA Nanopore sequencing data (number of reads in DRS >30), representing the effective search space for ψ site detection.
We queried the GO_Biological_Process_2023 and Reactome_Pathways_2024 databases and assessed statistical significance using the P-values reported by Enrichr. Pathways were considered enriched if they had a P-value <0.05.
Protein atlas RNA modification machinery-associated analysis
The following five pairs of primary and immortalized cells were downloaded from the Human Protein Atlas: Breast Glandular cells versus hTERT-HME1, Ovary versus SK-OV-3, ductal cells of the pancreas versus PANC-1, B-cells versus Raji, and Melanocytes versus SK-MEL-1. The transcript quantification was performed by using the normalized TPMs.
Selection of RNA-modification machinery-associated genes
We curated a list of genes associated with the RNA modification machinery, focusing on all the enzymes directly impacting the deposition of the post-transcriptional modification. For ψ, we assessed the expression levels for 13 different pseudouridine synthases (PUS) enzymes, including the two prevalent PUS enzymes acting on mammalian mRNAs, TRUB1 (GUUCN motif), and PUS7 (UNUAR motif). For m6A, we focused on the genes expressing the m6A writers and erasers, which promote and remove methylation. We excluded m6A readers from the analysis as they only recognize methylated sites, but they do not directly affect the installation/removal of the modification. We assessed the expression levels of the adenosine deaminase acting on RNA (ADAR) family enzymes for inosine. For dihydrouridine, we focused on the DUS enzymes family.
DATA DEPOSITION
All FASTQ data for Direct Libraries generated in this work have been made publicly available in NIH NCBI SRA under the BioProject accession number PRJNA1136513. All code used to analyze and generate the figures in this work can be found at https://github.com/RouhanifardLab/PsiDetectionTcell.
SUPPLEMENTAL MATERIAL
Supplemental material is available for this article.
ACKNOWLEDGMENTS
We acknowledge support from the National Institutes of Health (NIH R01HG013304 and NIH R01HG012856, S.H.R., M.W., O.F., Y.Q., M.M., and D.B.). We also thank Stuart Akeson and Miten Jain for helpful discussions about RNA modification machinery analysis and genomic DNA library preparation.
Footnotes
-
Article is online at http://www.rnajournal.org/cgi/doi/10.1261/rna.080633.125.
-
Freely available online through the RNA Open Access option.
- Received June 6, 2025.
- Accepted June 13, 2025.
This article, published in RNA, is available under a Creative Commons License (Attribution-NonCommercial 4.0 International), as described at http://creativecommons.org/licenses/by-nc/4.0/.
REFERENCES
MEET THE FIRST AUTHOR

Meet the First Author(s) is an editorial feature within RNA, in which the first author(s) of research-based papers in each issue have the opportunity to introduce themselves and their work to readers of RNA and the RNA research community. Oleksandra Fanari is the first author of this paper, “Pseudouridine reprogramming in the human T-cell epitranscriptome: from primary to immortalized states.” Oleksandra is a PhD candidate in the Bioengineering Department at Northeastern University, working in the lab of Dr. Sara Rouhanifard. Her research focuses on understanding RNA modifications and their role in gene regulation, particularly in the context of human cells. This study investigates pseudouridine dynamics in T cells, comparing primary and immortalized states to explore how cell identity and transformation influence the epitranscriptome.
What are the major results described in your paper and how do they impact this branch of the field?
In this study, we present the first comparative map of pseudouridine (Ψ) modifications in primary human T cells and immortalized T-cell lines using direct RNA nanopore sequencing. We show that immortalization is accompanied by a limited reprogramming of the pseudouridine epitranscriptome, and that the majority of pseudouridine sites are conserved between the cell lines at different occupancy levels. We further identify candidate pseudouridine synthases potentially driving site-specific differences. These findings highlight that immortalization is mainly a genomic event but also reshapes the post-transcriptional landscape. This has important implications for interpreting RNA modification data from cell lines, emphasizing the need to validate findings in primary systems.
What led you to study RNA or this aspect of RNA science?
RNA modifications are interesting to me because despite being small chemical changes, they could have big impacts on processes like translation, stability, or splicing. For this particular study, we were motivated by the frequent assumption in the field that immortalized cells might have a damaged or altered RNA modification machinery. We wanted to test this by comparing pseudouridine patterns and the enzymes responsible for their deposition in primary versus immortalized T cells, to better understand how immortalization affects the RNA epitranscriptome.
During the course of these experiments, were there any surprising results or particular difficulties that altered your thinking and subsequent focus?
One surprising result was the limited differences between primary and immortalized T cells in pseudouridine patterns. We expected a higher level of difference, but the limited number of unique sites in these two cell lines made us reconsider our first hypothesis, which was unexpected but exciting. We also found primary T cells to have more regionally diverse distribution of hypermodified type II ψ sites compared to immortalized cells. This was unexpected and interesting to us, as this difference may reflect a reprogramming of RNA modifications due to the immortalization process.
What are some of the landmark moments that provoked your interest in science or your development as a scientist?
Every time I joined a new lab was a landmark moment for me. Moving from Italy to Boston, then to Spain, and back to Boston again gave me the opportunity to work in very different research environments and learn from different scientific cultures. Each experience taught me something new—not only in terms of techniques or research topics, but also about what I enjoy doing in science and what I don't.
If you were able to give one piece of advice to your younger self, what would that be?
Learn what you like, and if you cannot figure out what you enjoy, then ask yourself what you hate. Sometimes this is the easiest way to understand what is good for you as a scientist. And while you try to figure that out, find good mentors and don't be afraid to ask questions. When I was younger, I was often too shy to speak up, especially when it came to asking questions to professors or experts at conferences. But I've come to realize that if you can ask a question, it's because the person in front of you is there to answer. Whether it's a speaker, a panelist, or a senior scientist, they've chosen to be there and are likely happy to engage and share their ideas with you.




