


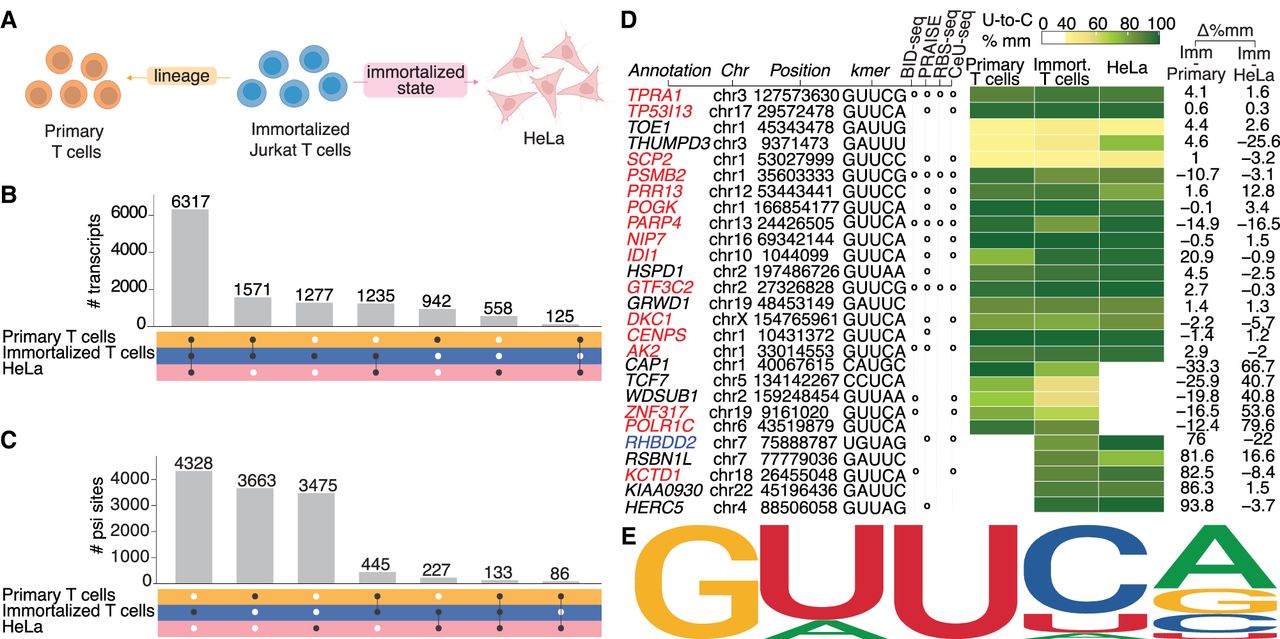
Comparison of immortalized and primary T cells to HeLa immortalized cell line. (A) Schematic representation of the comparison between immortalized state (immortalized Jurkat T cells vs. HeLa) and lineage (immortalized Jurkat T cells vs. Primary T cells). (B) Intersection of highly expressed transcripts (number of reads >20) across immortalized T cells, primary T cells, and HeLa cells. The histogram represents the number of transcripts shared among the indicated cell types. Black dots below each bar indicate which groups contribute to the intersection. (C) Intersection of ψ-sites detected in immortalized T cells, primary T cells, and HeLa cells (% U-to-C mismatch >10). The histogram represents the number of ψ modifications found in the indicated combinations of cell types. Black dots below each bar indicate which groups contribute to the intersection. (D) Heat map of hypermodified type I sites (% U-to-C mismatch >40) found in the three cell lines validated with orthogonal methods. For clarity, we only show the top five hypermodified type I sites found in two out of three conditions. Sites surrounded by a TRUB1 motif are highlighted in red, and sites surrounded by a PUS7 motif are highlighted in blue. (E) Sequencing logo of the hypermodified type I sites shared by immortalized T cells, primary T cells and HeLa.




