


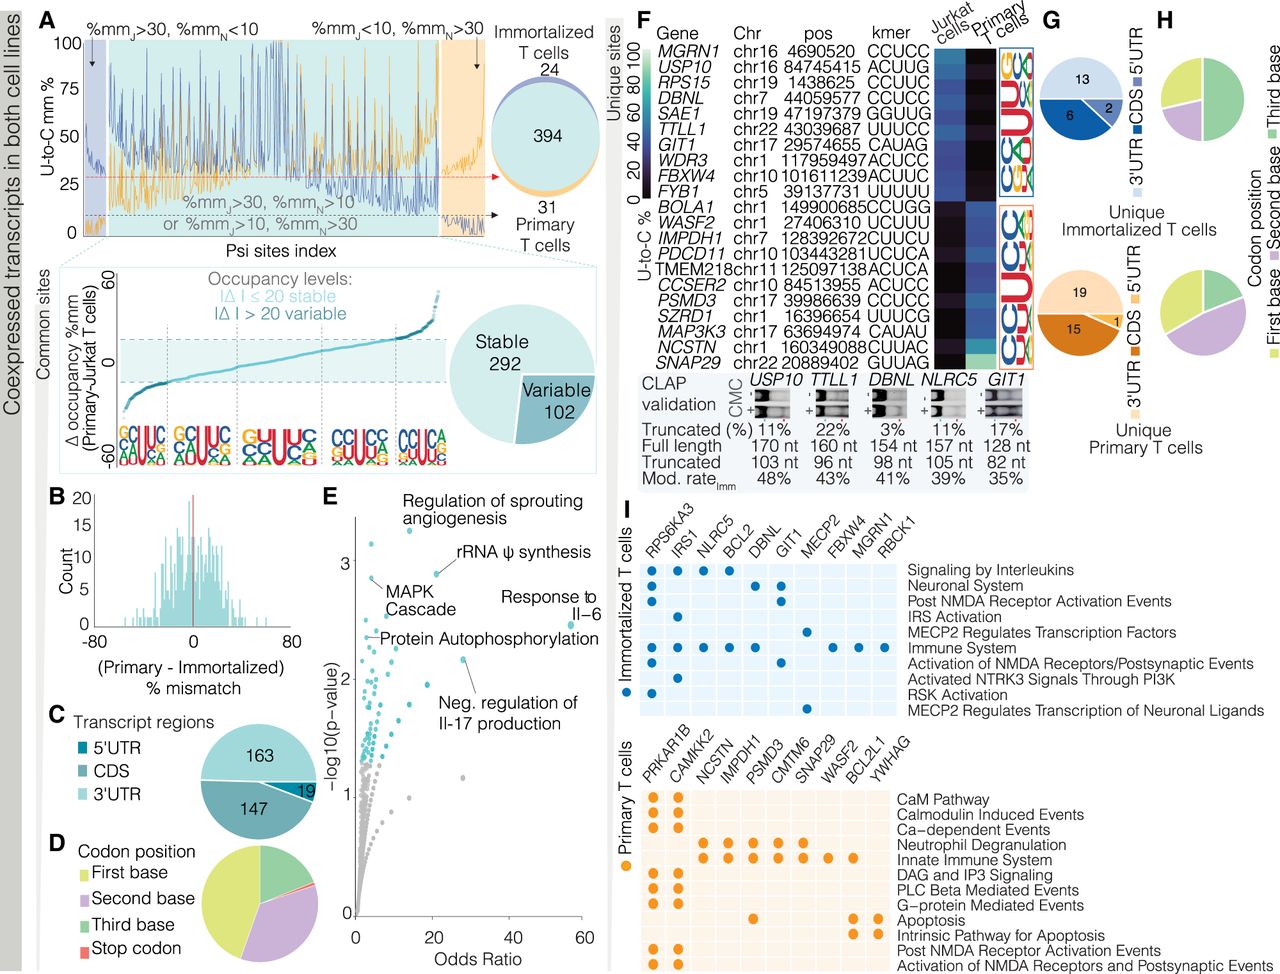
Pseudouridine profiles on coexpressed transcripts have mainly conserved positions with different occupancy levels and a limited set of unique sites in Jurkat and Naive libraries. (A, top left) Positional occupancy (mm%) for ψ sites in primary (orange) and immortalized (blue) cells, classified as unique (colored backgrounds) or shared (turquoise) based on U-to-C mismatch thresholds. The modification rate is a relative rate that can only be used to compare the same position within two cell types. (Top right) Venn diagram of unique and common ψ sites. (Bottom left) Δ occupancy (%) for shared ψ sites (primary minus immortalized) with a 20% threshold separating stable and variable sites; inset shows sequence logos by differential occupancy. (Bottom right) Pie chart of stable (light turquoise) versus variable (dark turquoise) shared sites. (B) Histogram showing a bimodal distribution of differential occupancy (U-to-C mismatch differences) for shared ψ sites. (C) Distribution of common ψ sites across the 5′ UTR, CDS, and 3′ UTR. (D) Common ψ-site distribution within the CDS by codon position (first, second, third nucleotide or stop codon). (E) Volcano plot of enriched GO Biological Process 2023 terms: odds ratio versus −log10(P-value); larger, darker points indicate higher significance (gray points: P > 0.05; labeled: P < 0.01). (F) Heat map of the top 10 unique ψ sites in immortalized and primary libraries (ranked by differential occupancy) with insets showing sequence logos for unique primary (orange) and immortalized (blue) sites; CLAP gel confirms ψ incorporation in Jurkat cells (see Supplemental Fig. 4A). (G) Distribution of ψ sites across the 5′ UTR, CDS, and 3′ UTR. (H) ψ-site distribution within the CDS by codon position (first, second, or third nucleotide). (I) Enriched GO Reactome Pathways 2024 terms for immortalized (blue, top) and primary (orange, bottom) T cells.




