


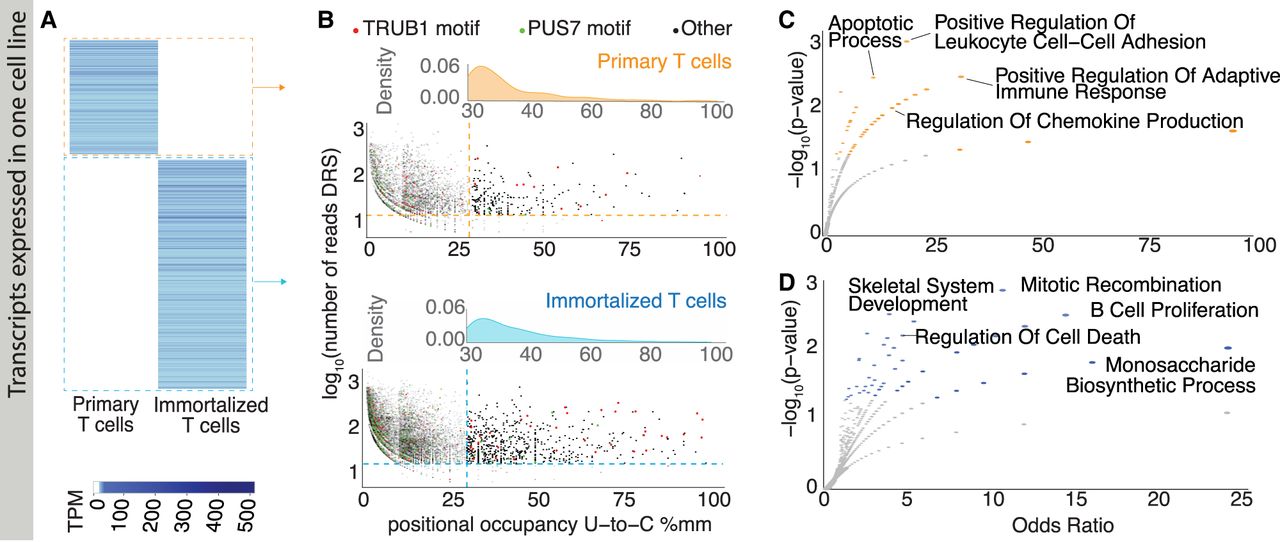
Pseudouridine profiles on transcripts uniquely expressed in immortalized or primary T cells. (A) Transcriptome-wide expression (TPMs) of unique transcripts in primary (orange) and immortalized T cells (blue). (B) Positional occupancy (U-to-C %mm) versus log-total reads for putative ψ sites (P < 0.001) in primary (top) and immortalized (bottom) cells. Red and green highlight known TRUB1 (GUUCN) and PUS7 (UNUAR) motifs, respectively; black points lack a motif. Dashed lines show minimum thresholds. (C) Volcano plot of GO Biological Process 2023 terms for ψ-sites on unique transcripts in primary (top) and immortalized (bottom) cells. Larger points indicate higher significance; gray points are nonsignificant (P > 0.05), with select terms labeled for P < 0.01.




