


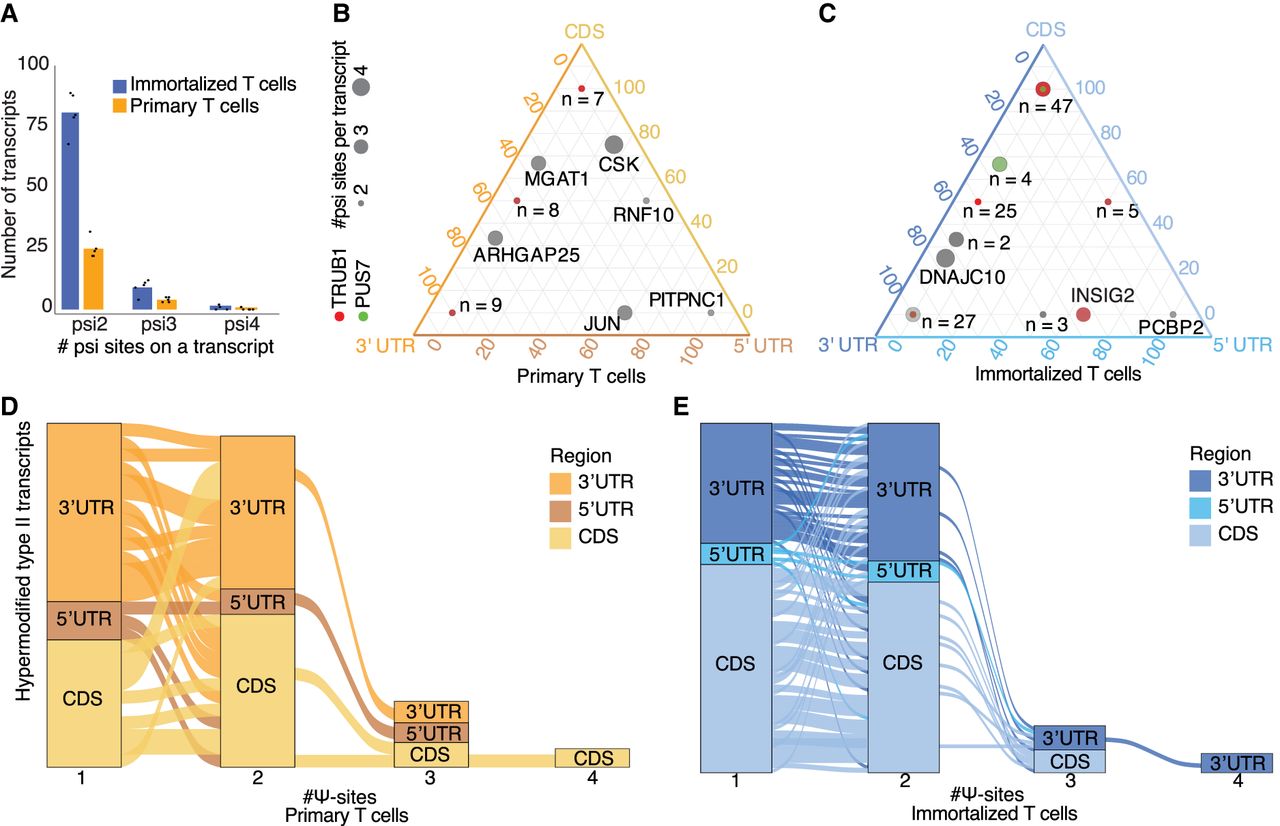
Hypermodified type II pseudouridine sites in immortalized and primary T cells. (A) Hypermodified type II transcripts with two to four putative ψ sites in primary (orange) and immortalized (blue) T cells; points represent in silico replicate detections. (B) Ternary plot showing the distribution of ψ sites across the 5′ UTR, CDS, and 3′ UTR in primary T cells; point size reflects the number of ψ sites on the same transcript, with transcripts harboring a TRUB1 motif in red and a PUS7 motif in green. Data points are annotated with the number of transcripts sharing the same UTR/CDS distribution. Transcript names are labeled for n = 1. (C) Ternary plot showing the distribution of ψ sites across the 5′ UTR, CDS, and 3′ UTR in immortalized T cells; point size reflects the number of ψ sites on the same transcript, with transcripts harboring a TRUB1 motif in red and a PUS7 motif in green. The number of hypermodified type II transcripts with the same UTR/CDS distribution is annotated next to each data point. Transcript names are labeled for n = 1. (D) Plot representing the distribution of Ψ sites and how they transition across transcript regions in primary T cells. Hypermodified type II transcripts have multiple Ψ sites, each localized in the 5′-UTR, CDS, or 3′-UTR regions of the transcript. (E) Plot representing the distribution of Ψ sites and how they transition across transcript regions in immortalized T cells. Hypermodified type II transcripts have multiple Ψ sites, each localized in the 5′-UTR, CDS, or 3′-UTR regions of the transcript.




