


Mapping RNA–protein interactions with subcellular resolution using colocalization CLIP
- 1Center for RNA Science and Therapeutics, School of Medicine, Case Western Reserve University, Cleveland, Ohio 44106, USA
- 2Department of Biochemistry, School of Medicine, Case Western Reserve University, Cleveland, Ohio 44106, USA
- 3Department of Molecular Genetics, University of Toronto, Toronto, Ontario M5S 1A1, Canada
- Corresponding author: jml371{at}case.edu
-
Handling editor: Javier Caceres
Abstract
RNA-binding proteins (RBPs) are essential for RNA metabolism and profoundly impact health and disease. The subcellular organization of RBP interaction networks with target RNAs remains largely unexplored. Here, we develop colocalization CLIP (coCLIP), a method that combines cross-linking and immunoprecipitation (CLIP) with proximity labeling, to explore in-depth the subcellular RNA interactions of the RBP human antigen R (HuR). Using this method, we uncover HuR's dynamic and location-specific interactions with RNA, revealing alterations in sequence preferences and interactions in the nucleus, cytosol, or stress granule (SG) compartments. We uncover HuR's unique binding preferences within SGs during arsenite stress, illuminating intricate interactions that conventional methodologies cannot capture. Overall, coCLIP provides a powerful method for revealing RBP–RNA interactions based on localization and lays the foundation for an advanced understanding of RBP models that incorporate subcellular location as a critical determinant of their functions.
Keywords
- RNA-binding proteins
- RNA localization
- cross-linking and immunoprecipitation (CLIP)
- proximity labeling
- stress granules
- HuR/ELAVL1
INTRODUCTION
RNA localization is a critical feature of many cellular processes, including the regulation of gene expression, mRNA stability, and translation. The coordinated efforts of thousands of RNA-binding proteins (RBPs) are central in mediating RNA outcomes. These proteins govern nearly all aspects of RNA metabolism, including RNA processing, nuclear export, translation, and eventual turnover (Gerstberger et al. 2014). Despite advancements in sequencing and imaging techniques for RNA localization (Taliaferro 2019; Le et al. 2022), pinpointing the exact sites of RBP–RNA interactions in subcellular spaces remains a significant challenge in RNA biology.
Our knowledge of RBP–RNA interactions has been revolutionized in the past decade by cross-linking and immunoprecipitation (CLIP) methods (Licatalosi et al. 2008, 2020; Darnell 2010; Hafner et al. 2010; Nostrand et al. 2016; Ule et al. 2018). These methods use UV irradiation of cells or tissues to generate covalent bonds between RNA and protein at near-zero distances. These protein–RNA cross-links enable the stringent purification of a given RBP with its in vivo RNA targets for subsequent deep sequencing. Still, CLIP does not preserve spatial information, making it difficult to determine the precise roles of specific RBP–RNA interactions based on localization.
Here, we develop a method to overcome this limitation by combining CLIP with proximity labeling using APEX2 (Lam et al. 2015) at predefined subcellular locations, termed colocalization CLIP (coCLIP). We establish coCLIP with benchmark tests on human antigen R (HuR), a well-studied RBP with specific binding profiles and functional roles based on subcellular localization. To set a foundational comparison for coCLIP, we conducted CLIP from nuclear or cytosolic fractions, subsequently using this technique for side-by-side analysis. HuR coCLIP maintains consistent and specific subcellular binding during arsenite stress compared to CLIP from fractionation. We further focus on the arsenite-induced stress response that results in HuR relocalization to stress granules (SGs). Our results reveal that HuR binding to target RNAs is location-specific and showcases the dynamic nature of HuR–RNA interactions at subcellular resolution. Moreover, HuR coCLIP shows altered sequence preferences for HuR binding within the cytosol and SGs that were previously uncharacterized. Overall, coCLIP provides a powerful method for uncovering RBP–RNA interactions based on localization, revealing how RBP interactions on transcript loci are organized in subcellular spaces.
RESULTS
Colocalization CLIP reveals HuR target interactions at subcellular resolution
To establish a universal method for delineating subcellular RBP–RNA interactions, we integrated CLIP with proximity labeling, using the engineered ascorbate peroxidase APEX2 (Lam et al. 2015; Hung et al. 2016). APEX labeling and similar proximity-based strategies (Qin et al. 2021) have been previously used to define subcellular proteomes (Rhee et al. 2013; Hung et al. 2014, 2017; Loh et al. 2016; Markmiller et al. 2018), transcriptomes (Kaewsapsak et al. 2017; Fazal et al. 2019; Padrón et al. 2019), and protein-occupied RNAs (Benhalevy et al. 2018). We hypothesized that combining a proximity approach with CLIP would allow us to simultaneously identify interactions of individual RBPs with their RNA targets at the subcellular level (Fig. 1A,B). We began by engineering cells to express APEX2 at predetermined locations such as the cytoplasm, nucleus, or within SGs using localization domains. For cytoplasmic localization, we used the nuclear export signal (NES) from cAMP-dependent protein kinase inhibitor (PKI) (Wen et al. 1995). For nuclear localization, we used the nuclear localization signal (NLS) from the SV40 large T antigen (Kalderon et al. 1984). Last, for SG targeting, we created a fusion protein with G3BP1 (Tourrière et al. 2023). After initiating the APEX reaction, we evaluated biotin labeling using fluorescent streptavidin and identified a streptavidin-reactive signal primarily confined to the labeling locations, which was stress-dependent in the case of G3BP1–APEX (Fig. 1C; Supplemental Fig. S1A).
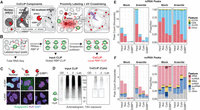
Colocalization CLIP (coCLIP) for subcellular resolution of RBP–RNA interactions. (A) An APEX2 enzyme is localized to a specific compartment, depicted here as either nuclear, cytoplasmic, or within stress granules as a G3BP1 fusion. The proximity labeling reaction using biotin phenol and hydrogen peroxide is performed, followed by UV cross-linking. (B) After cell lysis, the sample undergoes antibody-based RBP–CLIP. A second streptavidin pulldown following RBP IP enables the capture of local RBP targets. (C) Immunofluorescence for streptavidin reactive signal with and without labeling reagents for arsenite-stressed Huh7.5 cells with nuclear, cytoplasmic, or G3BP1 localized APEX2. Images were captured at 20× magnification. Scale bar, 10 µm. (D) Example autoradiograms for input HuR CLIP (left) or cytoplasmic HuR coCLIP (right) from two replicates. The size of HuR is indicated with an arrow and excised HuR:RNA complexes are indicated with boxes. (OD) RNAse overdigestion, (-Lab) no label. (E) HuR peak counts (left) and proportions (right) for mRNAs within input CLIP or from nuclear, cytoplasmic, or G3BP1 coCLIP in Huh7.5 cells. (F) HuR peak counts (left) and proportions (right) as in E for ncRNA peaks. See also Supplemental Figures S1–S3.
We next focused on HuR as a candidate RBP to assess the viability of our coCLIP approach. HuR is a ubiquitously expressed member of the ELAV family of RBPs (Abdelmohsen and Gorospe 2010). HuR shuttles between the nucleus and cytoplasm and binds to AU-rich motifs in 3′ untranslated regions (3′ UTRs) of mRNAs to affect stability (Abdelmohsen and Gorospe 2010). In the nucleus, HuR also interacts with introns to modulate the alternative splicing of specific mRNAs (Lebedeva et al. 2011). Typically, >90% of HuR is located in the nucleus; however, under stress conditions, HuR relocates to the cytoplasm and accumulates in SGs (David et al. 2007), as illustrated in Supplemental Figure S1B. Given HuR's ability to interact with different transcript features depending on its location—intronic in the nucleus and 3′ UTR in the cytoplasm—it emerged as a suitable candidate RBP for defining subcellular RBP–RNA interactions with coCLIP.
After confirming that UV cross-linking does not induce spurious APEX2 activity or nonspecific biotinylation (Supplemental Fig. S2A), we initiated APEX labeling in cells, followed immediately by UV cross-linking (see Materials and Methods). We carried out antibody-based CLIP for HuR in arsenite-stressed and unstressed conditions (Fig. 1D; Supplemental Fig. S2B) and performed streptavidin enrichment of eluates from HuR pulldowns (Fig. 1D; Supplemental Fig. S2C). We observed no significant differences in HuR–RNA signal intensities from input HuR CLIP across samples (Supplemental Fig. S2B). However, we noted that HuR coCLIP in the nucleus gave a more robust signal than coCLIP from the cytoplasm or SGs (Supplemental Fig. S2C), reflecting the distribution of HuR at steady state.
We performed coCLIP and created sequencing libraries from NLS, NES, or G3BP1-tethered APEX2 under mock or sodium arsenite conditions, all with associated input and enriched libraries, for 58 sequenced libraries in total (Supplemental Table S1). To facilitate robust and consistent data analysis, similar to previous efforts for CLIP in nonmodel organisms (Rozen-Gagnon et al. 2021), we further created a custom single command-line analysis pipeline, termed “CLIPpityCLIP,” to process raw sequencing data into peaks for subsequent analysis and visualization (Supplemental Fig. S3; see Materials and Methods). We first compared coCLIP data to input HuR CLIP in both mock and stressed conditions. We retained peaks if they appeared in at least half of the replicates and had reads above the median count across all samples. In the mock condition, input HuR CLIP yielded ∼104 HuR peaks on mRNAs with a characteristic preference for intronic (60%) and 3′ UTR (30%) binding as has been previously reported (Fig. 1E; Lebedeva et al. 2011; Mukherjee et al. 2011). Upon arsenite stress, we observed closer to 20,000 peaks, with a similar distribution in mRNA-binding preferences as in the mock condition (Fig. 1E). In coCLIP data sets, nuclear coCLIP showed an enrichment for introns (75%), similar to the input HuR CLIP, whereas cytoplasmic and G3BP1 coCLIPs revealed a preference for 3′-UTR binding (75%) (Fig. 1E). With stress, the HuR binding preferences were generally conserved across HuR coCLIPs, with a 14% increase in the 3′-UTR binding proportion for G3BP1 coCLIP. Between coCLIP data sets, we observed ∼10-fold more HuR target peaks from nuclear coCLIP relative to cytoplasmic and G3BP1 coCLIP in unstressed cells, likely reflecting the steady state distribution of HuR (Fig. 1E). Moreover, with arsenite stress, we observed a threefold and fivefold increase in the number of 3′-UTR peaks in cytoplasmic and G3BP1 coCLIPs, respectively (Fig. 1E).
A similar binding correlation was observed among noncoding HuR targets, where input HuR CLIP and nuclear coCLIP resembled each other in both conditions. In contrast, cytoplasmic and G3BP1 coCLIP yielded 10-fold fewer peaks in unstressed cells compared to nuclear coCLIP (Fig. 1F), with the number of peaks increasing by fivefold and 2.5-fold, respectively, with arsenite stress. We observed a unique enrichment of transposable elements (TEs) in cytoplasm and near G3BP1 upon arsenite treatment, consistent with previously observed accumulation of LINE/SINE elements such as ALUs in SGs (Fig. 1F; Moon and Namkoong 2023). Taken together, these results suggest that coCLIP can parse dynamic subpopulations of HuR within different cellular compartments under mock and stress conditions in situ.
HuR binding preferences remain consistent with coCLIP during arsenite stress
Next, we aimed to contrast coCLIP with standard CLIP derived from nuclear or cytoplasmic cell fractions. Cellular fractionation is widely used to provide insight into the function and composition of cellular organelles and is particularly useful when studying RBPs (Sanford et al. 2008; Brugiolo et al. 2017), such as HuR (Doller et al. 2008), that undergo nucleocytoplasmic trafficking. Following a commonly used protocol (Suzuki et al. 2010; Nabbi and Riabowol 2015), we conducted HuR CLIP from nuclear and cytoplasmic fractions with cells in both arsenite-induced stress and unstressed states (Supplemental Fig. S4A,B). As cellular stressors such as arsenite are known to alter nucleocytoplasmic transport (Zhang et al. 2018), we reasoned that this perturbation would allow us to observe alterations in HuR's binding preferences across RNA features and types. Importantly, we were unable to observe appreciable diffusion of labeled HuR from its nominal nuclear localization within the timescales of APEX labeling and UV cross-linking (Supplemental Fig. S4C,D). We generally observed twofold to 10-fold fewer peaks from coCLIP compared to fractionation CLIP (Fig. 2A). This discrepancy is reflective of a fundamental characteristic of coCLIP, which, involving a dual purification process, focuses on a specific subset of total interactions and is thus expected to yield a lower overall peak count compared to the broader scope captured by singular fractionation steps. Mirroring the coCLIP findings, the fractionation CLIP of unstressed cells revealed typical enrichment in mRNAs for intronic HuR binding events in the nucleus (75%) and primarily 3′-UTR binding events in the cytoplasm (60%) (Fig. 2A). Although coCLIP under stressed conditions maintained intronic preference in the nucleus and 3′-UTR preference in the cytoplasm, arsenite stress led to a balanced proportion of intronic and 3′-UTR binding in fractionation CLIP (Fig. 2A). For noncoding HuR targets, fractionation CLIP and coCLIP presented similar proportional distributions under normal conditions (Fig. 2B). In contrast, we observed a specific increase or TEs, snRNAs, and snoRNAs in cytoplasmic coCLIP under stress conditions. Overall, these findings indicate that arsenite can impact the results derived from fractionation methods, leading to changes in observed HuR binding patterns while emphasizing coCLIP's consistent performance under these conditions.
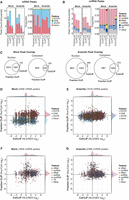
Consistency of HuR binding preferences with coCLIP under arsenite stress. (A) HuR peak proportions under mock and arsenite stress conditions for nuclear or cytoplasmic CLIP derived from classical fractionation or in situ labeling with coCLIP. (B) HuR peak proportions for ncRNAs as in A. (C) Venn diagrams depicting the overlap of peaks between fraction CLIP and coCLIP during mock and arsenite stress conditions for each compartment. (D–G) Scatterplots comparing nuclear to cytoplasmic ratios of HuR mRNA binding in coCLIP and fractionation CLIP during mock (D) and arsenite (E) stress conditions. Side histograms depict the relative density of each feature and are scaled for comparison within each feature and across mock and arsenite stress. (F,G) Similar scatterplots as in D,E for HuR binding on ncRNAs during mock (F) or arsenite (G) stress conditions. See also Supplemental Figure S4.
We next sought to directly compare nuclear and cytoplasmic enrichment for target HuR peaks in fractionation CLIP and coCLIP. We filtered for peaks that were present across either all NLS or NES coCLIP data sets or across all nuclear or cytoplasmic fractionation CLIP data sets for direct comparison and observed a high degree of overlap between coCLIP peaks and their fractionation counterparts (Fig. 2C). After calculating fold changes, we identified clear, annotation-dependent enrichment of nuclear introns and cytoplasmic 3′-UTR targets under mock conditions (Fig. 2D); this pattern was preserved exclusively in coCLIP during arsenite stress (Fig. 2E). For noncoding HuR targets, we noticed similar distributions between nuclear and cytoplasmic locations under both conditions; however, coCLIP demonstrated a pronounced nuclear enrichment for lncRNAs, snRNAs, and TEs in comparison to fractionation CLIP (Fig. 2F,G). We observed snoRNA enrichment in nuclear fractionation CLIP, but not in nuclear coCLIP, regardless of stress. Exploring the lack of snoRNA enrichment in nuclear coCLIP, we observed comparable snoRNA read frequencies across nuclear NLS and cytoplasmic NES coCLIP compared to cytoplasmic fractionation (Supplemental Fig. S4E). This observation suggests that the NLS-APEX fusion may not capture the entire spectrum of nuclear HuR interactions such as those of nucleolar-localized snoRNAs. Overall, these results suggest that although fractionation can produce anticipated outcomes under normal conditions, introducing arsenite stress may generate fractionation artifacts. By performing labeling in situ, coCLIP appears to circumvent these distortions.
HuR exhibits unique binding preferences in stress granules via coCLIP
Many compartments, particularly membrane-less organelles such as SGs (Anderson and Kedersha 2008; Protter and Parker 2016) are often transient, condition-dependent, and challenging to purify (Khong et al. 2017). coCLIP could offer a means to probe specific RBP–RNA interactions within these structures, allowing investigations even in their unstressed states. Previous APEX-based studies of SG proteomes (Markmiller et al. 2018) and transcriptomes (Padrón et al. 2019) serve as enabling precedents, laying a solid foundation for the deployment of coCLIP to probe specific RBP–RNA interactions and to discern the particular HuR targets residing within SGs with greater precision.
We performed HuR coCLIP using APEX tagged to the SG core protein G3BP1 (Tourrière et al. 2023) to study HuR–RNA interactions specific to SGs. For clarity, we describe these interactions as occurring in proximity to G3BP1, particularly in mock conditions in which SGs are not microscopically visible. Our analysis of peak enrichment highlighted a notable 3′-UTR enrichment for NES and G3BP1 adjacent coCLIP (Fig. 1E). Interestingly, despite both NES and G3BP1 coCLIP showing similar cytoplasmic localizations under microscopic examination, distinct target sets emerged between them (Fig. 3A,B). This discrepancy underscores the ability of our coCLIP method to sensitively and specifically unravel the complexities of RNA–RBP interactions within specific cellular locales.
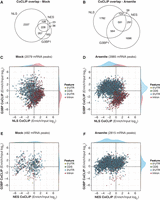
HuR exhibits unique binding preferences within stress granules. (A,B) Venn diagrams depict the overlap of peaks for all coCLIP data sets from either mock (A) or arsenite (B) stress conditions. (C,D) Scatterplots contrasting enriched coCLIP to input CLIP for mRNA-binding events as log2 fold changes, comparing G3BP1 coCLIP versus nuclear NLS coCLIP under mock (C) and arsenite (D) stress conditions. Side histograms depict the relative density of each feature and are scaled for comparison within each feature and across mock and arsenite stress. (E,F) Scatterplots as in C,D comparing G3BP1 coCLIP versus cytoplasmic NES coCLIP under mock (E) and arsenite (F) stress conditions.
Next, we analyzed the enrichment of HuR peaks between NLS, NES, and G3BP1 coCLIP, comparing them to input HuR CLIP under mock and arsenite-induced stress conditions (Fig. 3C–F). We observed clear intronic enrichment for nuclear HuR and 3′-UTR enrichment for HuR near G3BP1 (Fig. 3C) that was enhanced upon arenite treatment (Fig. 3D). HuR in both the cytoplasm and near G3BP1 exhibited heightened 3′-UTR enrichments relative to input HuR CLIP (Fig. 3F). However, the HuR specifically proximal to G3BP1 displayed a more pronounced 3′-UTR peak enrichment, which was absent for cytoplasmic HuR coCLIP (Fig. 3E). Moreover, compared to its nuclear or cytoplasmic counterparts, the G3BP1 proximal HuR revealed elevated TE peak binding (Supplemental Fig. S5) without similar enrichments in other noncoding RNAs (e.g., snoRNA, snRNA, rRNAs, and lncRNAs). These results suggest that HuR exhibits localization-specific target enrichment and binding preferences.
HuR demonstrates localization and condition-specific binding preferences across genomic loci and motifs
To further characterize HuR binding preferences across distinct cellular compartments, we conducted a metagene analysis on six genomic loci: the transcription start and end sites, translation start and stop sites, and splicing donor/acceptor sites (Fig. 4A). For nuclear HuR coCLIP, we noticed HuR binding enrichment near 5′ and 3′ splice sites with reduced signal in the 3′ UTR, a trend consistent between both mock and stress conditions. Cytoplasmic HuR coCLIP showed more robust enrichment for peaks in 3′ UTR compared to the nucleus. Intriguingly, in mock conditions, cytoplasmic HuR also demonstrated binding proximal to splice sites, a feature that persisted upon stress, albeit at reduced levels. HuR labeled in SGs distinctly favored 3′ UTRs under both conditions, corroborating our observations in the peak enrichment analysis (Fig. 3A).
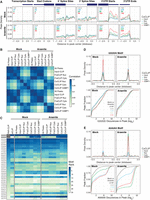
Genomic position and motif preferences for subcellular HuR. (A) Metagene profiles for HuR binding for input CLIP or coCLIP under mock or arsenite conditions centered on indicated mRNA features: transcription starts, start codons, 5′ and 3′ splice sites, 3′-UTR starts, and 3′-UTR ends. The number of peaks for each metagene profile is shown in the upper left corner. (B) Correlation matrix for HuR peak binding for all CLIP experiments by type. (Frac CLIP) Fractionation CLIP. (C) HuR binding motif ranks for all CLIP and coCLIP experiments ordered by PAR-CLIP rankings from Mukherjee et al. (2011). (D) Motif density within HuR peaks (top) and cumulative distribution for frequency of the UUUUU motif (bottom) in input CLIP or coCLIP in mock or stress conditions. (E) Motif density within HuR peaks (top) and cumulative distribution for frequency of the AAAAA motif (bottom) as in D. Indicated P-values calculated by Kolmogorov–Smirnov test.
Depending on localization, differential binding preferences for HuR were also observable at the motif level. We first calculated 5-mer motif densities around peaks (Supplemental Table S2). We used 34 target motifs previously characterized for HuR through PAR-CLIP (Mukherjee et al. 2011), and we determined the ranked order of motif enrichments for our data sets. Although we observed strong sample correlations between our samples as expected (R2 > 0.8) (Fig. 4B), we discerned intriguing differences between samples. Notably, the distinctions between nuclear and cytoplasmic fractionation CLIPs diminished under the influence of arsenite treatment. Conversely, the differences between nuclear, cytoplasmic, and SG coCLIPs became more pronounced under stress.
The differences observed in the correlation matrix were more apparent when we investigated our samples at the individual motif level (Fig. 4C). Generally, we observed that the rank order of the enriched motifs from our experiments matched well with what has been reported in the field (Lebedeva et al. 2011; Mukherjee et al. 2011; Nostrand et al. 2016), especially for uridine-rich motifs. Unexpectedly, we detected a pronounced enrichment of adenine-rich motifs compared to published data. Whereas A-rich motifs such as “WAAAA,” “AAAUW,” “WAAAU,” “UAAAW,” and “WUAAA”—previously identified as HuR targets—showed elevated enrichment levels, the “AAAAA” motif showed strong enrichment exclusively in the CoCLIP samples.
Analysis of motif density within peaks revealed a strong representation of the “UUUUU” motif across coCLIP samples and conditions (Fig. 4D), with the most significant binding to the “UUUUU” motif observed in HuR near G3BP1 under mock conditions. In addition, the cumulative distribution of “UUUUU” appearances within peaks showed that roughly 50% of peaks containing “UUUUU” have four or fewer motifs (including overlaps) under all samples and conditions and exhibited no statistically significant differences.
In contrast, adenine-rich motifs were enriched within HuR peaks in the cytoplasm and SGs under stress conditions (Fig. 4E). The cumulative distribution of “AAAAA” appearances within cytoplasmic and near G3BP1 peaks displayed statistically significant shifts between mock and stress conditions (Kolmogorov–Smirnov test, P < 0.01). Although 50% of peaks in cytoplasmic HuR contained at most one “AAAAA” motif, the number of “AAAAA” motifs significantly increased upon stress. HuR near G3BP1 showed a similar shift in which 50% of peaks in the mock condition contained two or fewer “AAAAA,” whereas, upon stress, 50% contained at least eight “AAAAA” motifs. These findings suggest that although HuR binds to its canonical AU-rich elements such as “UUUUU” and “AAAAA,” this binding may not be equivalent. Overall, our data suggest that HuR binding to adenine-rich motifs is location- and condition-specific. Specifically, the sequence motif context is distinct from uridine-rich motifs, as HuR-bound adenine-rich motifs are considerably longer than uridine-rich motifs upon stress.
Gene level analysis of subcellular HuR targeting reveals distinct gene set enrichments
Expanding our analysis beyond peak-level enrichment, we honed in on the interaction between HuR and RNA at the gene level. Our primary objective was to eliminate the possibility that the distinct HuR binding patterns we observed in specific locations were artifacts of transcriptomic alterations among different APEX-cell lines or between mock and arsenite treatment conditions. To this end, we conducted RNA-seq and differential gene expression analysis on the cell lines used for CoCLIP experiments, finding no statistically significant disparities between cell lines or our two conditions (Supplemental Fig. S6). Further, comparisons between stressed G3BP1–APEX CoCLIP and mock coCLIPs from any compartment revealed significant changes to HuR target selection, but no RNA-seq level changes (Fig. 5A). These data suggest that the observed changes in HuR binding across conditions are occurring because of the relocalization of HuR and/or target transcriptomes, and not because of changes in transcript levels. Moreover, HuR target genes exclusively enriched in the proximity of G3BP1 showed longer overall transcript lengths than targets enriched in the nucleus or cytoplasm (Fig. 5B), consistent with previous observations (Khong et al. 2017).
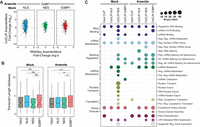
Gene level features of subcellular HuR targeting from coCLIP. (A) Stress versus mock comparisons of G3BP1 coCLIP data with respective mock conditions compared to matched gene level RNA-seq data. (B) Transcript length boxplots for input or coCLIP-derived HuR targets. Outliers are omitted for clarity. (C) Gene ontology analysis of HuR binding sites from input CLIP or compartment-specific coCLIP under mock or arsenite stress conditions. Individual gene ontology terms are shown in the right. Dot size represents statistical significance after FDR correction. Manually curated grouped GO terms are shown on the left. See also Supplemental Figure S6.
We next performed gene ontology enrichment analysis on the HuR target genes identified for different cellular compartments (Fig. 5C) to uncover potential associations attributed to HuR targets within different cellular environments. All target gene ontologies identified in input mock HuR CLIP were identified in at least one coCLIP data set, suggesting a level of conserved targeting. However, unique clusters of target genes became apparent under stress and cellular localization. For instance, HuR interaction with genes associated with mRNA nuclear export was exclusively observed in cytoplasmic HuR under mock conditions and was subsequently lost with arsenite stress induction. Genes associated with SG assembly were prominently enriched in G3BP1 CoCLIP under stress (Fig. 5C). These results shed light on the dynamics of HuR targeting and hint at a structured network where distinct subcellular RNA targets are functionally interconnected.
De novo HuR binding events and HuR flow across compartments
Our gene set enrichment analysis prompted us to investigate how the HuR translocation from one compartment to another affects its target gene repertoire. As our analysis is far from exhaustive by focusing on three compartments, we also wanted to account for HuR targeting events that appeared to be “de novo” upon stress. As the observed changes in HuR binding upon arsenite stress induction were not due to alterations in transcript abundance (Fig. 5A; Supplemental Fig. S6), these targeting events could be due to HuR:RNA translocation from other compartments as well as new binding events from HuR not bound to RNA. By dividing the identified HuR target genes into subgroups exclusive to each compartment and condition, we tracked target genes shared between mock and stress conditions in the same compartment or genes that were in one compartment in the mock condition but appeared in a different compartment upon stress. To our surprise, almost all (748/763 or 98%) HuR target genes uniquely enriched in nuclear coCLIP under stress conditions were de novo targets not associated with HuR in any tested compartment in the mock condition (Fig. 6A).
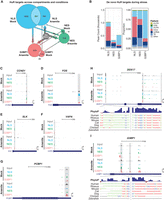
De novo HuR binding events and HuR flow across compartments. (A) Graphical illustration of common and unique HuR targeting events from nuclear, cytoplasmic, and SG coCLIP under mock and arsenite stress conditions. Arrows indicate the flow of binding events starting from the mock condition. De novo events are defined as those that appear only in stressed conditions. (B) De novo HuR binding event counts (left) and proportions (right) for nuclear, cytoplasmic, and SG coCLIP data sets. (C–G) Gene browser tracks of normalized HuR binding for input CLIP and coCLIP data on the (C) CCND1 3′ UTR, (D) FOS 3′ UTR, (E) SLK 3′ UTR, (F) VAPA 3′ UTR, and (G) PCBP1 3′ UTR. Highlighted regions indicate significant peaks of interest. Length and normalized peak height scales are indicated at the top and at the bottom right, respectively. (H) DDX17 intronic and 3′-UTR HuR binding. Sequence-level PhyloP scores and multisequence alignments for peaks of interest are shown. (I) G3BP1 3′-UTR HuR binding is shown with sequence-level PhyloP scores and multisequence alignments for indicated peaks.
Similarly, ∼80% of unique HuR targets proximal to G3BP1 (481/619) or NES-APEX (331/418) during stress were de novo targets. Furthermore, nuclear HuR targets uniquely enriched in mock conditions were also targets in the cytoplasm and near G3BP1 under stress conditions (80 and 130 genes, respectively). In contrast, only a small number of cytoplasmic and G3BP1 proximal HuR targets under mock conditions were observed in different compartments under stress. Within each compartment, 20% of nuclear targets were consistent between mock and stress conditions, whereas <5% of the targets in the cytoplasm and near G3BP1 were shared across conditions.
The de novo target genes for each compartment under stress conditions showed peak distributions (Fig. 6B) that were characteristic of each compartment (Figs. 2A and 3A,B). Notably, the enhanced TE peak binding observed in HuR proximal to G3BP1 under stress was absent among the de novo target genes. These results imply that HuR association with TEs is distributed evenly across the cellular compartments we have tested under mock conditions.
To further illustrate these variations in HuR binding, we examined individual gene tracks across different compartments and stress conditions. For example, HuR showed minimal binding on mRNA for the cell cycle regulator cyclin D1 under mock conditions (Fig. 6C). However, we observed strong HuR binding in the 3′ UTR of CCND1 mRNA in the input HuR CLIP upon stress induction. Through coCLIP, we discerned that this HuR binding predominantly occurred in the cytoplasm and within SGs, with no detectable binding in the nucleus. Likewise, the proto-oncogene Fos demonstrated no interaction with HuR across all compartments under mock conditions; however, under stress conditions, HuR binding to the 3′ UTR of the FOS transcript was evident, specifically in the nucleus and SGs (Fig. 6D). We also observed similar HuR binding patterns on the PCBP1 transcript, which encodes a multifunctional RBP implicated in alternative splicing, immune regulation, and cancer (Fig. 6G), where increased association with HuR in the 3′ UTR under stress conditions was primarily due to increased HuR binding in SG.
Furthermore, coCLIP data were sensitive enough to discern instances in which HuR binds to identical locations on a transcript during both mock and stress conditions but in different cellular compartments. For instance, the mRNA for the protein kinase SLK exhibited a robust association with HuR in the 3′ UTR of its gene in the cytoplasm under mock conditions (Fig. 6E). However, with arsenite-induced stress, although the HuR binding site remained constant, the interaction location transitioned from the cytoplasm to SG. Conversely, the VAPA transcript, encoding the endoplasmic reticulum membrane component VAP-A, demonstrated pronounced 3′-UTR binding with HuR in SG under mock conditions (Fig. 6F). Following arsenite treatment, this same binding interaction predominantly occurs in the cytoplasm. Our data also show intricate alterations in HuR binding that occur across different loci on a transcript, varying between subcellular compartments and conditions. For example, the DDX17 mRNA displays robust intronic HuR binding in the nucleus under mock conditions. However, upon the induction of stress, this intronic binding is reduced, but there is a corresponding peak increase in the 3′ UTR of the gene in the cytoplasm and near G3BP1 (Fig. 6H).
Last, coCLIP data displayed a poly(A) motif enrichment that was specific to arsenite-induced stress, most notably in the cytoplasmic and G3BP1 coCLIP. For example, although the aforementioned intronic peak in DDX17 mRNA contained a U-rich sequence, a 3′-UTR peak that was unique to HuR near G3BP1 upon stress contained a highly conserved A-rich sequence (Fig. 6H). We observed a similar change in motif preference in the 3′ UTR of the G3BP1 transcript, with a similar well-conserved A-rich stretch in the 3′-UTR peak in G3BP1 coCLIP (Fig. 6I). Collectively, our findings demonstrate that coCLIP is a robust and sensitive innovative method for studying RNA–RBP interactions with subcellular resolution.
DISCUSSION
Here, we report a novel method, coCLIP, that allows the investigation of RNA–RBP interactions at subcellular compartment resolution by combining CLIP with APEX2 proximity labeling. We used HuR, a ubiquitous RBP with known nuclear and cytoplasmic specific functions and binding profiles, as a benchmark for the utility of coCLIP. Our results show robust recapitulation of HuR binding patterns under normal cell growth conditions, with enriched binding to intronic regions in the nucleus and to 3′ UTRs in the cytoplasm.
We observed a notable disparity between the results obtained from fractionation and coCLIP, particularly under arsenite-induced stress conditions. Although fractionation methods demonstrated reliable results under normal (mock) conditions, this resolution was compromised under arsenite stress, displaying an equal proportion of intronic and 3′-UTR binding, potentially indicative of alterations in binding profiles. Conversely, coCLIP, with its in situ labeling approach, maintained consistent results under both mock and stress conditions, preserving the intronic and 3′-UTR preferences. We interpret these results to suggest that coCLIP is resilient to changes brought about by stressors like arsenite and, as such, offers a more accurate picture of RNA–protein interactions within subcellular compartments. Although Fraction CLIP excels in delineating RBP–RNA interactions in which such fractionation is feasible, coCLIP extends this capability to stressed and other dynamic cellular states, thus offering a versatile tool for a broader range of cellular compartments.
Our coCLIP experiments with HuR highlight the intricacies of binding patterns influenced by the subcellular location of HuR and the cellular context. We observed a discernible shift in target sets at the gene level between mock and arsenite stress conditions. Yet, at a more granular level, HuR's binding preferences exhibit adaptability within individual genes, moving to different but specific loci under varying conditions. For instance, the translational arrest induced by arsenite and other integrated stress response (ISR) agonists is thought to result in free mRNA that acts as a nucleation signal for G3BP and other mRNA-binding RBPs (Kedersha et al. 1999, 2002, 2016; Protter and Parker 2016; Sanders et al. 2020). We notably did not observe HuR binding to coding regions during stress but did observe an increase in 3′-UTR target binding, in terms of the number of targets and intensity at specific target loci. These results suggest that client proteins such as HuR may remain stably bound to their targets as they are redirected to SGs from other compartments, and perhaps that true “de novo” HuR binding is directed to specific loci within SGs. This could, for instance, explain the overall increase in the number of HuR targets observed during arsenite stress. However, without definitive knowledge of the proportion of HuR that is bound to RNA at any given time, how relocalization impacts the transition from free to bound HuR remains elusive. As the landscape of RNA–protein interactions and the resultant regulatory behaviors are shaped by a combination of factors, including the availability of cobinding RBPs and target RNAs, our findings underscore the need for detailed studies to unravel the specific cues guiding RBP target selection and localization, especially under stress conditions.
Based on these observations, coCLIP opens avenues for addressing intriguing biological questions centered on the regulatory dynamics of RNA–RBP interactions. For instance, what factors influence HuR's choice of one genomic locus over another, and how does subcellular localization affect this choice? We observed a unique shift in HuR binding preference from U-rich to A-rich motifs, specifically in cytoplasmic HuR populations. This shift may reflect HuR's regulatory flexibility, potentially driven by stress-induced changes that prioritize certain RNA targets. Exploring these questions from a protein-centric viewpoint could offer more insights, examining how posttranslational modifications of HuR (Grammatikakis et al. 2017) or alterations in the availability of proteins that bind cooperatively or competitively to similar motifs in the cytoplasm and SGs affect these interactions. Additionally, it is worth exploring whether this observed binding pattern shift is exclusive to HuR or represents a shared behavior across other nucleocytoplasmic shuttling RBPs (Pérez-Ortín and Chávez 2022), and in additional stress contexts (Gilbertson et al. 2018), which could further enrich our understanding of RBP–RNA interaction networks. The additional integration of APEX-seq (Fazal et al. 2019; Padrón et al. 2019) and APEX-MS data also present a ripe opportunity to situate specific RBP–RNA interactions within the broader cellular context of protein and RNA distribution networks.
Another important question is the relationships between changes in HuR binding and downstream functional roles within different cellular compartments. In addition to binding target gene sets that are shared across compartments and conditions, we observe that HuR binds distinct sets of genes in a location and context-specific manner. These results allow us to envision a framework in which the localization of HuR, in tandem with changes in local RNAs or protein concentration, influences RBP binding and, ultimately, downstream regulatory outcomes. This perspective corroborates regulatory models, such as RNA regulons (Keene 2007) and matchmaking RBPs (Chen and Mayr 2022), that describe how an RNA–protein complex may coordinate the regulation of functionally related mRNA transcripts. coCLIP presents a means to explore components of these intricate regulatory models at a subcellular level, potentially clarifying the mechanisms governing coordinated RBP–RNA interaction networks.
Limitations of this study
Although coCLIP advances our understanding of RNA–RBP interactions, its current design interrogates one protein within a designated compartment at a time. This specificity means that comprehensive insights, such as HuR target RNA interactions with additional RBPs in other compartments, remain to be explored. Further, in line with other proximity-based techniques, coCLIP may capture RBPs initially labeled in one compartment but subsequently trafficked to another. Although we detect minimal HuR diffusion across compartments during coCLIP labeling and cross-linking, this remains a formal possibility that emphasizes the importance of understanding RBP dynamics across compartments. Encouragingly, advances in dual-labeling approaches (Qin et al. 2023) hold promise in enhancing the accuracy of future studies.
MATERIALS AND METHODS
Plasmid DNA construction
To generate stable cell lines expressing APEX2 constructs, we cloned FLAG-APEX2 (Addgene 92158) into enhanced piggyBac (ePB) doxycycline-inducible expression vectors (Lacoste et al. 2009). Overlap PCR constructs encoding FLAG-APEX2 fusions with mKate2 fluorescent protein (Evrogen FP181) were cloned between BamHI and NotI sites in ePB vectors as follows: For cytoplasmic APEX, the NES (LALKLAGLDI) from PKI (Wen et al. 1995) was appended to the N terminus of FLAG-APEX2-mKate2; for nuclear APEX, the NLS (PKKKRKV) from SV40 LT (Kalderon et al. 1984) was appended to the N terminus of FLAG-APEX2-mKate2; for ER-localized APEX2, we cloned DNA encoding amino acids 1–60 from human Sec63 (Meyer et al. 2000) from cDNA and appended this sequence at the N terminus of FLAG-APEX2-mKate2; for SG APEX2, we fused G3BP1 containing the S149E mutation (Panas et al. 2019; Tourrière et al. 2023) to the C terminus of FLAG-APEX2-mKate2. All primers to generate these PCR amplicons are listed in Supplemental Table S3.
Cell culture and stable cell line generation
Huh-7.5 cells (Homo sapiens; sex: male) (Blight et al. 2002), were maintained at 37°C and 5% CO2 in Dulbecco's modified Eagle medium (DMEM, Fisher Scientific 11995065) supplemented with 0.1 mM nonessential amino acids (NEAA, Fisher Scientific 11140076) and 5% hyclone fetal bovine serum (FBS, HyClone Laboratories, Lot. #AUJ35777). All cell lines have tested negative for contamination with mycoplasma.
Stable cell lines were generated by transfecting 1 μg of ePB plasmid encoding localized APEX2 with 1 μg of pTransposase plasmid (Lacoste et al. 2009) using Lipofectamine 2000 (Invitrogen 11668027). Cells underwent selection with 2 μg/mL puromycin (Sigma P8833-25MG) to eliminate nontransfected cells. Doxycycline (Sigma D9891-1G) was used at 1 μg/mL to induce APEX2 expression.
APEX labeling and cross-linking
Cells were plated onto 10- or 15-cm dishes, and expression was induced for 2 d with 1 μg/mL of doxycycline. At 45 min before APEX labeling, sodium arsenite was added to the media to a final concentration of 0.5 mM, and plates were placed back into the incubator. At 30 min before APEX labeling, biotin-tyramide (Iris Biotech LS-3500.1000) was added to a final concentration of 500 μM, and plates were placed back into the incubator. APEX labeling was initiated at room temperature by adding H2O2 at a 1 mM final concentration to each dish. Cells were gently agitated for 1 min, and quenched twice in ice-cold quenching buffer (5 mM Trolox and 10 mM sodium ascorbate in DPBS). The quenching buffer was replaced with ice-cold PBS, and cells were immediately irradiated under 254-nm UV light on ice, once for 400 mJ/cm2 and once again for 200 mJ/cm2, using a Stratalinker 2400 (Agilent Genomics). These energies were based on our previous work with this same cell type (Luna et al. 2015, 2017). PBS was then replaced with quenching buffer. Cells were scraped into tubes and pellets were stored at −80°C for coCLIP.
CLIP and coCLIP
CLIP from cross-linked Huh7.5 cell pellets was performed generally following previous work (Luna et al. 2015, 2017) with modifications for coCLIP.
Bead preparation
Two sets of beads were prepared, one set for HuR antibody-based pulldown and a second for streptavidin pulldown. For HuR antibody pulldowns, protein G Dynabeads (Invitrogen 10004D) were washed 3× with and resuspended in antibody binding (AB) buffer (AB: PBS, 0.02% Tween-20). Per sample, 50 μL of beads was used. Beads were incubated with 3 μg of HuR 3A2 antibody (Santa Cruz sc-5261) per 50 μL beads for 30 min at room temperature or overnight at 4°C. Before IP, beads were washed in 1× PXL lysis buffer (1× PXL: 1× PBS tissue culture grade without magnesium or calcium, 0.1% SDS, 0.5% sodium-deoxycholate, 0.5% NP-40, with protease inhibitors). For streptavidin pulldown, we equilibrated 50 μL of MyOne T1 beads (Invitrogen 65601) per sample in 1× PXL containing no SDS.
HuR IP and on-bead enzymatic steps
Lysates from cross-linked cells were prepared by adding 1 mL of 1× PXL lysis buffer + quenchers + protease inhibitors (Roche 11873580001) and triturating to disrupt cells. Lysates were treated with 10 μL DNase (RQ1, Promega) and placed for 10 min on ice. Lysates were then treated with RNase I (Thermofisher EN0602), first diluted to the indicated concentration by volume (e.g., 1:100 for “overdigestion or OD,” or 1:5000 for “Low RNase”) in 1× PXL and then added at 10 μL per mL of lysate. RNase I concentrations were empirically determined to ensure optimal isolation of HuR–RNA complexes with sizes suitable for cloning, in line with established protocols (Moore et al. 2014). Lysates underwent thermomixing for 5 min at 37°C at 1100 rpm before being spun at 4°C on the max speed of a tabletop microcentrifuge for 10 min. All subsequent steps were done on ice or at 4°C unless otherwise indicated. Supernatants, along with any lipid layer, were harvested and mixed with PXL-equilibrated HuR antibody-bound beads for immunoprecipitation. Samples were nutated with beads for 2–4 h at 4°C . Beads were washed sequentially twice each with ice-cold 1× PXL, 5× PXL (same as 1× but using 5× PBS), and 1× PNK buffer (50 mM Tris-HCl, pH 7.5, 10 mM MgCl2, 0.5% NP-40).
To prepare RNA 3′ ends for linker ligation, IPs were treated with alkaline phosphatase. Beads were resuspended in 40 μL containing 1× dephosphorylation buffer, 3U of CIAP (Roche), RNasin inhibitor (Promega), and thermomixed for 20 min at 37°C, shaking at 1100 rpm for 15 sec every 2 min. Samples were washed as above sequentially in ice-cold 1× PNK, 1× PNK plus 20 mM EGTA, and twice with 1× PNK.
Radiolabeled linkers were prepared with a polynucleotide kinase (PNK) reaction consisting of 100 pmol of a 3′ inverted ddT blocked L32 RNA linker, 0.5 μL of 32P-γ-ATP (Revvity NEG035C005MC), 0.5 µL 1× T4 PNK buffer, 0.25 μL T4 PNK, and 0.3 μL RNasin inhibitor in a total volume of 5 µL per sample. Radiolabeled linker was usually prepared for 10 ligation reactions in a volume of 50 µL. Linkers were incubated for 20 min at 37°C, after which 2 µL of 10 mM ATP was added, and the reaction was incubated for an additional 5 min at 37°C . Linker was purified by passing through a G-25 column (GE Healthcare 27-5325-01) and stored at −20°C until use.
Linker ligation at 3′ ends was set up per sample after washes following alkaline phosphatase treatment by preparing a T4 RNA ligase 1 (NEB M0204S) reaction in 40 μL following the manufacturers’ instructions with 100 pmol of radiolabeled L32 RNA linker. Samples were incubated overnight at 16°C, shaking at 1100 rpm for 15 sec every 4 min. The next day, beads were washed twice each with 1× PXL and 5× PXL, before being equilibrated in 1× PXL.
coCLIP streptavidin pulldown and autoradiography
Beads containing immunoprecipitated radiolabeled HuR–RNA complexes were then subdivided into two parts: For total “input” HuR CLIP, 20% of the bead volume was set aside on ice. The remaining 80% of beads were used for HuR coCLIP and subjected to a subsequent streptavidin pulldown to capture location-specific HuR. The beads for coCLIP samples were first resuspended in 1× PXL containing 1% SDS, and HuR was eluted via incubation for 10 min at 70°C. Then, the eluted HuR supernatant was added to an equal volume of MyOne T1 beads equilibrated in 1× PXL containing no SDS, for a final SDS concentration of 0.5%. Samples were incubated nutating for 2 h at 4°C. All beads (both the input and coCLIP samples) were subsequently washed twice each with 1× PXL, 5× PXL, and 1× PNK. Protein was eluted off the beads by incubating with 30 µL of 1× LDS loading buffer (Invitrogen) without reducing agent for 10 min at 70°C, shaking at 1100 rpm. For the coCLIP samples, biotin was added to a final concentration of 1 mM before heat elution. Supernatants were run on Novex NuPAGE 8% Bis-Tris cells (Invitrogen WG1001BOX) in SDS-MOPS buffer at 4°C. Radiolabeled protein RNA complexes were transferred to BA85 nitrocellulose (Cytiva Amersham 45-004-007). After transfer, the membrane was rinsed with RNase-free PBS, and exposed to Biomax MR film (Kodak) typically from 3 h to up to 3 d at 70°C. Alternatively, membranes were placed onto phosphor screens (GE BAS-IP MS 2025), and imaged with a Typhoon Scanner (GE Amersham).
Nitrocellulose membranes were aligned with the exposed film, and regions of the membrane from low RNase IP lanes were excised corresponding to signal intensities for HuR–RNA complexes between 45 and 75 kDa. The 10–30 kDa above the HuR size region was chosen to confine the CLIP-seq analysis to RNA target fragments of 30–90 nt (assuming 3 nt/kDa) to avoid confounding variables from higher molecular mass complexes. RNA was liberated from membrane fragments using 200 µL of a 4 mg/mL proteinase K solution (Roche 3115828001) diluted in PK buffer (100 mM Tris-HCl, pH 7.5, 50 mM NaCl, 1 mM EDTA, 0.2% SDS) and incubated for 60 min at 50°C, shaking at 1100 rpm for 15 sec every 2 min. RNA fragments underwent acid phenol:chloroform extraction and were precipitated overnight at −80°C. RNA was pelleted by spinning at max speed (>13,000 rpm) in a tabletop centrifuge at 4°C, and washed twice with 75% ethanol. Following the drying of the RNA at the bench, the pellet was dissolved in 8 µL RNase-free water.
HuR footprint library generation and sequencing
CLIP footprints were reverse-transcribed using the Br-dU incorporation and bead-capture strategy described previously (Weyn-Vanhentenryck et al. 2014; Moore et al. 2018). Indexed reverse transcription (RT) primers were used (listed in Supplemental Table S3), allowing multiplexing of up to eight or 22 samples per Miseq or Nextseq 500 run, respectively. cDNA was circularized with CircLigase (Epicentre), pooled, and then amplified with PCR primers with Illumina sequencing adapters as described previously (Weyn-Vanhentenryck et al. 2014; Moore et al. 2018). Amplification was tracked with SYBR green (Life Technologies) on the QuantStudio real-time PCR machine (Thermo), and reactions were stopped once the signal reached 100K relative fluorescence units (r.f.u.). Products were purified with Ampure XP beads (Beckman) and quantified via Qubit assay (ThermoFisher) and/or Tapestation system (Agilent). Multiplexed samples were run on the Illumina Miseq or NExtSeq Mid-Output with 75-bp single-end reads.
RNA-seq library preparation
RNA-seq libraries were prepared for the stable cell lines expressing localized APEX2 in mock and arsenite stress conditions. Cellular stress was induced by treating cells with 0.5 mM sodium arsenite for 45 min. RNA was isolated with TRIzol reagent and stored at −80°C until use. RNA-seq libraries were constructed from total RNA using the NEBNext Ultra II Directional RNA-seq kit (NEB) with ribosomal RNA depletion, and sequenced on a NextSeq 500 Illumina Sequencer.
Cell fractionation
Cross-linked cell pellets were fractionated using the REAP method (Nabbi and Riabowol 2015) with modifications. Briefly, freshly pelleted and cross-linked cells were suspended in 500 μL of ice-cold REAP buffer (0.1% NP-40, in DPBS with complete protease inhibitors, Roche 11873580001), triturated 15 times, and incubated on ice for 10 min. The lysate was then clarified in a chilled microcentrifuge to create a cytoplasmic fraction and nuclear pellet. The ∼500 μL cytoplasmic fraction was saved in a separate tube into which 500 μL of 1× PXL was added and subsequently used for western analysis or CLIP. The nuclear pellet was washed twice with REAP buffer, and resuspended in 500 μL REAP + 500 μL 1× PXL before being used for western analysis or CLIP as above.
Western blots
Cell lysates were prepared in 1× PXL lysis buffer supplemented with complete protease inhibitors (Roche 11873580001). All lysates were prepared from equal cell numbers per condition. Protein concentrations were determined by Bradford assay (Bio-Rad), and 20 μg total protein per sample was run on NuPAGE gels (Life Technologies) and transferred to fluorescence-compatible nitrocellulose membranes (Millipore). Membranes were blocked in Odyssey PBS-based buffer (LI-COR) for 1 h, then primary antibodies were added for an overnight incubation at 4°C. Antibodies used for western blotting were HuR 3A2 (Santa Cruz sc-5261, 1:1000), TIA1 (Proteintech 12133-2-AP, 1:500), GAPDH (Cell Signalling 5174S, 1:1000), ADAR1 D-8 (Santa Cruz sc-271854, 1:1000), H3 (Cell Signalling 9715, 1:1000), and β-actin (Sigma A5441, 1:5000). After three washes in 1× PBS/0.05% Tween-20, membranes were incubated with fluorescent secondary antibodies (LI-COR, 1:25,000) for 1 h at room temperature. AlexaFluor 680 conjugated streptavidin (ThermoFisher S21378) was used during secondary antibody incubation at 1:10,000 dilution to mark biotinylated proteins. Membranes were washed three times in 1× PBS/0.05% Tween-20, rinsed in 1× PBS, and visualized on the Odyssey Imaging system (LI-COR).
Immunofluorescence
Cells were plated either on glass coverslips or black-walled clear-bottom 96-well plates (Corning 3904) that were coated with poly-l-lysine. Upon harvest, cells were fixed with 4% paraformaldehyde (PFA) for 10 min. PFA was then removed, and cells were stored at 4°C in PBS containing 1% FBS until processing. Cells were washed in PBS containing 0.1% Tween-20 (PBST), permeabilized with PBS containing 0.1% Triton X-100 for 10 min at room temperature, and blocked for 1 h at room temperature with a blocking solution of 5% BSA in PBST. Cells were stained with primary antibodies overnight at 4°C. Antibodies used for immunofluorescence were HuR 3A2 (Santa Cruz sc-5261, 1:1000) and FLAG M2 (Sigma F1804). After primary antibody incubation, cells were washed and stained with secondary antibodies donkey anti-rabbit AlexaFluor 594 (ThermoFisher A-21207, RRID:AB_141637) at 1:2000 and donkey anti-mouse AlexaFluor 594 (Abcam ab150108, RRID:AB_2732073) at 1:2000. AlexaFluor 488 conjugated streptavidin (ThermoFisher S11223) was used during secondary antibody incubation at 1:5000 dilution to stain biotinylated proteins. Nuclei were counterstained with DAPI (ThermoFisher Scientific D1306, RRID:AB_2629482) at 1 µg/mL, for 5 min before imaging. Fluorescent images were obtained on a Keyence BZ-X710 microscope or on a Cytation 7 (Agilent).
Bioinformatics
Detailed information for all bioinformatic processing with BITs and CLIPittyCLIP in this paper, including relevant shell and R scripts, can be found in the accompanying GitHub repositories related to this manuscript: https://github.com/LunaRNALab/CLIPittyClip and https://github.com/LunaRNALab/BITs.
FASTQ processing to finished peak matrix
To analyze all our data in a systematic manner, we created a custom single command-line tool, CLIPittyClip, to process sequencing reads into peaks (Supplemental Fig. S3). Briefly, FASTQ files were preprocessed using the fastx_toolkit (http://hannonlab.cshl.edu/fastx_toolkit/) and the CLIP Tool Kit (CTK) (Shah et al. 2017). We first collapsed identical reads to reduce redundancy and improve computational efficiency. Unique molecular identifiers (UMIs) were then stripped from each read and appended to read names, after which reads underwent demultiplexing to segregate reads based on their barcode sequences. After demultiplexing, barcode and adapter sequences were trimmed to ensure that only high-quality regions of the reads were retained. Reads were at minimum 16 nt long for downstream analysis.
Postpreprocessing, the reads were mapped to the human Hg38 reference genome using Bowtie2 (Langmead and Salzberg 2012) allowing zero mismatches. The alignment results, in SAM format, were converted to indexed BAM format using SAMtools (Li et al. 2009). BEDTools (Quinlan and Hall 2010) was then used to convert the BAM files into BED format as well as to generate genome-wide coverage files.
Peak calling was performed using HOMER (Heinz et al. 2010) starting from a tag directory that contained all mapped reads in BED format. Homer peak calling was performed with the following parameters: -style factor -L 2 -localSize 10000 -strand separate -minDist 50 -size 20 -fragLength 25. Identified peaks were further processed to create a standardized BED file: Peaks were sorted based on their genomic coordinates and filtered to retain only those on standard chromosomes (1–22, X, Y, and M). Read coverage on peaks across all samples was then calculated using BEDTools. Coverage for each sample was then assembled into a peak matrix for annotation, peak enrichment analysis, and plotting.
Peak annotation and prioritization
Peaks were annotated by extracting gene features from the Ensembl release 110 gtf file from GRCh38, as well as RepeatMasked regions (http://www.repeatmasker.org/) from the UCSC table browser (Karolchik et al. 2004). We first extracted protein-coding genes by gene biotype, and noncoding RNAs (miRNA, lncRNA, rRNA, snoRNA, scaRNA, snRNA, miscRNA) by transcript biotypes. Exons, coding DNA sequence (CDS) exons, introns, 3′ UTRs, and 5′ UTRs were also extracted. We further calculated a “downstream 10 kb” region to account for annotated 3′ ends of transcripts from all 3′-UTR endpoints. From RepeatMasker regions we extracted LINE and SINE elements, tRNAs, endogenous retroviral long terminal repeats (LTRs), low-complexity regions, and satellite repeats. CLIP peaks were then intersected with all the above annotations for overlap. We prioritized peak annotations in the following order: 3′ UTR, 5′ UTR, CDS, miRNA, lncRNA, rRNA, snoRNA, scaRNA, snRNA, miscRNA, tRNA, TE, Other, CDS_Retained_intron, ncRNA_Retained_intron, intron, downstream 10 kb, deep intergenic. TE consisted of the TEs LINEs and SINEs, and all other repeat masked regions were summed as “Other.” We further grouped all noncoding RNAs into an “ncRNA” category as needed. Any peaks that contained none of the above annotations were categorized as “deep intergenic.”
CLIP peak enrichment analysis
Peak enrichment analysis was performed on the annotated peak matrix by using stringent filters based on the biological complexity (i.e., replicate counts) and normalized read counts. For each group, peaks were first filtered to exclude any peaks that were not present in at least half of the respective replicates. The BC-filtered peaks for each group were further filtered by the read counts threshold, which was set as the median of the summed normalized read counts. From the filtered peaks, the peak enrichment score was calculated by directly comparing the summed normalized read counts per peak in different groups. To avoid division by zero in enrichment score calculation, pseudocount (nonzero minimum normalized read counts across all samples) was added to all sample normalized read counts.
Metagene analysis
Transcription start site, start codon, stop codon, transcription termination site, 5′ splice site, and 3′ splice site coordinates were extracted from Ensembl release 110 gtf file from GRCh38. Extracted feature site coordinates were extended by 500 nt upstream and downstream, and divided into 20-nt-long bins. Peak density in each bin was calculated by counting the appearance of peaks in the bin and normalizing the counts by the total peak counts.
Sequence motif analysis
Respective filtered peaks for fractionation, input, and coCLIP samples were used for sequence motif analysis. Using the peak coordinates, 150-nt-long sequences centered at the peak centers were extracted using the R BSgenome package, and the appearance of each HuR motif was counted for motif enrichment analysis. For HuR eCLIP, a peak file (ENCFF566LNK) was downloaded from the ENCODE consortium (Dunham et al. 2012). Motif counts were then used to rank order the motifs for comparison across different samples. For de novo motif enrichment and motif density analysis, all mapped reads for respective groups were combined and used as input for HOMER to call separate peaks as described above, Then, findMotifsGenome and annotatePeaks were used with settings recommended in the program documentation to calculate motif enrichment and motif density near peaks. Finally, peaks were classified by the number of AAAAA or UUUUU motifs they contained, and the distribution of the number of peaks per motif occurrences was normalized to generate cumulative distributions.
RNA-seq analysis
Sequencing FASTQ files were quality-filtered and adapter-trimmed using Trim Galore software (https://github.com/FelixKrueger/TrimGalore) with default settings for paired-end sequencing data. Processed reads were then mapped to the human Hg38 reference genome using the Rsubread subjunc (Liao et al. 2019) program allowing for a maximum of three mismatches in the reads. Gene level count information was generated using featureCounts with the GENCODE v43 gtf file from GRCh38. Differential gene expression analysis was performed by following the standard DESeq2 analysis protocol (Love et al. 2014).
Transcript lengths analysis
For genes that qualified for our location and condition-specific analysis, transcript lengths and support level information were downloaded using Ensembl BioMart. For each gene, transcripts with a support level of 1 or NA were kept as the representative gene lengths.
Quantification and statistical analysis
All statistical analyses were performed in R using the stats package. For cumulative distribution comparison in motif analysis, the Kolmogorov–Smirnov test (ks.test) was used. For comparisons of lengths of genes enriched in different compartments, a Mann–Whitney test (wilcox.test) was used.
DATA DEPOSITION
All the sequencing data generated by this study have been deposited in the NCBI Gene Expression Omnibus (GEO) database under accession numbers GSE245209 and GSE245210. All original code for analysis and data visualization is freely available on GitHub at https://github.com/LunaRNALab/CLIPittyClip and https://github.com/LunaRNALab/BITs.
SUPPLEMENTAL MATERIAL
Supplemental material is available for this article.
ACKNOWLEDGMENTS
We are grateful to Charlie Rice for his unwavering support, mentorship, and guidance. We thank Eckhard Jankowsky, Maria Hatzoglou, Kristian Baker, Caryn Hale, Ezgi Hacisuleyman, Erin Conlon, and Robert Darnell for technical advice and helpful feedback. We further thank Frank Tedeschi and Thomas J. Sweet for feedback and a critical reading of this manuscript. We gratefully acknowledge the Genomics Core Facility at the Genetics and Genome Sciences Department at Case Western Reserve University School of Medicine and the Genomics Resource Center at The Rockefeller University for their services. We further thank the members of the Rice and Luna laboratories for advice and support. This work was supported in part by the National Institutes of Health (NIH) under award T32 GM007250 (S.Y.), funding from the Case Comprehensive Cancer Center P30 CA043703 (J.M.L.), the American Cancer Society IRG-16-186-21 (J.M.L.), and start-up funds from the Department of Biochemistry at the Case Western Reserve University School of Medicine.
Author contributions: J.M.L.: conceptualization, methodology, investigation, writing—original draft, writing—review and editing, funding acquisition, and supervision; S.Y.: methodology, investigation, writing—original draft, and writing—review and editing; K.R.-G.: methodology; S.S.S.: investigation.
Footnotes
-
↵4 Lead contact.
-
Article is online at http://www.rnajournal.org/cgi/doi/10.1261/rna.079890.123.
-
Freely available online through the RNA Open Access option.
- Received November 16, 2023.
- Accepted April 4, 2024.
This article, published in RNA, is available under a Creative Commons License (Attribution-NonCommercial 4.0 International), as described at http://creativecommons.org/licenses/by-nc/4.0/.
REFERENCES
MEET THE FIRST AUTHOR
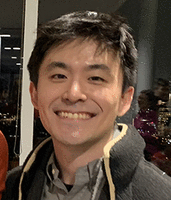
Meet the First Author(s) is an editorial feature within RNA, in which the first author(s) of research-based papers in each issue have the opportunity to introduce themselves and their work to readers of RNA and the RNA research community. Soon Yi is the first author of this paper, “Mapping RNA–protein interactions with subcellular resolution using colocalization CLIP.” Soon moved to the United States in 2011 and began undergraduate studies in engineering. Toward the end of his undergraduate studies, Soon started a research project on RNA folding, which sparked his interest in biochemical sciences. After obtaining a master's degree in biotechnology and gaining a year of experience as a research assistant, Soon decided to pursue further education in RNA sciences through the Case Western Reserve University MD/PhD program.
What are the major results described in your paper and how do they impact this branch of the field?
By combining the proximity labeling technique with cross-linking and the immunoprecipitation (CLIP) assay, we have developed a method that enables the investigation of RNA–protein interactions specific to cellular compartments. We tested this new method, which we named colocalization CLIP (coCLIP), using the RNA-binding protein (RBP) human antigen R (HuR). Using HuR coCLIP in the nucleus, cytoplasm, and stress granules, our results reveal distinct binding patterns of HuR in each compartment. We are excited about the potential of our method to be applied to other RBPs, expanding our understanding of cellular RNA–RBP networks.
What led you to study RNA or this aspect of RNA science?
The fact that biology evolved to use an intermediate data intermediary always fascinated me. My exploration of RNA science began with studying RNA folding, then progressed to investigating RNA-binding proteins, and eventually led me to focus specifically on RNA–protein interactions within specific cellular compartments. Looking back, this progression feels like a natural step-by-step process of asking one question after another, and I am grateful to all my mentors, who have been there to guide me through the process.
If you were able to give one piece of advice to your younger self, what would that be?
In hindsight, there is always a better way. While writing manuscripts and my PhD thesis, I often found myself thinking, “Why did I do it this way? I could have approached it differently and saved time and money!” But if I had known that then, it would be called “foresight” instead of “hindsight.” It is important to realize that in those moments when I was conducting experiments or analyzing data, I was doing so with the best of my knowledge. Learning from those experiences to improve, rather than being overly critical of oneself, is an important perspective to maintain.
What are your subsequent near- or long-term career plans?
My near-term career plan is to complete my degree in medicine and explore various clinical fields. I aim to continue my research in the RNA field, and it is intriguing to consider how I can apply my skills in basic biochemistry and RNA research to the practice of medicine.




