


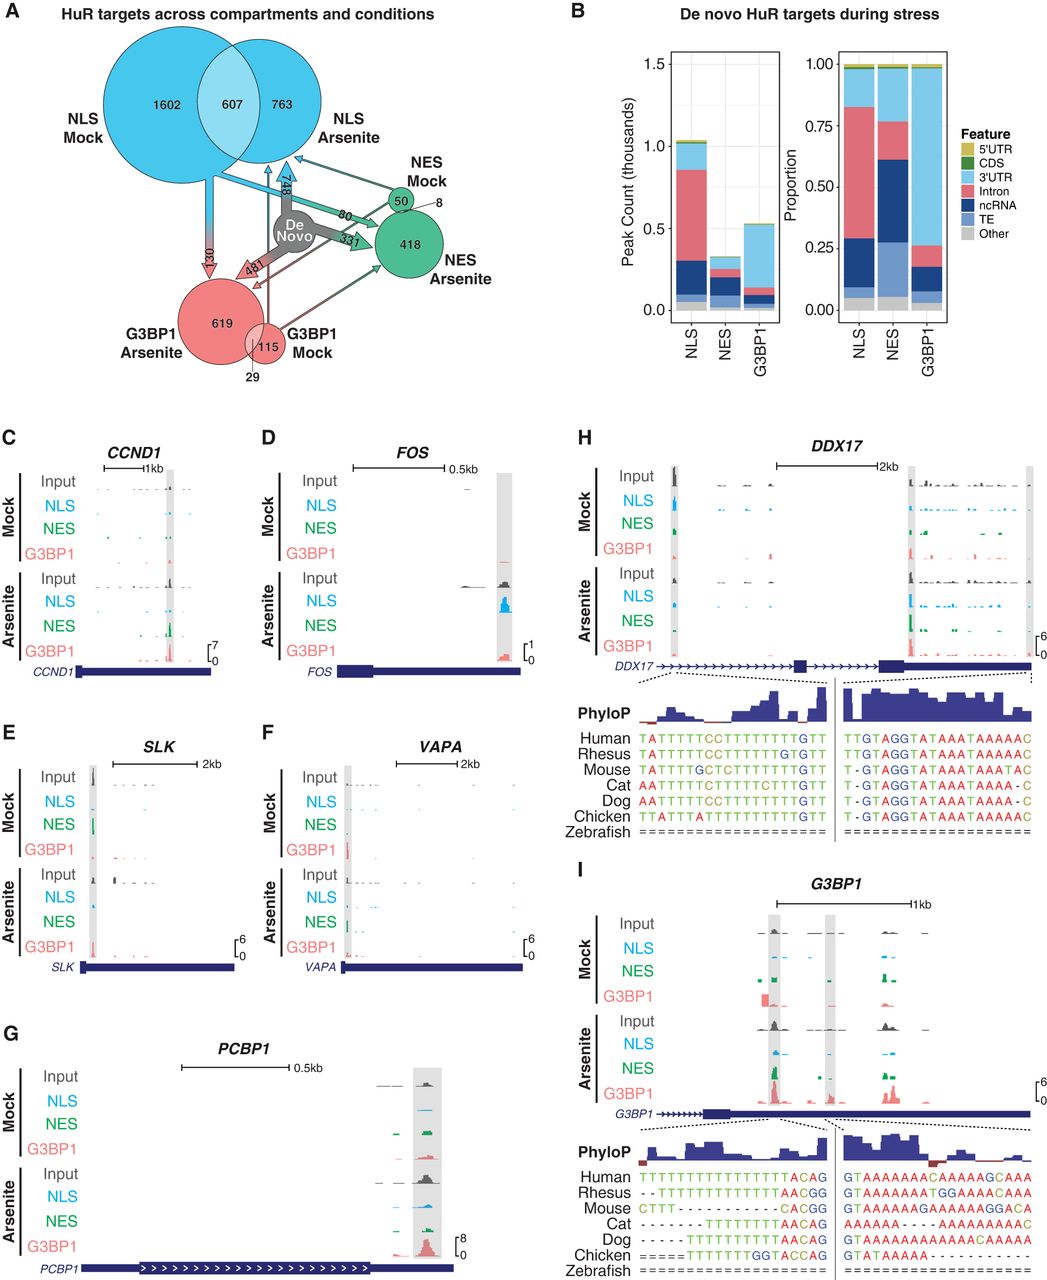
De novo HuR binding events and HuR flow across compartments. (A) Graphical illustration of common and unique HuR targeting events from nuclear, cytoplasmic, and SG coCLIP under mock and arsenite stress conditions. Arrows indicate the flow of binding events starting from the mock condition. De novo events are defined as those that appear only in stressed conditions. (B) De novo HuR binding event counts (left) and proportions (right) for nuclear, cytoplasmic, and SG coCLIP data sets. (C–G) Gene browser tracks of normalized HuR binding for input CLIP and coCLIP data on the (C) CCND1 3′ UTR, (D) FOS 3′ UTR, (E) SLK 3′ UTR, (F) VAPA 3′ UTR, and (G) PCBP1 3′ UTR. Highlighted regions indicate significant peaks of interest. Length and normalized peak height scales are indicated at the top and at the bottom right, respectively. (H) DDX17 intronic and 3′-UTR HuR binding. Sequence-level PhyloP scores and multisequence alignments for peaks of interest are shown. (I) G3BP1 3′-UTR HuR binding is shown with sequence-level PhyloP scores and multisequence alignments for indicated peaks.




