


Genome-wide kinetic profiling of pre-mRNA 3′ end cleavage
- RNA Therapeutics Institute, University of Massachusetts Chan Medical School, Worcester, Massachusetts 01605, USA
- Corresponding author: athma.pai{at}umassmed.edu
-
Handling editor: Mihaela Zavolan
Abstract
Cleavage and polyadenylation is necessary for the formation of mature mRNA molecules. The rate at which this process occurs can determine the temporal availability of mRNA for subsequent function throughout the cell and is likely tightly regulated. Despite advances in high-throughput approaches for global kinetic profiling of RNA maturation, genome-wide 3′ end cleavage rates have never been measured. Here, we describe a novel approach to estimate the rates of cleavage, using metabolic labeling of nascent RNA, high-throughput sequencing, and mathematical modeling. Using in silico simulations of nascent RNA-seq data, we show that our approach can accurately and precisely estimate cleavage half-lives for both constitutive and alternative sites. We find that 3′ end cleavage is fast on average, with half-lives under a minute, but highly variable across individual sites. Rapid cleavage is promoted by the presence of canonical sequence elements and an increased density of polyadenylation signals near a cleavage site. Finally, we find that cleavage rates are associated with the localization of RNA polymerase II at the end of a gene, and faster cleavage leads to quicker degradation of downstream readthrough RNA. Our findings shed light on the features important for efficient 3′ end cleavage and the regulation of transcription termination.
Keywords
INTRODUCTION
Cleavage and polyadenylation (CPA) at the 3′ end of a pre-mRNA molecule is a quintessential part of mRNA maturation. This step determines the composition of the 3′ untranslated region (UTR) and allows the release of mRNA from the active polymerase and chromatin environment (Neve et al. 2017). Cleavage is initiated by the recognition of a polyadenylation site (PAS) (Tian and Manley 2017), which stimulates the CPA machinery to perform endonucleolytic cleavage downstream from the PAS while RNA polymerase II (RNAPII) continues transcribing until other processes terminate transcription and degrade the readthrough transcript (Schwalb et al. 2016). An mRNA molecule is fully mature only after the addition of a tail of nontemplated adenines to the 3′ end [poly(A) tail]. The coupling of CPA protects mRNAs—together with the 5′ N7-methylguanosine cap—from premature degradation during nuclear export to the cytoplasm (Burkard and Butler 2000; Liu et al. 2014; Zhai and Xiang 2014). The spatiotemporal coordination of these processes is likely heavily regulated to ensure productive mRNA expression.
Eukaryotic mRNAs often contain many PASs, with extensive alternative poly(A) site usage leading to isoforms with alternative 3′ UTRs. 3′-UTR composition can influence poly(A) tail length (Kühn et al. 2009; de Klerk et al. 2012), export efficiency (Kühn et al. 2009), mRNA stability (Garneau et al. 2007), mRNA localization (Martin and Ephrussi 2009; Taliaferro et al. 2016), and translation efficiency (Spies et al. 2013; Floor and Doudna 2016). The usage of alternative poly(A) sites within upstream coding exons or introns can create truncated transcripts that result in altered protein composition or are targeted for degradation. Alternative PAS usage has been implicated in triggering many disease pathways (Elkon et al. 2013; Tian and Manley 2017), developmental or differentiation states (Sandberg et al. 2008; Berg et al. 2012), or cellular responses to stressors such as immune stimuli or heat shock (Di Giammartino et al. 2013; Pai et al. 2016; Vilborg et al. 2017). The recognition of PASs is regulated through a combination of local cis-regulatory sequences and global changes in the availability of necessary trans-regulatory factors, and transcription elongation rates (Bentley 2014; Tian and Manley 2017). The relative rates at which poly(A) sites are recognized within or across genes likely have a direct impact on the relative expression of different isoforms.
The development of high-throughput sequencing approaches to systematically capture and analyze nascent pre-mRNA molecules has opened the door for genome-wide kinetic profiling of RNA maturation processes (Alpert et al. 2017; Baptista and Dölken 2018). Many steps of RNA maturation—including mRNA splicing and cleavage—are thought to occur primarily cotranscriptionally (Bentley 2014), with substantial interplay between the efficiency and choices involved in each of these processes. Preliminary evidence suggests that intronic splice site and PAS choices are determined by kinetic parameters, such that sequence features or gene architecture might promote faster intron excision or transcript cleavage (Di Giammartino et al. 2011; Pai et al. 2017). Although these hypotheses are being increasingly tested and molecularly characterized for mRNA splicing (Bentley 2014), we still have very little understanding of the kinetic regulation of PAS choice and mRNA cleavage that determines the composition of the 3′ ends of mRNAs.
Previous studies have suggested that CPA is likely to occur relatively rapidly after RNA synthesis and can be temporally regulated (Salditt-Georgieff et al. 1980; Pandya-Jones et al. 2013; Coulon et al. 2014). An early molecular study measured the addition of radiolabeled adenosines to the 3′ ends of nascent pre-mRNAs and observed that polyadenylation (and thus cleavage) likely occurred within 1 min of mRNA biogenesis in mammalian cells (Salditt-Georgieff et al. 1980). However, this study only measured global RNA polyadenylation, with no ability to measure variation in the rates of cleavage across genes or alternative sites. More recently, insights from high-throughput sequencing of chromatin-associated RNA suggested that variation in splicing and 3′ end kinetics (rather than transcription initiation rates) controlled the timing of gene expression for multiple sets of immune genes (Bhatt et al. 2012; Pandya-Jones et al. 2013). Similarly, imaging studies have suggested that there is kinetic competition between splicing and cleavage in the process of mRNA maturation and that the temporal balance between these mechanisms can be regulated (Coulon et al. 2014). Together, these studies highlighted the need to more precisely estimate site-specific rates of CPA that govern the availability of mature mRNAs for downstream processes.
Here, we use high-throughput sequencing of nascent RNA and mathematical modeling to develop a method for estimating site-specific 3′ cleavage rates with temporal precision. Our approach is based on our previously published method for estimating intron-specific rates of mRNA splicing, which models the probability of observing splicing-informative junction reads across time since the synthesis of the pre-mRNA molecule (Pai et al. 2017). To apply this framework to estimate rates of cleavage, we initially perform simulations to (i) characterize reads informative about uncleaved and cleaved molecules, (ii) derive a model that measures cleavage half-lives given the probability of observing a ratio of uncleaved to cleaved molecules given time since pre-mRNA synthesis, and (iii) extend this model to estimate the rates of cleavage at alternative cleavage sites (CSs) within a gene. Applying this model to nascent RNA data from Drosophila melanogaster S2 cells, we estimate 3′ cleavage half-lives for ∼3000 CSs, identify sequence features associated with the rates of cleavage, and characterize RNAPII dynamics around sites with variable cleavage half-lives.
RESULTS
The processing of RNA molecules is thought to occur cotranscriptionally, with molecular steps initiating rapidly after recognition of splice sites or PASs for mRNA splicing and 3′ end cleavage, respectively. Thus, to measure the kinetics of RNA events, it is necessary to profile transient nascent RNA intermediates at the proper timescale. This is challenging to achieve with single locus quantitative PCR or single molecule imaging techniques, which are limited in either quantitative or temporal resolution, respectively, for rapid RNA processing mechanisms. To overcome these challenges, we recently developed a modeling approach to estimate the rates of mRNA splicing using data from high-throughput sequencing of nascent RNA labeled with 4sU over short labeling periods (Pai et al. 2017). Specifically, our approach uses the ratio of spliced exon–exon junction reads to unspliced intron–exon junction reads to model the half-life of intron excision. Since the progressive incorporation of 4sU over the labeling period results in a distribution of times since completion of synthesis of an intron—and thus of lifetimes over which an intron could be spliced—our model explicitly integrates over possible polymerase positions that could contribute informative junction reads. This allows us to estimate the probability of observing a junction ratio consistent with a given half-life. Since progressive, short time period metabolic labeling of nascent RNA also provides sufficient read coverage at the 3′ end of a gene, we took advantage of this and adapted our splicing rates model to estimate the rates of 3′ end pre-mRNA cleavage.
Identifying signatures of 3′ end mRNA cleavage in nascent RNA
We previously estimated mRNA splicing rates by empirically measuring exon–exon and intron–exon junction reads from 4sU-labeled nascent RNA-seq data, which unambiguously quantify spliced and unspliced molecules, respectively. To adapt this approach to estimate rates of 3′ end cleavage, we first have to identify nascent RNA reads informative about cleaved and uncleaved molecules. Reads that directly overlap the CS unambiguously arise from uncleaved molecules—however, there are no such reads that are exclusive to cleaved molecules. To identify a population of reads that could be used to quantify cleaved molecules, we used our previously published nascent RNA sequencing data set in D. melanogaster S2 cells, which includes 5, 10, and 20 min 4sU labeling time points, to assess patterns of read distribution around the CS. We find a depletion of nascent RNA reads around annotated CSs, with the extent of read depletion growing more pronounced as labeling time increases (Fig. 1A). We hypothesized that this temporally associated depletion reflects increasing numbers of cleaved molecules, which cannot contribute reads directly over the CS. Indeed, similar patterns of temporally associated read depletion were observed in reads generated from a simulated 4sU-labeled nascent sequencing data set (Supplemental Figs. S1 and S2A).
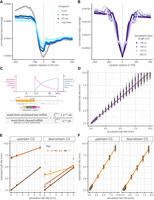
Developing a mathematical model to estimate site-specific rates of 3′ end cleavage. (A) Metagene plot showing average normalized 4sU-seq read coverage (y-axis) in a 1000 nt region centered on all annotated 3′ end CSs (x-axis), separated by 4sU labeling time points (blue lines) and steady-state total RNA data (gray line). The dashed line indicates the CS (coordinate 0), whereas dotted lines indicate the library fragment length. (B) Metagene plot showing the normalized read coverage for simulated reads (y-axis) in a 1000 nt region centered on a simulated 3′ end CS (x-axis), separated by variable simulated library insert lengths (purple lines). (C) Schematic of the expected read distribution resulting from progressive labeling with 4sU, as described in Pai et al. (2017). The probability of sampling uncleaved (pink) and cleaved (blue) transcripts is dependent on the cleavage half-life and polymerase position at the completion of the labeling period. Reads overlapping the CS can be used to approximate uncleaved transcripts, whereas reads located in a region upstream of the CS (defined by the library fragment length) are informative of the total number of transcripts and can be used to calculate the approximate number of cleaved transcripts. (D) 3′ end cleavage half-lives estimated by the mathematical model (y-axis) versus half-lives used to simulate read data (x-axis). The dotted yellow line indicates the y = x line of perfect correlation, whereas the purple line indicates linear fit to the data. (E) Cleavage half-lives estimated by the approach for constitutive CSs (y-axis) for simulated alternative CSs (panels) versus half-lives used to simulate read data (x-axis). The dotted gray line indicates the y = x line of perfect correlation, whereas colored lines indicate linear fits for sites with variable alternative usage. (F) Cleavage half-lives for alternative CSs estimated after proportionally correcting read counts by relative usage (y-axis) versus half-lives used to simulate read data (x-axis). Shown are estimates for all upstream CSs (left) and downstream CSs with a simulated PAU > 40% (right). The dotted orange line indicates the y = x line of perfect correlation, whereas the orange line indicates linear fit to the data.
We rationalized that we could obtain an expected value for the number of cleaved reads by using reads upstream of the CS to initially estimate the total number of transcripts that could be cleaved. Molecules resulting from RNAPII readthrough downstream from the CS are less informative since they are rapidly degraded by XRN2, reflected in the decrease in 4sU-seq reads in the region downstream from the CS (Fig. 1A). Despite the biological differences in the life span of upstream mRNA and downstream readthrough molecules, the shape of the dip in read distribution was symmetrical around the CS. This pattern was consistent with RNA-seq edge effects, where size selection for narrow fragment length distributions during library preparation causes a depletion of reads at the ends of molecules. Cleavage of nascent transcripts would result in edge effects for both the upstream and downstream molecules. Read coverage in the simulated data confirmed that the width of the read depletion distribution is associated with library preparation fragment length after size selection (Fig. 1B). Thus, we realized that it is necessary to control for the average fragment length in a library when identifying a region from which to quantify the total number of cleavable transcripts.
Together, these insights across the in vivo and simulated 4sU-seq data sets led us to define two sets of cleavage-informative reads: (i) reads overlapping the CS to quantify uncleaved transcripts (uncleaved reads) and (ii) reads overlapping a region two fragment lengths upstream of the CS to quantify cleavable transcripts (total reads) and estimate the expected number of cleaved transcripts (cleaved reads) (Materials and Methods; Fig. 1C). We see that the ratio of uncleaved reads to total reads decreased over 4sU labeling time in the 4sU-seq data from fly S2 cells, consistent with more molecules being cleaved over time (Supplemental Fig. S2B). Although this ratio correlates with cleavage half-lives in the simulated nascent data, the strength of the correlation is dependent on the length of the readthrough region (Supplemental Fig. S2C). This suggests that robust half-life estimation must account for polymerases continuing to contribute labeled reads while transcribing in the readthrough region, just as we accounted for the regions downstream from the 3′ splice site in our previous approach for estimating splicing rates.
Estimating the rate of 3′ end cleavage in fly S2 cells
To estimate the half-life of 3′ end cleavage, we modified our splicing rates approach to model the probability of observing a given ratio of uncleaved to cleaved reads (estimated empirically) integrating over a region accounting for both polymerase readthrough region (estimated using ChIP-seq data) (Supplemental Fig. S2D) and the labeling time (Materials and Methods). The model (Fig. 1C) makes three major assumptions: (i) a constant transcription rate over the entire region past the 3′ CS, (ii) RNAPII localization on the DNA is indicative of actively transcribing RNAPII after cleavage, and (iii) cleavage events will always occur to completion, thus necessitating adjustments to estimate rates of alternative sites. For constitutively used sites, this model was able to accurately assign absolute rates of 3′ end cleavage to each CS in our simulated 4sU-seq data (Spearman ρ = 0.98; Fig. 1D), across a range of simulated half-lives, expression levels, library preparation conditions, and genomic parameters. Furthermore, we see no detectable bias in the relative accuracy of half-life estimation across the simulated distributions of expression levels (Supplemental Fig. S2E), readthrough regions (Supplemental Fig. S2F), and transcription elongation rates (Supplemental Fig. S2G). Overall, results from our simulations indicate that modeling of progressive labeling 4sU-seq data can be used to robustly estimate rates of 3′ end cleavage.
As stated above, one of the limitations of our initial estimation of cleavage-informative reads is that our model assumes all reads are derived from transcripts that are constitutively cleaved at a site, which does not hold for alternatively used CSs (5% > PAU < 95%; Supplemental Fig. S3A). The presence of reads from transcripts that are cleaved at an alternative site within the same gene results in an artifactual increase in uncleaved reads and an overestimation of 3′ end cleavage half-lives for alternative sites in both simulated (Fig. 1E; Supplemental Fig. S3B) and 4sU-seq data (Supplemental Fig. S3C). Thus, we modified our read estimation scheme to proportionally allocate informative reads to alternative CSs based on (i) the relative usage of the sites, (ii) the genomic order and position of the sites, and (iii) the first two assumptions used for estimating constitutive rates above (Materials and Methods; Supplemental Fig. S4). Our 3′ end cleavage rates model performs quite well to estimate the 3′ end cleavage half-lives of alternative sites using these adjusted reads (Spearman ρ = 0.98 and 0.96 for upstream and downstream sites, respectively) (Fig. 1F; Supplemental Fig. S3D).
Alternative 3′ cleavage sites are cleaved slower than constitutive sites
We applied this novel model for estimating 3′ end cleavage rates to our previously published time course of 4sU-seq data from D. melanogaster S2 cells (Pai et al. 2017). After filtering for sites with sufficient power to estimate rates (Materials and Methods), we modeled cleavage rates for 2857 constitutive (PAU > 95%) and 1601 alternative (5% < PAU < 95%) sites in S2 cells. Within this set, we were unable to obtain rates for 185 constitutive and 1352 alternative sites (after read adjustment) that had no uncleaved reads at any time point, suggesting that these sites are cleaved faster than the resolution afforded by our labeling time course. Additionally, we were only able to estimate rates of upstream-most alternative sites, likely due to a combination of reduced usage of distal sites and the 4sU-seq 5′ bias leading to decreased read coverage at sites further from the transcription start site. Among the remaining sites, the distributions of CSs are relatively similar across constitutive and alternative sites, with median rates of 0.019 and 0.016 for constitutive and alternative sites, respectively. These rate constants correspond to median cleavage half-lives (t1/2) of 35.8 ± 0.04 and 42.1 ± 0.59 sec for constitutive and alternative sites, respectively (Fig. 2A).
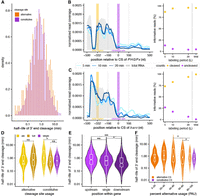
Estimating cleavage rates at constitutive and alternative sites. (A) Distribution of 3′ end cleavage half-lives for constitutively (PAU > 95%; purple) and alternatively cleaved sites (5% < PAU < 95%; orange). (B and C) Nascent RNA coverage at the 3′ ends of PHGPx (B) and barc (C), separated by 4sU labeling time points (blue lines) and steady-state total RNA data (gray area). The regions from which the total mRNA and uncleaved molecule read counts are obtained are shaded in yellow and purple, respectively. The right panels show the estimated proportions of cleaved (yellow) and uncleaved (purple) read counts. (D) Distribution of estimated 3′ end cleavage half-lives separated by annotated site usage. ALE refers to alternative last exons (alternative n = 12; constitutive n = 24), tUTR refers to tandem 3′ UTRs where more than one CS is in the same exon (alternative n = 251; constitutive n = 359), and single sites are in genes with only one annotated CS (constitutive n = 2398). (*) P < 0.05. (E) Distribution of estimated 3′ end cleavage half-lives for constitutively used CSs (PAU > 95%) separated by annotated position in a gene. Upstream refers to the first site (n = 171), single sites are in genes with only one annotated CS (n = 2398), and downstream refers to non-first sites (n = 210). (*) P < 0.05, (***) P < 0.0005. (F) Distribution of estimated 3′ end cleavage half-lives for quintiles of PAU values (n = 8, 8, 31, 61, and 155 for alternative sites across quintiles from 5%–20% to 80%–100%), separated by alternatively used (orange) and constitutively used CSs (purple). (*) P < 0.05.
Although there were no significant gene ontology terms that were enriched among sets of genes with the fastest or slowest cleavage rates, representative examples support how the rate of cleavage may contribute to the temporal regulation of mRNA expression. For instance, we find that the CS of PHGPx is among the fastest cleaved sites that we can measure, with a cleavage half-life of 29.04 sec (Fig. 2B). PHGPx encodes for a ubiquitously expressed peroxidase that may have a role in cellular homeostasis and response to oxidative and ER stresses (Missirlis et al. 2003; Wang et al. 2014). Fast cleavage of PHGPx may aid in the rapid production of mRNA that can be exported to the cytoplasm, which may be important given the gene's role in biological functions that are dynamically regulated due to environmental stressors. In contrast, we see that the CS of the barricade (barc) is cleaved much slower, with a half-life of 2.1 min (Fig. 2C). This gene encodes for a splicing cofactor that is part of the U2 spliceosomal complex and aids in the regulation of mRNA splicing and neurogenesis (Abramczuk et al. 2017). Due to the involvement of barc in these core biological processes and its 12 kb length (including two introns spanning 7 and 3 kb, well above the average intron length in D. melanogaster) (Lim and Burge 2001), slower cleavage may enable coordinated regulation of other RNA processing events and prioritize the production of fully processed mRNAs before release from the chromatin environment.
On average, half-lives for alternative CSs were slightly but significantly slower than constitutive sites (Welch's two-sample test P-value = 0.0006). Similarly, sites that are associated with annotated alternative last exons trend toward being cleaved slower than single sites on average (t-test P-value < 0.042; Fig. 2D), despite being constitutively used in S2 cells, suggesting a small delay in recognizing or initiating cleavage at alternative sites that may be temporally coupled with local splicing decisions. Similarly, when a gene has multiple annotated CSs, the downstream sites in a gene are cleaved significantly faster than single and upstream CSs (Mann–Whitney U P-values = 3.45 × 10⁻⁴ and 5.1 × 10⁻⁵, respectively), again despite these sites being constitutively used in S2 cells (Fig. 2E). This observation indicates that the relative position of a CS in a gene may play a role in the speed of cleavage, with a delay in cleavage if other sites remain to be transcribed downstream. Finally, the 3′ end cleavage half-lives of alternative sites were weakly associated with the relative usage of the sites (Fig. 2F), such that sites with less relative usage were cleaved slower (t-test P-value = 0.048 and 0.043 for 40%–60% vs. 80%–100% and 60%–80% vs. 80%–100% comparisons; respectively. Only groups with sufficient samples sizes were tested). Together, these observations suggest that the kinetics of 3′ end cleavage may play a role in the regulation of alternative cleavage decisions.
Faster cleavage is associated with the strength and number of PAS elements
The initiation of 3′ end cleavage is mediated by the recognition of multiple cis-regulatory RNA elements located both upstream and downstream from the CS. These include the PAS and downstream sequence element (DSE), positioned 10–30 nt upstream and ∼10–40 nt downstream from the CS, respectively (Zarudnaya et al. 2003; Hu et al. 2005; Neve et al. 2017; Sanfilippo et al. 2017). To understand how cis-elements influence the rate of 3′ end cleavage, we first calculated nucleotide composition in the 100 nt window around constitutive CSs. We broadly recapitulate the known nucleotide distributions across all sites, characterized by (i) an A at the CS, (ii) an overall enrichment of AU content around the CS, (iii) an A-rich region 10–30 nt upstream of the CS, and (iv) a U-rich region 5–25 nt downstream from the CS (Supplemental Fig. S5A; Zarudnaya et al. 2003; Hu et al. 2005; Nunes et al. 2010; Neve et al. 2017; Sanfilippo et al. 2017). Strikingly, we see that these sequence characteristics are enhanced in the CSs with the fastest half-lives, combining across both constitutive and alternative sites, with a greater proportion of A and U content upstream and downstream from the CS, respectively (Fig. 3A).
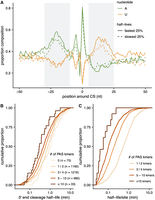
RNA sequence elements are associated with 3′ end cleavage half-lives. (A) The proportion of CSs (y-axis) with adenine (green) or uridine (orange) nucleotides at each position in the 100 nt (x-axis) surrounding CSs with the fastest (solid line) and slowest (dashed line) 25% half-lives. (B) The cumulative distribution of cleavage half-lives (x-axis) for sites grouped by the number of PAS kmers identified in the 200 nt around each CS (colored lines). (C) The cumulative distribution of cleavage half-life is divided by the number of PAS kmers identified in the 200 nt around each site.
Given the known importance of PAS strength in CS usage (Di Giammartino et al. 2011; Tian and Manley 2017), we next turned to specifically investigate how the sequence and position of the PAS influence the rate of 3′ end cleavage. To do so, we identified positions for the PASs predominantly used in Drosophila (Sanfilippo et al. 2017) by scanning for the 10 most commonly used 6-mers in the 200 nt upstream of sites for which we measured cleavage rates. Consistent with previous observations (Sanfilippo et al. 2017), we observe that for 60% of genes, the closest PAS 6-mer is within 10–30 nt upstream of the CS, and 66% of these 6-mers match the strongest AAUAAA, AUUAAA, or AAUAUA PAS motifs thought to be present at the majority of fly genes (Supplemental Fig. S5B; Sanfilippo et al. 2017). We do not see any significant associations between cleavage half-lives and either the position (Supplemental Fig. S5C) or the sequence of the closest PAS kmer (Supplemental Fig. S5D). Instead, we find that CSs with a greater number of PAS kmers in the 200 nt upstream of the CS have faster cleavage half-lives (Fig. 3B). This could indicate that PASs act cooperatively, where each additional element increases the probability of CPA machinery binding in an additive fashion. If this were the case, we would expect that normalizing by the number of kmers would remove the relationship between half-lives and PAS kmer density. To evaluate this possibility, we calculated the half-life per kmer and again see the same relationship, where CSs that have more kmers are being cleaved faster per individual sequence element (Fig. 3C). This observation suggests a nonlinear multiplicative relationship where multiple elements cooperate to increase the rate of cleavage more than the rate driven by any individual site.
3′ end cleavage rates are associated with local RNA polymerase II dynamics
The rate of cleavage has the potential to be associated with RNAPII localization, since PAS recognition likely occurs while the nascent RNA is emerging from the RNAPII exit channel (Rodríguez-Molina et al. 2023). Since 3′ end cleavage initiates the decoupling of the mRNA molecule from actively elongating RNAPII, we hypothesized that cleavage kinetics may be influenced by RNAPII dynamics downstream from the CS. Consistently, we see that the rate of 3′ end cleavage is significantly associated with the length of the readthrough region, or the region that RNAPII transcribes after the CS (Spearman ρ = 0.34, P-value < 2.2 × 10⁻¹⁶; Fig. 4A). We do not observe this association in simulated data, indicating that this observation is not due to biases in our modeling approach. The observation that CSs with faster half-lives were associated with shorter readthrough regions suggests that RNAPII dynamics may be limited in some fashion in the region after the CS, as was recently suggested to occur in yeast and human cells (Harlen et al. 2016; Geisberg et al. 2022). To investigate this, we used RNAPII ChIP-seq data from Drosophila S2 cells to look at RNAPII occupancy around CSs. For these analyses, we only used constitutive sites to avoid overlapping signals from alternative sites in the same genes. As has been observed previously, we observe decreased RNAPII occupancy just upstream of the CS and an immediate increase in occupancy downstream from the CS, regardless of cleavage rate (Fig. 4B). However, this increase in RNAPII occupancy is more pronounced in the first 250 nt downstream from the CS for sites with the shortest half-lives.
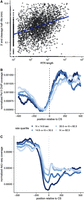
3′ end cleavage half-lives are associated with RNA polymerase dynamics at the 3′ end of the gene. (A) Cleavage half-lives (y-axis) versus the lengths of readthrough regions (in kb, x-axis), with a linear fit (blue). (B) Metagene plot of normalized RNA Pol lI ChIP-seq read coverage (y-axis) in a 1000 nt region centered on constitutively used CSs (x-axis), with sites separated by quartiles of cleavage half-lives (blue lines). (C) Metagene plot of normalized 4sU-seq read coverage for the 5m 4sU labeling time point (y-axis) in a 1000 nt region centered on constitutively used CSs (x-axis), with sites separated by quartiles of cleavage half-lives (blue lines).
Together, these observations indicate a relationship between cleavage rates and RNAPII dynamics in the 250 nt downstream from the CS. Specifically, this observation suggests that RNAPII pausing or a reduction in RNAPII speed may underlie faster cleavage. Concurrently, faster 3′ end cleavage may have consequences on RNAPII processivity, since the earlier appearance of an unprotected 5′ end on the readthrough transcript may result in faster XRN2-mediated degradation of the readthrough transcript. This could limit the distance that RNAPII is able to transcribe before XRN2 catches up and promotes transcription termination. Consistent with this hypothesis, we see fewer readthrough transcripts for CSs with faster half-lives, especially in early nascent data when readthrough transcripts are less likely to be mostly fully degraded (Fig. 4C; Supplemental Fig. S6).
DISCUSSION
Recent development of high-throughput sequencing techniques that capture nascent RNA over time has made genome-wide kinetic profiling of RNA maturation possible. Though rates of mRNA splicing have been estimated globally, the rate at which an mRNA is cleaved and polyadenylated to complete the maturation process has never been investigated. In this study, we introduced a novel method to measure the rates of site-specific 3′ pre-mRNA cleavage. We applied this approach to estimate 3′ end cleavage half-lives in D. melanogaster S2 cells and examine genomic features that may account for variability in cleavage rates.
We find that, on average, cleavage at sites that are alternatively cleaved occurs 23% slower than at constitutive CSs. Furthermore, constitutively used CSs in genes known to have alternative sites are also cleaved slower than sites in genes with only one possible CS. Together, these observations suggest that capacity for alternative site usage in a gene may lead to delays in 3′ end CPA, perhaps until all CSs have been transcribed. However, after adjusting informative read counts by the proportional CS usage, we were only able to estimate cleavage half-lives for the upstream-most sites in any gene. While we cannot discount the possibility that cleavage at downstream sites is often too fast to estimate (as suggested by the faster cleavage of downstream annotated sites) (Fig. 2C), our inability to estimate half-lives at these sites is also likely due to the inherent 5′ sequencing bias particularly present in early 4sU labeling time points. Thus, our read adjustment approach for counting informative reads may be especially underpowered at downstream sites and higher sequencing depth is necessary to estimate the rates of cleavage at these sites.
Sites with faster cleavage half-lives also tend to have enrichments of sequence features traditionally associated with more efficient 3′ end CPA—namely, an A-rich region upstream of the CS, a U-rich downstream element distal to the CS, and a higher density of kmers associated with PASs. These observations suggest that the speed of cleavage could be regulated by the recruitment of regulatory features. However, our analyses suggest that PAS motifs do not act independently but rather cooperate such that the presence of multiple motifs increases the rate of cleavage more than expected for the addition of a site. This is consistent with reports that genes can have clusters of efficiently cleaved, closely spaced 3′ isoform end points whose usage is associated with temporal regulation of RNA processing (Geisberg et al. 2022). One possibility is a model in which the local density of these motifs is the determining factor for increasing the concentration of CPA machinery near the CS and hastening the cleavage reaction.
The presence of G-rich sequences—putatively enriched with G-quadruplexes—downstream from CSs has been previously posited to be associated with enhanced CPA efficiency by aiding in the recruitment of necessary regulatory factors or promoting an open structural conformation of all the elements (Chen and Wilusz 1998; Zarudnaya et al. 2003; Beaudoin and Perreault 2013; Mitschka and Mayr 2022). Furthermore, G-rich or G-quadruplex containing regions have also been hypothesized to function as roadblocks or pause sites for RNAPII elongation, serving to slow down or pause RNAPII downstream from CSs and facilitate rapid cleavage (Gromak et al. 2006; Beaudoin and Perreault 2013; Geisberg et al. 2022). Giesberg et al. (2022) recently found that slower RNAPII speed at downstream from CSs promotes CPA, and the speed of RNAPII is mediated by GC content in this region. Consistent with this observation, we observe evidence for increased RNAPII dwelltime downstream from CSs with the fastest half-lives, but do not observe a relationship between GC content and cleavage rates. Our observations support the hypothesis that slower transcription elongation enables faster 3′ end cleavage, but find that the relationship between cleavage speed and RNAPII dynamics is not mediated by G-containing sequence elements. It is also possible that both the speed of cleavage and RNAPII are independently linked to increased poly(A) site usage in steady-state mRNA.
Alternatively, the increase in RNAPII density downstream from the fastest CSs might be due to RNAPII stalling during termination and chromatin disassociation (Rodríguez-Molina et al. 2023). The torpedo model posits that termination is initiated by XRN2, which performs exonucleolytic 5′–3′ degradation of the readthrough transcript, catching up to the polymerase and promoting dissociation from DNA (Eaton and West 2020; Rodríguez-Molina et al. 2023). Faster cleavage likely allows XRN2 to gain a kinetic advantage (Fong et al. 2015), allowing XRN2 to interact with RNAPII before it has a chance to advance far downstream from the CS. We observe fewer reads in the readthrough region downstream from the fastest cleaved sites, consistent with the idea that XRN2 degradation of the downstream molecule begins faster. Future studies to measure the rate of XRN2 exonucleolytic degradation itself would shed light on the relationship between the dynamics of 3′ end cleavage and polymerase and the sequence of events occurring during transcription termination.
We note, however, that our approach assumes a constant rate of RNAPII elongation across genes and the entire region within a gene. We are unable to estimate local RNAPII elongation rates with our progressive labeling 4sU-seq data and, to our knowledge, no such measurements exist in the literature for Drosophila S2 cells. This limits our ability to disambiguate the causal relationship between RNAPII localization and cleavage rates, particularly upstream of the CS where emerging evidence suggests that RNAPII speed decreases near the end of the gene (Pinto et al. 2011; Cortazar et al. 2019; Geisberg et al. 2022; Khitun et al. 2023). We cannot exclude the possibility that heterogeneity in elongation rates in this region affects our estimates of absolute cleavage rates. It would be interesting to refine our approach using cell-type specific gene- or region-specific elongation rates to better understand how the dynamics of RNAPII impact or are impacted by the rate of 3′ end cleavage. Future studies to estimate cleavage rates in cells with global variations in RNAPII speed would also shed greater mechanistic insight into this relationship.
More broadly, our approach to estimate the rate of 3′ end cleavage can help to provide insights into the spatiotemporal sequence of events necessary to create an mRNA molecule. When leveraged in tandem with other nascent RNA modeling approaches to measure transcription elongation and splicing rates, these tools together can be used to elucidate the rate-limiting steps for mRNA biogenesis across biological contexts. Studies have found increasing evidence of the coregulation of splicing and cleavage on the same molecule, with evidence that inefficient splicing is associated with inefficient 3′ end cleavage and increased readthrough transcripts in both yeast and human cells (Herzel et al. 2018; Reimer et al. 2021). These observations support potential kinetic coupling between splicing and cleavage events. Similarly, recent evidence that alternative last exons are likely regulated by cleavage rather than splicing mechanisms (Lee et al. 2022) suggests that the timing of cleavage might compete with or dictate the timing of splicing for these alternative decisions, as suggested by the window of opportunity models (Bentley 2014). Finally, applying our approach and modeling kinetic competition upon experimental perturbation of components of RNA processing machineries will provide an understanding of the direct regulatory interactions that underlie temporal precision in RNA processing.
Alternative CPA is known to be tightly regulated in many biological contexts, including neuronal development (An et al. 2008; Flavell et al. 2008; Ji et al. 2009; Fontes et al. 2017; Jereb et al. 2018; Tushev et al. 2018), circadian rhythms (Kiaulehn et al. 2007; Gendreau et al. 2018), the immune response (Beisang et al. 2014; Domingues et al. 2016; Pai et al. 2016), and many cancer subtypes (Yuan et al. 2021; Zhang et al. 2021). In each of these contexts, the timing of regulatory events matters to ensure proper cellular differentiation, circadian clock timing, survival from stimulation stress, or proliferative advantages, respectively. Thus, the kinetics of cleavage decisions may specifically be regulated across these and other contexts to ensure appropriate 3′-UTR selection. For instance, a kinetic balance between splicing and cleavage was shown to be perturbed by a cancer-associated mutation in the U2AF1 splicing factor, leading cleavage to no longer be rate-limiting for any molecules of the B-globin gene (Coulon et al. 2014) and broadly suggesting that this commonly occurring mutation may be selected to influence kinetic competition in human cancer cells. Applying our method to measure the rates of 3′ end cleavage in a diversity of cell types and biological systems would enable further understanding of how widespread kinetic coregulation or competition is and how the timing of regulatory events may dictate context-specific isoform usage.
MATERIALS AND METHODS
Processing 4sU-seq data
4-thio-uridine (4sU)-seq data from D. melanogaster S2 cells were obtained from Pai et al. (2017). This data set consists of three independent replicates each of 4sU-seq data after 5, 10, and 20 min of labeling with 500 µg of 4sU, as described in Pai et al. (2017) and two replicates of total RNA. These data include 51 nt paired-end reads and 100 nt reads for the total RNA-seq samples, all sequenced on an Illumina HiSeq platform. Fastq files were downloaded from GEO (GSE93763) and mapped to the dm6 reference genome (Flybase release 6.28) scaffolded with BGDP6.28.99 annotations using STAR (version 2.7.0e) (Dobin et al. 2013) with options: ‐‐outSAMtype BAM SortedByCoordinate ‐‐outSAMstrandField None ‐‐outSAMattributes All ‐‐alignIntronMin 25 ‐‐alignIntronMax 300000. Gene expression levels were calculated for the total RNA-seq data with Salmon (Patro et al. 2017) using the dm6 6.28 reference transcriptome. Gene-level TPMs were obtained by summing all the isoform-level TPMs for a given gene.
Identification and estimation of cleavage site usage
To identify CSs that are used in D. melanogaster S2 cells, we used published 3p-seq data from S2 cells (Agarwal et al. 2018) and retained CSs in the dm6 6.28 annotations that overlapped (within ±25 nt) with 3p-seq peaks after lifting over the curated table from dm3 coordinates.
Alternative usage of CSs was measured using a combination of the LABRAT and QAPA pipelines to measure proportional usage of CSs. We used LABRAT (version 0.2.2) (Goering et al. 2021) to filter annotated transcription end sites and calculate the expression of terminal fragments in total RNA-seq data. We then used the poly(A) usage (PAU) metric introduced by QAPA (Ha et al. 2018) to estimate a site-specific PAU value, which represents the proportion of CS usage relative to the usage of all other CSs in a gene.
Estimating 3′ end cleavage rates with mathematical modeling of informative read ratios
We based our model for estimating the rate of 3′ end cleavage on our previous model for estimating the rate of mRNA splicing (Pai et al. 2017). The progressive labeling design implemented in the 4sU-seq experiments enables the capture of RNAs at different stages of processing, and yields three populations of transcripts: (i) transcripts not yet transcribed past the CS; (ii) transcripts that are fully transcribed but still uncleaved; and (iii) transcripts that are fully transcribed and also cleaved. As described in Pai et al., using this progressive metabolic labeling data, we model the proportion of reads belonging to either cleaved or uncleaved transcripts as a function of the distance traveled by RNAPII and the probability of observing either cleavage state at a given polymerase end point (Pai et al. 2017). This is distinct from parameterizing the model by time points, since conceptualizing probability in terms of polymerase distances allows the modeling of a range of transcript lifetimes within the same labeling time point.
To identify reads that are directly informative about 3′ end cleavage state, we define two kinds of informative regions: (i) overlapping a CS, where reads can only come from uncleaved transcripts, and (ii) two insert lengths upstream of the CS, where reads can come from both uncleaved and cleaved transcripts and are informative about the total number of transcripts that can be cleaved at this site. We use this second region to estimate the expected number of reads coming from cleaved transcripts by subtracting the reads overlapping the CS and the number of reads estimated to be derived from transcripts that have transcribed past the total region but have not yet reached the CS (Fig. 1C; Supplemental Fig. S1). We use these empirical estimates of uncleaved and cleaved transcripts to mathematically model the expected 3′ end cleavage half-life across a range of transcript lifetimes. We use the same mathematical expression described to estimate splicing half-lives in Pai et al. (2017), with three important changes: (i) the empirical ratio is of uncleaved/cleaved transcripts, rather than unspliced/spliced transcripts, (ii) only transcripts that have transcribed past the CS are considered, and (iii) the range of polymerase end points is redefined to consider the region that is informative about cleavage, rather than splicing.
We consider the CS to be coordinate 0, and the range of polymerase end points informative for cleavage becomes [CS, RTR + Lr], where RTR is the length of the readthrough region, L is the labeling time, and r is the transcription rate, assumed to be constant across the genome (Fig. 1C). Transcripts associated with polymerases located upstream of CS cannot yet be cleaved, and transcripts associated with polymerases located beyond RTR + Lr cannot have incorporated the metabolic label. Using these new integration limits, the model can be solved for the half-life h to obtain an estimate of a 3′ end cleavage half-life. However, since there is no analytical solution for the resulting function, we solve a simplified expression numerically using the optim function in R, as described in Pai et al. (2017). Similar to the model to estimate splicing half-lives (Pai et al. 2017), this model to estimate 3′ end cleavage half-lives assumes (i) an equal probability of sampling reads from uncleaved and cleaved transcripts, (ii) independence between cleavage events, and (iii) that all transcripts will eventually be cleaved at the site where cleavage half-life is measured.
Specifically, we can consider the expected contribution to the uncleaved category by a polymerase at the transcript level
by letting the probability of any end point x be some value p, a constant across the region [CS, RTR + Lr]. Assuming the region is continuous, the contribution to the region can be treated as a Boolean variable: 1 if the transcript
is cleaved, and 0 otherwise. We can model the probability of cleavage as an exponential decay process with some half-life
h (where h is equivalent to t1/2), written as 2–(x/hr), since the probability of being uncleaved should be 1 when x = 0 and 1/2 when x is a distance hr past the end of the CS (where x = hr). Finally, we can integrate over the polymerase positions in a gene locus to get a proportional contribution of each to uncleaved
reads. Formally: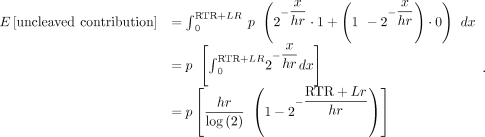
Similarly, we can consider the expected contribution to the cleaved category by a polymerase within this framework by flipping
the Boolean assignment in the region [CS, RTR + Lr]: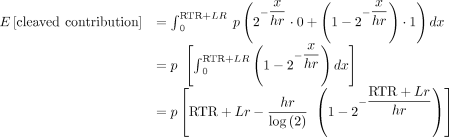
To obtain expressions for the expected number of reads reflective of uncleaved and cleaved molecules (obtained as described
above), we make two assumptions: (i) each transcript is cleaved independently and (ii) there is an equal and constant probability
of sampling a read from a cleaved transcript as from an uncleaved transcript. Taking the ratio of these expressions and assuming
a constant transcription rate yields a first-order approximation of the expected ratio of reads from uncleaved and cleaved
molecules as a function of the half-life: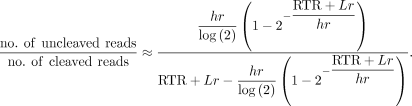
Solving a simplified version of this expression for h yields an estimate for the half-life of pre-mRNA cleavage. Since this equation has no analytical solution, we approximate the solution using the general-purpose optimization function optim in the R statistical environment, with the aim of minimizing error in the value of h. Data from different labeling periods were fit jointly to incorporate variation in read capture across labeling periods.
Estimate 3′ end cleavage half-lives for alternative cleavage sites
Although the assumptions described above are valid for constitutively used CSs, they are not all valid for sites that are alternatively used (PAU < 95%). Specifically, there is an intrinsic interdependence between the counts of reads across alternative sites from the same gene since transcripts that are cleaved at a given site must be uncleaved at the other site. This results in the probability of cleavage at a site being dependent on the cleavage status of other sites in the gene. This relationship results in an overcounting of uncleaved reads at sites with PAU < 95% (Supplemental Fig. S3B,C). Thus, to obtain cleavage rate estimates for alternative sites with 5% < PAU < 95%, we must proportionally allocate informative reads based on the site-specific usage observed in steady-state data (Supplemental Fig. S4). Broadly, we (i) use site-specific PAU values to weight the observed counts of reads at the total region and each region directly overlapping consecutive CSs, (ii) subtract reads that are assumed to originate from transcripts that are not able to be cleaved at a given site, and (iii) calculate the expected number of reads from cleaved transcripts by subtracting the adjusted uncleaved read count from the adjusted total read count. To enable these calculations, we count reads from the same region upstream of the first CS (as described above) to obtain the total number of transcripts for a gene. Furthermore, we make a few key assumptions, primarily that there is again a uniform distribution of polymerases throughout the entire 3′ end of the gene and that each pre-mRNA molecule is only cleaved once, after which there is relatively fast degradation of the readthrough fragment.
Specifically, for the initial CS1 we perform the following series of calculations:
-
The number of reads from transcripts that can be cleaved at CS1 is calculated by weighting the read count from the total region by PAU1 and then subtracting the expected proportion of reads arising from polymerases that are within the pre-CS1 region.
-
The uncleaved read count from CS1 is corrected by subtracting the expected proportion of reads arising from transcripts that will be cleaved at all downstream CSs.
For all downstream expressed CSs n, we perform the following calculations:
-
The number of reads from transcripts that can be cleaved at CSn is calculated by weighting the read count from the total region by PAUn and then subtracting (a) the expected proportion of reads arising from polymerases that are within the pre-CS1 region, and (b) the expected proportion of reads arising from polymerases that are within the extended UTR region defined as CSn − CS1.
-
The uncleaved read count from CSn is corrected by subtracting the uncleaved read count from all CSi < n, after subtracting for the number of those reads that are expected to arise from polymerases that are within the extended UTR region defined as CSn − CSi < n for all CSi < n.
Simulations to assess modeling approaches
We used simulated 4sU-seq data to assess the accuracy of our 3′ end cleavage rate models. To do so, we simulated data for a CS across a range of different biological and technical contexts: gene length g (1–50 kb), readthrough length RTR (1–100 kb), expression level in TPM (10–250 TPM), labeling periods L (5, 10, and 20 min), mean library preparation insert size (125–200 nt), mean standard deviation around the insert size (25 nt), and half-lives h (0.1–30 min). For simulations where we simulated two CSs in the same gene, we also simulated ranges of proportional CS usage (0%–100% PAU) and distances between CSs d (500–2000 nt). These parameters recapitulate standard distributions of gene structures, expression values, and experimental conditions. We note that the simulations allow RNAPII to transcribe the full RTR distance, but do not simulate XRN2 cleavage of readthrough transcripts and thus we remove reads from the RTR for kinetic modeling of simulated data.
To generate read data from transcripts, we simulated several steps in nascent RNA transcription, capture, and library preparation as previously described in Pai et al. (2017), and modified to simulate 3′ end cleavage rather than splicing processes. Most notably, for transcripts with RNAPII end points beyond the CS, the cleavage state was probabilistically determined based on the simulated half-life and end point. Transcripts with end points beyond g were terminated at g (or g + d for alternative CS simulations), but the longer end points affected the probability of cleavage since they represent transcripts that were completed before the end of the labeling period. Mean library preparation insert sizes and standard deviations were used during the in silico fragmentation and size-selection steps, and the first 50 nt of the fragments were used as simulated reads.
Estimating 3′ end cleavage half-lives in Drosophila melanogaster S2 cells
Filtering cleavage sites
To identify CSs for which we could confidently estimate cleavage rates, we used five criteria: (i) sites in genes with TPM > 5 in the total RNA libraries; (ii) sites whose use as a poly(A) site is supported by 3p-seq data (see above); (iii) sites that do not overlap introns (defined using RNA-seq junction reads), since splicing efficiency over the 4sU time course might confound measurement of reads supporting uncleaved transcripts; (iv) sites for which the associated total read region (Fig. 1C) does not overlap an intron, since splicing efficiency might similarly confound total transcript measurements; and (v) sites with at least one uncleaved or cleaved read in any time point. Finally, alternative CSs within 50 nt of each other were filtered out. Using these criteria, we retained 2857 constitutively used (PAU > 0.95) and 603 alternatively used (PAU > 0.05 and PAU < 0.95) sites.
Processing RNAPII ChIP-seq data and estimating the length of readthrough region
To define a readthrough region, defined as the region that RNAPII continues to travel after cleavage, we used publicly available RNAPII ChIP-seq data from D. melanogaster S2 cells. Specifically, fastq files from GSE112608 (Liang et al. 2018) were downloaded from GEO and mapped using STAR, as described above. To estimate the length of the readthrough region, we used DoGFinder (Wiesel et al. 2018), run with default parameters and conditioned on a minimum downstream of gene (DoG) length of 100 nt.
Extracting informative reads and modeling cleavage half-lives
For each of the CSs retained for further analyses, informative reads for CS and total region were counted using bedtools. For CS reads, we required at least a 10 nt overlap with both terminal exon (upstream of CS) and readthrough region (downstream) for CS reads. We defined the total region as the region located (2[insert length] + 2[library SD]) upstream of the CS and counted all reads that overlapped this region. Reads were combined across the three replicates from each labeling period to increase the power to model half-lives, and half-lives were estimated using a constant Drosophila transcription rate of 1500 nt/min (Ardehali and Lis 2009; Garcia et al. 2013).
Nucleotide composition and kmer analysis
To obtain nucleotide composition information, the genome sequence was extracted around each CS using bedtools getFasta -s. The proportion of each nucleotide (A, C, G, U) present across all sites or relevant sites categorized by half-life measurements was calculated for each nucleotide position in the specified windows. The same genome sequences were scanned for the 10 most prevalent polyadenylation signal (PAS) kmers specified in Sanfilippo et al. (2017), using a custom python script to identify the position and identity of PASs around each CS.
DATA DEPOSITION
Source code for simulations, data processing, analyses of cleavage rates, and to recreate figures from this manuscript is available at https://github.com/thepailab/cleavagerates.
SUPPLEMENTAL MATERIAL
Supplemental material is available for this article.
ACKNOWLEDGMENTS
We thank Chris Burge and Anish Shah for initial discussions on developing the method, Elisa Donnard and Manuel Garber for suggesting the use of RNAPII ChIP-seq data to estimate RTR lengths, and the Pai Lab for helpful discussions and feedback on the manuscript. This paper was supported by the National Institute of General Medical Sciences (R35GM133762) to A.A.P. and Diversity Supplement (R35GM133762-S2) to L.T.-U.
Author contributions: L.T.-U.: data curation, formal analysis, investigation, methodology, visualization, writing—original draft. E.C.-R.: formal analysis, visualization, writing—review and editing. A.A.P.: conceptualization, formal analysis, investigation, methodology, visualization, writing—original draft.
Footnotes
-
Article is online at http://www.rnajournal.org/cgi/doi/10.1261/rna.079783.123.
-
Freely available online through the RNA Open Access option.
- Received July 22, 2023.
- Accepted December 13, 2023.
This article, published in RNA, is available under a Creative Commons License (Attribution-NonCommercial 4.0 International), as described at http://creativecommons.org/licenses/by-nc/4.0/.
REFERENCES
MEET THE FIRST AUTHOR

Meet the First Author(s) is an editorial feature within RNA, in which the first author(s) of research-based papers in each issue have the opportunity to introduce themselves and their work to readers of RNA and the RNA research community. Leslie Torres-Ulloa is the first author of this paper, “Genome-wide kinetic profiling of pre-mRNA 3′ end cleavage.” Leslie is a PhD candidate in Dr. Athma Pai's laboratory at the RNA Therapeutics Institute of UMass Chan Medical School. Their research focuses on the dynamics of cotranscriptional RNA processing. They develop genome-wide computational tools to study the speed and efficiency of RNA processing, and how these properties impact cellular function.
What are the major results described in your paper and how do they impact this branch of the field?
We introduce a method that enables the estimation of site-specific pre-mRNA 3′ end cleavage rates in any model organism, though our initial work has centered on the characterization of 3′ end cleavage kinetics in Drosophila S2 cells. 3′ end cleavage events impact a variety of outcomes for mRNA molecules: For instance, polyadenylation site selection in the upstream regions results in isoforms with different last exons and altered content within the coding region, as well as impacting the content of the 3′ untranslated region. This leads to protein diversification and down-regulation of gene expression by impacting mRNA stability and nuclear export. There is increasing evidence that polyadenylation site choices are determined by kinetic parameters, such that sequence features or gene architecture might promote faster transcript cleavage. We still have very little understanding of the kinetic regulation of polyadenylation site choice that determines the composition of the 3′ ends of mRNAs. In this manuscript, we report the first-ever large-scale estimates of pre-mRNA 3′ end cleavage rates. We find that cleavage rates are fast but highly variable across sites, with alternative events being the slowest. When it comes to sequence features that impact this variability in rates, we find that an A-rich region upstream of the cleavage site, a U-rich element downstream from the cleavage site, and a higher density of polyadenylation signals, lead to faster cleavage reactions. Our assessment of transcriptional dynamics around cleavage sites suggests that slower transcription elongation speeds might enable faster 3′ end cleavage; yet we cannot disambiguate this from the possibility that faster cleavage may allow XRN2 to interact with an elongating polymerase before it has a chance to progress further downstream, giving the appearance of slower transcription around cleavage sites. These results constitute an initial profiling of 3′ end cleavage kinetics in Drosophila S2 cells only, and it is my hope that this tool, in combination with methods to profile kinetics of splicing and transcription, might shed light into the coordination of RNA processing events, and more broadly, the temporal regulation of gene expression in health and disease states.
What led you to study RNA or this aspect of RNA science?
My first interest was in the concept of biological timekeeping, as I had my start in science in sleep medicine and circadian rhythms. Transcribing and processing an mRNA molecule to ensure proper cellular function and coordinate responses to stimuli takes time, and exactly how long it takes for signal integration to lead to a response is, to me, a very intriguing aspect of gene expression regulation.
Are there specific individuals or groups who have influenced your philosophy or approach to science?
My overarching scientific philosophy has been heavily influenced by the works of Alfred North Whitehead—specifically by his process philosophy—and William Whewell's ideas on scientific consilience and the unity of knowledge. In a directly practical sense, I am an admirer of Dr. Shihoko Kojima's group's approach to the study of mRNA expression rhythms, as well as the Bentley, Neugebauer, and Lis groups’ work on cotranscriptional RNA processing dynamics.
What are your subsequent near- or long-term career plans?
As I conclude my doctoral work, my near-term goal is to pursue postdoctoral training in functional genomics. My current interests lie in neurodegenerative and neuropsychiatric disorders, and applying, as well as developing, genome-wide approaches to their study.




