


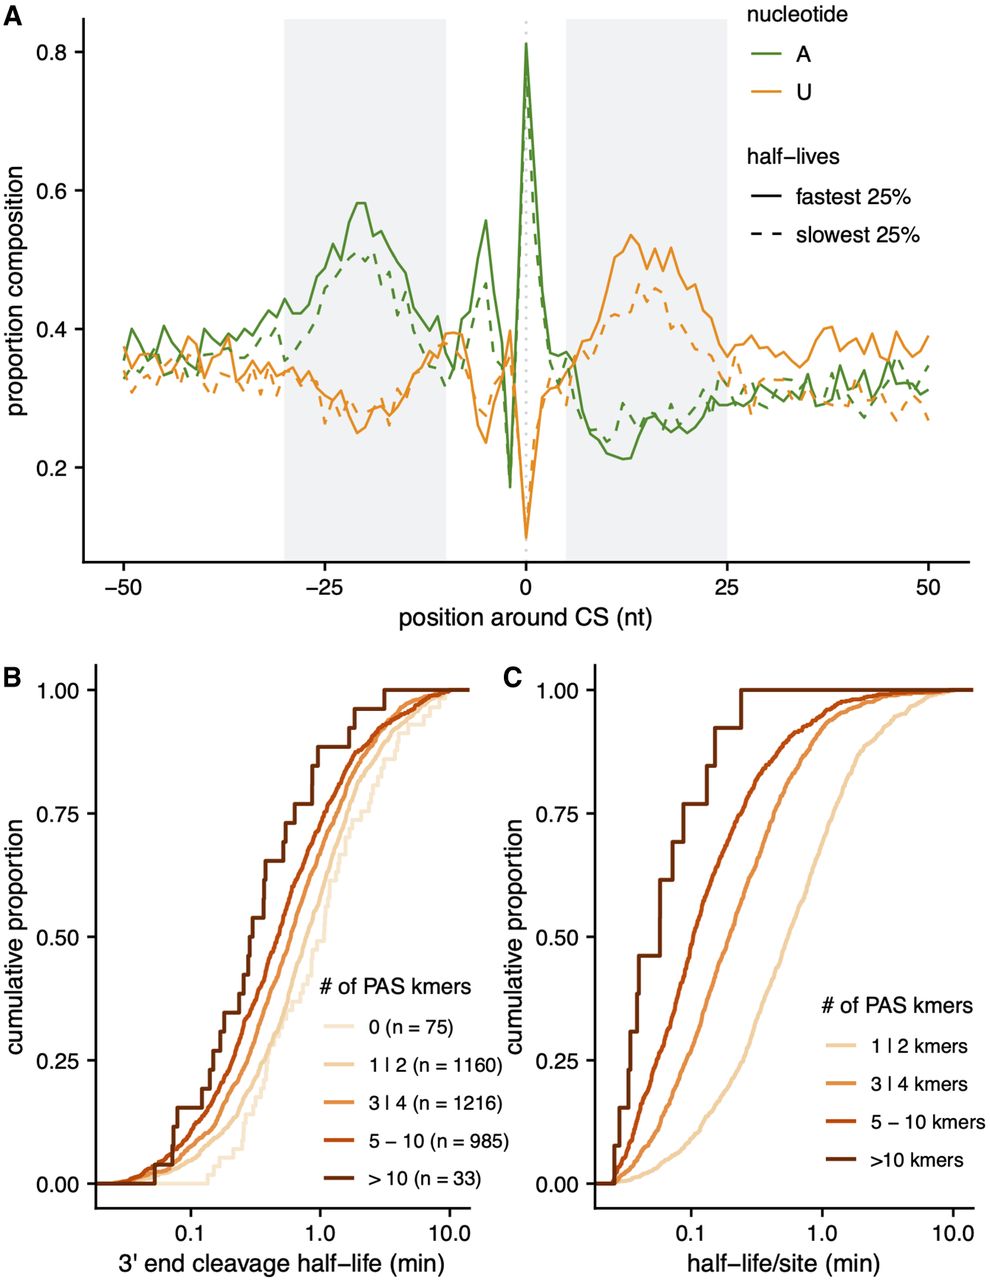
FIGURE 3.
RNA sequence elements are associated with 3′ end cleavage half-lives. (A) The proportion of CSs (y-axis) with adenine (green) or uridine (orange) nucleotides at each position in the 100 nt (x-axis) surrounding CSs with the fastest (solid line) and slowest (dashed line) 25% half-lives. (B) The cumulative distribution of cleavage half-lives (x-axis) for sites grouped by the number of PAS kmers identified in the 200 nt around each CS (colored lines). (C) The cumulative distribution of cleavage half-life is divided by the number of PAS kmers identified in the 200 nt around each site.




