


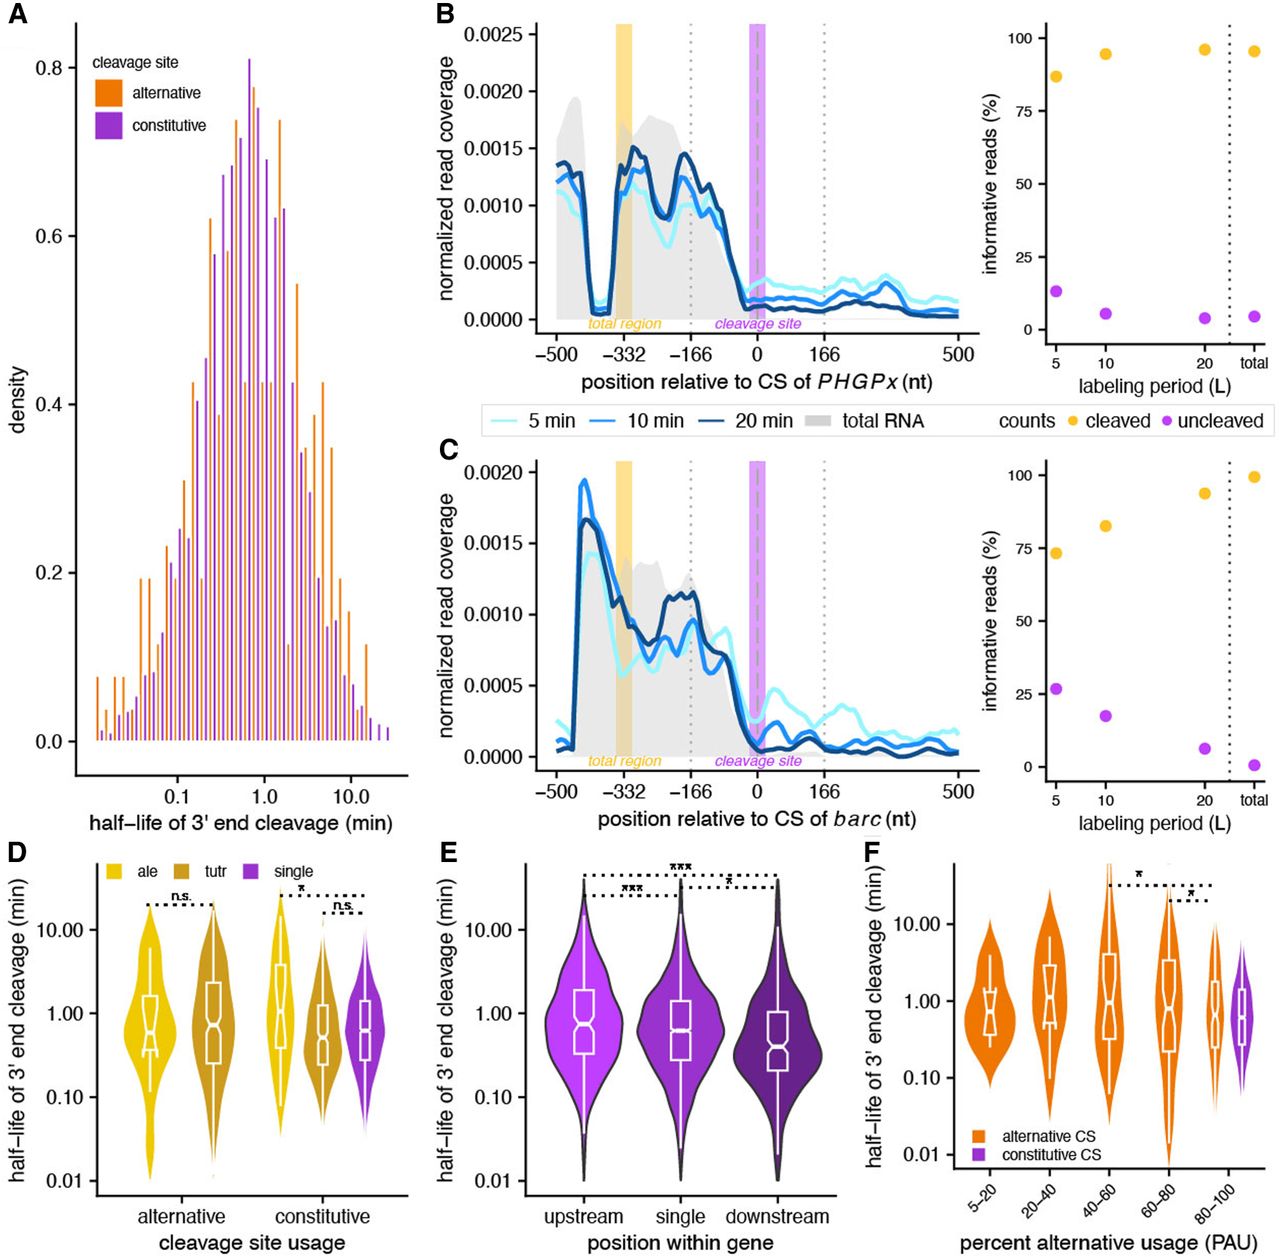
Estimating cleavage rates at constitutive and alternative sites. (A) Distribution of 3′ end cleavage half-lives for constitutively (PAU > 95%; purple) and alternatively cleaved sites (5% < PAU < 95%; orange). (B and C) Nascent RNA coverage at the 3′ ends of PHGPx (B) and barc (C), separated by 4sU labeling time points (blue lines) and steady-state total RNA data (gray area). The regions from which the total mRNA and uncleaved molecule read counts are obtained are shaded in yellow and purple, respectively. The right panels show the estimated proportions of cleaved (yellow) and uncleaved (purple) read counts. (D) Distribution of estimated 3′ end cleavage half-lives separated by annotated site usage. ALE refers to alternative last exons (alternative n = 12; constitutive n = 24), tUTR refers to tandem 3′ UTRs where more than one CS is in the same exon (alternative n = 251; constitutive n = 359), and single sites are in genes with only one annotated CS (constitutive n = 2398). (*) P < 0.05. (E) Distribution of estimated 3′ end cleavage half-lives for constitutively used CSs (PAU > 95%) separated by annotated position in a gene. Upstream refers to the first site (n = 171), single sites are in genes with only one annotated CS (n = 2398), and downstream refers to non-first sites (n = 210). (*) P < 0.05, (***) P < 0.0005. (F) Distribution of estimated 3′ end cleavage half-lives for quintiles of PAU values (n = 8, 8, 31, 61, and 155 for alternative sites across quintiles from 5%–20% to 80%–100%), separated by alternatively used (orange) and constitutively used CSs (purple). (*) P < 0.05.




