


Boosting the toolbox for live imaging of translation
- Maëlle Bellec1,2,
- Ruoyu Chen3,4,
- Jana Dhayni5,
- Antonello Trullo1,
- Damien Avinens6,
- Hussein Karaki5,
- Flavia Mazzarda5,
- Helene Lenden-Hasse1,
- Cyril Favard6,
- Ruth Lehmann4,
- Edouard Bertrand5,
- Mounia Lagha1 and
- Jeremy Dufourt1,6
- 1Institut de Génétique Moléculaire de Montpellier, University of Montpellier, CNRS, 34293 Montpellier, France
- 2Department of Developmental Genetics, Max Planck Institute for Heart and Lung Research, 61231 Bad Nauheim, Germany
- 3Vilcek Institute of Graduate Studies, NYU School of Medicine, New York 10016, USA
- 4Whitehead Institute for Biomedical Research and Department of Biology, Massachusetts Institute of Technology, Cambridge, Massachusetts 02142, USA
- 5Institut de Génétique Humaine, University of Montpellier, CNRS, 34396 Montpellier, France
- 6Institut de Recherche en Infectiologie de Montpellier, CNRS UMR 9004, University of Montpellier, Montpellier, 34293 Cedex 5, France
- Corresponding authors: jeremy.dufourt{at}irim.cnrs.fr, edouard.bertrand{at}igh.cnrs.fr
-
Handling editor: Maria Carmo-Fonseca
Abstract
Live imaging of translation based on tag recognition by a single-chain antibody is a powerful technique to assess translation regulation in living cells. However, this approach is challenging and requires optimization in terms of expression level and detection sensitivity of the system, especially in a multicellular organism. Here, we improved existing fluorescent tools and developed new ones to image and quantify nascent translation in the living Drosophila embryo and in mammalian cells. We tested and characterized five different green fluorescent protein variants fused to the single-chain fragment variable (scFv) and uncovered photobleaching, aggregation, and intensity disparities. Using different strengths of germline and somatic drivers, we determined that the availability of the scFv is critical in order to detect translation throughout development. We introduced a new translation imaging method based on a nanobody/tag system named ALFA-array, allowing the sensitive and simultaneous detection of the translation of several distinct mRNA species. Finally, we developed a largely improved RNA imaging system based on an MCP-tdStaygold fusion.
Keywords
INTRODUCTION
During development, multipotent cells progressively acquire specific fates leading to the formation of a variety of tissues. This process relies on spatiotemporally regulated gene expression programs, contributing to the reliability and reproducibility of gene expression patterns that generate the final body plan. In this process, the regulation of mRNA translation is a key step because the dynamics of translation in space and time critically affect the outcome of gene expression. Most approaches to study the regulation of translation in whole organisms rely on a bulk population of cells with poor spatial and temporal information. Consequently, the precision and heterogeneity in the regulation of translation at the cellular and molecular levels remain incompletely understood. Live imaging methods of translation have been developed in cultured cells (Morisaki et al. 2016; Pichon et al. 2016; Wang et al. 2016; Wu et al. 2016; Yan et al. 2016) since 2016 and were recently introduced in Drosophila (Dufourt et al. 2021; Formicola et al. 2021; Vinter et al. 2021). These methods are based on the fluorescent labeling of nascent peptide chains. The labeling system is made of two components, a genetically encoded antibody such as a single-chain variable fragment antibody (scFv) or Fab fragment (Wörn et al. 2000; Lecerf et al. 2001; Colby et al. 2004) fused to a fluorescent protein (FP; referred to as the detector), and an N-terminal peptide epitope inserted in multiple copies in frame with the gene of interest (Tanenbaum et al. 2014). These live imaging approaches made it possible to visualize translation up to the single-molecule scale in cultured cells and also in an entire organism (Dufourt et al. 2021; Vinter et al. 2021). Such technological breakthroughs provided important insights in our understanding of gene regulation through translation and, for instance, revealed the existence of motor-driven polysome transport and spatial heterogeneity of translation at the subcellular level (Pichon et al. 2016; Yan et al. 2016; Boersma et al. 2019, 2020; Chouaib et al. 2020; Dufourt et al. 2021; Safieddine et al. 2021; Bruurs et al. 2023).
The discovery of the Aequorea victoria green-FP (Prasher et al. 1992; Chalfie et al. 1994), and especially its optimized version mEGFP (Zacharias et al. 2002), have revolutionized the imaging of biological processes (Rodriguez et al. 2017). Since then, several new FPs have been and continue to be discovered and engineered (Bindels et al. 2017; Lambert et al. 2020). The constant race for better FPs generally implies the optimization for fast folding and pH resistance, as well as improvement of photo-physic properties (Leake and Quinn 2023).
Introduction of the bacteriophage-derived MS2 RNA-binding sites, which are recognized by MS2 coat protein (MCP) fused to FP, provided a technique to visualize transcription in living cells. This technological advance has been subjected to several improvements from its initial development in 1998 (Bertrand et al. 1998). These improvements include increased sensitivity down to single molecules (Fusco et al. 2003), implementation in a living organism (Forrest and Gavis 2003), the generation of new stem–loops to visualize single mRNAs at a high temporal resolution (Tantale et al. 2016; Dufourt et al. 2021), artifact-free RNA tags (Tutucci et al. 2018), and double mRNA species imaging with an orthologous system (Hocine et al. 2013). However, several limitations exist with the present tools that hinder quantitative imaging. For example, protein aggregation has been observed for some systems derived from MCP fused to GFP (Weil et al. 2010; Tutucci et al. 2018; Pichon et al. 2020) and for scFv fused to specific GFP variants (Tanenbaum et al. 2014). Furthermore, the expression level of the detector is critical to ensure accurate detection, particularly for translation, as most of the time one mRNA undergoes multiple rounds of translation. However, no such optimization has been made for the SunTag system in the context of a developing organism, although photo-physical properties of molecules can be variable between different systems (i.e., in vitro experiments, cell culture, tissues, organisms, etc.) (Wörn et al. 2000; Donahue et al. 2021; Leake and Quinn 2023).
Here, we tested different GFP variants for their brightness, photobleaching, and propensity to aggregation in fixed and live Drosophila embryos. We also generated inducible scFv-FP constructs that, when combined with different drivers, extend the use of the SunTag system to a wider range of genes and biological questions. Furthermore, we developed an orthologous method, called ALFA-array, to visualize nascent translation in Drosophila embryo and mammalian cells. This system is based on a small and soluble nanobody, and we show its usefulness by combining it with the SunTag to visualize translation of two different mRNA species in Drosophila embryos.
RESULTS
New fluorescent protein fused to scFv to detect nascent translation
The SunTag method is a bipartite system based on an antibody-derived scFv detector, fused to the GB1 solubility tag and to an FP (the detector). The scFv binds a peptide named Supernova Tag (suntag), derived from the yeast GCN4 protein and genetically fused in multiple copies at the N terminus of the gene of interest (Fig. 1A; Tanenbaum et al. 2014). To improve the system, we created new scFvs with different green FPs under the control of nanos (nos) enhancer-promoter (EPr). This EPr combination drives expression in the Drosophila germline (Doren et al. 1998; Chen and McKearin 2003; Ali et al. 2010; Garcia et al. 2013), allowing the maternal deposition of mature scFv-FP into laid eggs (Supplemental Fig. S1A). We generated a set of four different constructs, in addition to the previously published scFv fused to the superfolder GFP (sfGFP) (Pédelacq et al. 2006) in Drosophila, named scFv-sfGFP (Dufourt et al. 2021). The new generation of green FP variants includes: (i) the monomeric superfolder GFP2 (msGFP2) (Valbuena et al. 2020), (ii) the mGreenLantern (GL) (Campbell et al. 2020), (iii) mNeonGreen (NG) (Shaner et al. 2013), and (iv) the monomeric A. victoria fluorescent protein 1 (mAvic1) (Fig. 1B, upper panel; Lambert et al. 2020) . Live imaging of these five scFv-FPs during embryonic development until the end of nuclear cycle 14 (n.c. 14) showed that all the scFv-FPs are well expressed, localize mainly in the nucleus due to the presence of a nuclear localization signal, and do not form aggregates (Supplemental Fig. S1B; Supplemental Movies S1–S5). Quantification of the fluorescent intensity during the first 40 min of n.c. 14 showed that the apparent brightness of these four new scFv was similar to the scFv-sfGFP, while scFv-mAvic1 produced brighter signals (Supplemental Fig. S1C) and scFv-GL was prone to photobleaching (Supplemental Fig. S1C). We confirmed that the distribution of scFv-FP was homogeneous in the embryo, and dots/aggregates were not detected by light-sheet imaging of the two brightest scFv-FPs, scFv-mAvic1 and scFv-msGFP2 (Supplemental Fig. S1D; Supplemental Movies S6 and S7).
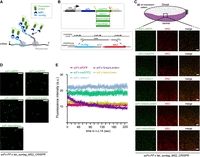
Generation of different scFv-fluorescent proteins (scFv-FPs) to monitor nascent translation in Drosophila. (A) Schematic of the SunTag system. Once the mRNA (black) is translated by the ribosomes (gray), the suntag epitopes (light blue) will be bound by the single-chain variable fragment (scFv) (dark blue) fused to an FP (green). Therefore, the nascent peptide will be detected by the accumulation of fluorescent signals. (B, top) Schematic of the different constructs of scFv-FP generated in this study. scFv-msGFP2, scFv-GreenLantern, scFv-mAvic1, and scFv-NeonGreen were created for this study, and scFv-sfGFP in our previous study (Dufourt et al. 2021). (Bottom) Schematic of the CRISPR/Cas9 targeted insertion strategy to obtain endogenous twist gene tagged with suntag and 128xMS2 (Dufourt et al. 2021). (C, top) Schematic of a sagittal view of a Drosophila embryo with twi expression pattern in purple. Anterior side is on the left, posterior on the right, dorsal on the top, and ventral side on the bottom. Black square represents the imaged area of the bottom panels. (Bottom) One Z-plane of confocal images from smFISH with direct FP signal in green (scFv-msGFP2, scFv-GreenLantern, scFv-mAvic1, scFv-NeonGreen, and scFv-sfGFP) and MS2 probes (red) on scFv-FP x twi_suntag_MS2_CRISPR embryos in early-mid n.c. 14. Scale bar, 5 µm. (D) Snapshots from representative fast-mode acquired confocal movies of twi_suntag_MS2_CRISPR/+ embryos carrying either scFv-msGFP2, scFv-GreenLantern, scFv-mAvic1, and scFv-NeonGreen or scFv-sfGFP proteins. Green dots represent nascent translation of twi. Scale bar, 5 µm (see related Supplemental Movies S8–S12). (E) Quantification across time during n.c. 14 of different scFv-FP signals from movies represented in D, n = 5 movies from at least three embryos for each scFv-FP. Error bars represent SEM.
We next tested the capacity of these new scFv-FPs to detect mRNA in translation in Drosophila embryos. We crossed the different scFv-FP lines into the background of a twist gene endogenously tagged with MS2 and suntag (twi_suntag_MS2_CRISPR) (Fig. 1B, lower panel), and performed single-molecule fluorescent in situ hybridization (smFISH) on fixed embryos to detect the tagged mRNAs. Actively translated mRNAs (polysomes) were then visualized as colocalized GFP and mRNA spots. Imaging the border of the twist mRNA transcription pattern showed that the translation signal was present only in the described pattern of twist expression (mesoderm) (Fig. 1C; Pan et al. 1991), supporting that the signal is specific. For all scFv-FPs, we observed a clear colocalization between mRNA (red signal) and polysomes (green signal), in addition to mRNA molecules that were not detectably translated (Supplemental Fig. S1E). Notably, a fainter signal was detected in fixed samples for polysomes labeled with scFv-mAvic1 at this stage of embryogenesis, as compared to its high apparent brightness in live samples (Supplemental Fig. S1F), suggesting that mAvic1 is more sensitive to the fixation/smFISH protocol. Immuno-smFISH with an antibody against GFP did not improve the signal but increased the background. Surprisingly, we found that staining with only a secondary antibody could label nascent foci of translation (Supplemental Fig. S2A), and only when the scFv-FP was present (Supplemental Fig. S2B). This result suggested that secondary antibodies alone could bind scFv-FP. Experiments using immunofluorescence and scFv-FP simultaneously should thus be avoided. We then looked at the behavior of these scFv-FPs in live embryos in the presence of twi_suntag_MS2_CRISPR. We could observe bright green fluorescent dots in movement within the mesoderm (Fig. 1D; Supplemental Movies S8–S12). To characterize the detection capacity of each FP in live embryos, we measured the mean intensity of all detected spots for 4 min during n.c. 14 with a high temporal resolution (Fig. 1E; Supplemental Movies S8–S12). The translation foci detected by scFv-mAvic1, scFv-sfGFP, and scFv-msGFP2 showed a stable signal compared to scFv-NG and scFv-GL (Fig. 1E). Collectively, these results show that the four new scFv-FPs are able to bind nascent suntag peptides and can therefore detect mRNA being translated in live and fixed samples.
New scFv-FP prevents aggregate formation
To show whether scFv-FPs expressed under the maternal nos EPr could detect translation during late embryogenesis, we imaged fixed embryos at the gastrulation stage. We observed that the tagged Twist protein localized to nuclei in the ventral gastrulation furrow region, consistent with Twist being a mesodermal transcription factor (Supplemental Fig. S2C, upper panel). To test whether the presence of an NLS in the scFv-FP construct might be responsible for this nuclear localization, we imaged the localization of the insulin-like peptide 4 (Ilp4), an excreted protein expressed in the mesoderm (Brogiolo et al. 2001). We used the tagged Ilp4 with suntag and observed scFv containing the NLS in the cytoplasm (Supplemental Fig. S2C, lower panel). Thus, at least in these cases, the presence of an NLS in the scFv-FP construct appears not to significantly interfere with the native localization of tagged proteins.
Strikingly, at the gastrulation stage, bright GFP spots were observed only when using scFv-sfGFP in twi_suntag_MS2_CRISPR embryos but not with the other scFv-FPs (Supplemental Fig. S3A). As only the FP sequences are different between these constructs, this discrepancy might be due to a difference in protein stability, i.e., scFv-sfGFP being more stable than the other variants, or being more prone to aggregation. To distinguish between these possibilities, we used smFISH to label twi_suntag_MS2_CRISPR mRNA in the presence of the different scFv-FPs to determine whether the bright GFP spots observed during gastrulation colocalized with mRNA and represent true translation spots. With scFv-sfGFP, we saw large green spots that were not colocalized with mRNA (Supplemental Fig. S3b, upper left panels, white arrowhead). We did not observe these large spots with any of the four new scFv-FPs (Supplemental Fig. S3B), suggesting an aggregation of the scFv-sfGFP in the Drosophila embryo at the gastrulation stage in the presence of twi_suntag_MS2_CRISPR.
We next asked whether aggregation was specific for the tagged twi in developing embryos or could also occur in cultured cells. We expressed scFv-sfGFP and scFv-msGFP2 in Drosophila S2R + cells along with a SunTag-luciferase reporter (SunTagRLuc-MS2; see Materials and Methods and Supplemental Fig. S3C). The SunTagRLuc-MS2 plasmid was cotransfected with an scFv-FP plasmid as well as an MCP-Halotag plasmid to track single mRNA molecules and their translation during live-cell imaging. As expected, scFv-FPs were able to label polysomes by forming GFP foci that colocalized with mRNAs (Supplemental Fig. S3D). With the scFv-sfGFP, however, we frequently observed GFP aggregates which were not associated with any mRNA molecules. These aggregates were morphologically distinct from translating foci and were more abundant and bigger than the GFP aggregates observed in gastrulating embryos (Supplemental Fig. S3D,E). This result suggests an aggregation of the SunTag peptides bound by the scFv-sfGFP after being translated and released from polysomes. Although few aggregates were also present in cells expressing scFv-msGFP2 with the SunTagRLuc-MS2 reporter (Supplemental Fig. S3D), this occurred with a significantly lower frequency (∼55% of cells without aggregates compared to ∼15% using scFv-sfGFP) and smaller aggregate size, suggesting that msGFP2 is less prone to aggregate formation.
These results support that the scFv-FPs containing newer generation monomeric FPs are more suitable for translation analysis, as they are less likely to form aggregates compared to sfGFP, which is able to form weak dimers (Valbuena et al. 2020; Ivorra-Molla et al. 2023).
Monitoring translational arrest during Drosophila embryogenesis
The low amount of translation spots observed during gastrulation with scFv-sfGFP suggested that twi translation may have ceased at this stage of development (Supplemental Fig. S3A,B). However, a translational arrest of twist mRNAs has not been described previously. This unexpected observation led us to verify whether twi transcripts were undergoing a translational arrest during n.c. 14 (Fig. 2A), and for this we used the four new scFv-FPs. Interestingly, we found that at mid-late n.c. 14 (Fig. 2A), the twi_suntag_MS2_CRISPR RNA was mostly translated at the border of the mesoderm (Fig. 2B; Supplemental Fig. S4A–C). Using scFv-msGFP2 fluorescence intensity quantification, the percentage of mRNA in translation was slightly lower in the center as compared to the border of the mesoderm (44 ± 4% at the center and 61 ± 1% at the border; see Materials and Methods). Strikingly, the polysome intensities were much lower in the center compared to the mesoderm border, suggesting reduced translation (Fig. 2B; Supplemental Fig. S14A–C). A translational arrest was recently described for Hunchback (Hb) using the SunTag system in the Drosophila embryo (Vinter et al. 2021). In this study, the authors showed that after being translated in the entire Hb domain (anterior half of the embryo), hb translation became restricted to the border of its expression pattern, similarly to what we observed for twist. At least two models can explain this result: (i) twi translation is actively repressed at first in regions where the RNA and protein expression is highest (as suggested for hb [Vinter et al. 2021]), or (ii) the amount of scFv-FP becomes limiting during mid-late n.c. 14, at first in regions where the RNA and protein expression is highest and prevents the detection of translation (Fig. 2C, upper panel). To test these hypotheses, we used the twi_suntag_transgene, which exhibits a stochastic expression pattern, belated transcriptional activation (Dufourt et al. 2021) and thus lower mRNA level as compared to twi_suntag_MS2_CRISPR. If twi translation is actively repressed, a similar translational arrest should be observed for the twi_suntag_transgene. In contrast, if the amount of scFv-FP is limiting, translation of the transgene should be detectable over a longer period of time (Fig. 2C). Using live imaging, we observed translation spots of the twi-suntag_transgene at a stage when twi_suntag_MS2_CRISPR translation spots vanished (Fig. 2D; Supplemental Fig. S4D; Supplemental Movies S13–S15). The translation dots of the twi_suntag_transgene colocalized with mRNA dots in late n.c. 14 and gastrulation stage, as confirmed with smFISH (Supplemental Fig. S4E). These results suggest that the amount of scFv-FP might be limiting when twi translation is monitored from its endogenous locus (twi_suntag_MS2_CRISPR allele), preventing detection of translation at gastrulation.
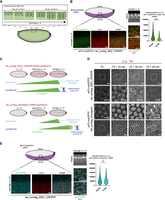
scFv-FP concentration under nos EPr creates an artifactual translation arrest of endogenous twi mRNA during early embryogenesis. (A) Schematic of nuclear elongation and cellularization during n.c. 14. In this study, we defined one early-mid stage (corresponding to 0–35 min of the n.c. 14 from the mitosis) and one mid-late stage (corresponding to 35–55 min of the n.c. 14 from the mitosis). (B, top) Schematic of a sagittal view of a Drosophila embryo with twi expression pattern in purple. Anterior side is on the left, posterior on the right, dorsal on the top, and ventral side on the bottom. Black square represents the imaged area of the bottom panels. (Bottom) A single Z-plane of confocal images from smFISH with direct FP signal in green (scFv-msGFP2) and MS2 probes (red) on scFv-msGFP2 x twi_suntag_MS2_CRISPR embryos at mid-late n.c. 14. Gray squares represent the zoomed images in the right panels. The two different zoomed images represent border (top) and internal (bottom) zone of the imaged pattern. Scale bars, 10 µm on the larger images, and 5 µm on the zoomed images. Staging is given by DAPI staining on a sagittal view of the imaged embryo (black and white image at the bottom). Quantification of the scFv-msGFP2 signal intensity on single-molecule mRNA at the border at mid-late n.c. 14 stages (dark green, nine images from three embryos, n = 2570), and center (light green, nine images from three embryos, n = 2737) of the mesoderm is represented on the right. (C) Schematic representing twi_suntag_MS2_CRISPR mRNA expression from n.c. 13 to late n.c. 14 in red. From the observations on twi CRISPR translation (B), two hypotheses can be considered. Hypothesis 1 is that the decrease of translation observed at mid-late n.c. 14 is due to an active repression of translation. Hypothesis 2 is that the amount of scFv-FP becomes limiting at mid-late n.c. 14, leading to an arrest of the detected green signal. These two hypotheses are represented in the context of twi_suntag_MS2_CRISPR expression (above) and twi_suntag_transgene expression (below). twi_suntag_transgene mRNA is expressed more stochastically and later than twi_suntag_MS2_CRISPR mRNA. In hypothesis 1, a decrease of translation should be simultaneously observed for the two constructs (mid-late n.c. 14). In hypothesis 2, no arrest of translation should be observed with twi_suntag_transgene as the amount of mRNA is lower. (D) Snapshots taken each 15 min from movies of scFv-msGFP2 x twi_suntag_MS2_CRISPR or scFv-msGFP2 x twi_suntag_transgene embryos on the ventral side. T0 corresponds to early n.c. 14. White squares represent the zoomed images in the center of the panel. Note a persistence of translation for the twi_suntag_transgene at T0 + 45 min (white arrowhead), absent in twi_suntag_MS2_CRISPR embryos. Scale bars, 10 µm on the larger images, and 5 µm on the zoomed images (see related Supplemental Movies S13 and S14). (E, top) Schematic of a sagittal view of a Drosophila embryo with twi expression pattern in purple. Anterior side is on the left, posterior on the right, dorsal on the top, and ventral side on the bottom. Black square represents the imaged area of the bottom panels. (Bottom) Single Z-planes of confocal images from immuno-smFISH with anti-GCN4 antibody (cyan) and MS2 probes (red) on twi_suntag_MS2 embryos at mid-late n.c. 14. Gray squares represent the zoomed images in the right panels. The two different zoomed images represent border (top square) and internal (bottom square) zones of the imaged pattern. Scale bars, 10 µm on the larger images, and 5 µm on the zoomed images. Staging is given by DAPI staining on a sagittal view of the imaged embryo (black and white image at the bottom). Quantification of the anti-GCN4 signal intensity on single-molecule mRNA at the border (dark blue, six images from two embryos, n = 3211) and center (light blue, six images from two embryos, n = 4001) at mid-late n.c. 14 stages of the mesoderm is represented on the right.
To confirm this hypothesis, we used an antibody against the suntag peptides (anti-GCN4) in the absence of scFv-FP and saw translation of twi_suntag_MS2_CRISPR mRNAs even at mid-late n.c. 14 and gastrulation stage (Fig. 2E; Supplemental Fig. S5A). Moreover, the percentage of mRNA in translation was homogeneous within the mesoderm (72 ± 4% at the border and 68 ± 2% at the center), and polysome intensity between center and border was similar (Fig. 2E), in contrast to the results obtained with scFv-msGFP2 (Fig. 2B). Altogether these results demonstrate that there is no translational arrest of twi mRNAs during n.c. 14. Instead, the amount of scFv-FP expressed under the maternally active nos EPr becomes insufficient to detect translation during gastrulation, when a large pool of tagged mRNAs is translated. Our experiments suggest that anti-GCN4 antibodies should be used as a control to distinguish between true endogenous repression of translation and mere experimentally dependent depletion of the labeling reagent.
Inducible scFv-FP allows imaging of translation during embryogenesis
To overcome the limited amount of scFv-FP and allow the sustained imaging of twi translation from egg laying to gastrulation, we used the UAS/Gal4 system to increase the expression of scFv-FP during oogenesis. We generated four lines with the different scFv-FPs downstream from a UASp promoter (Fig. 3A; Supplemental Fig. S6A) and crossed these with the maternal nos-Gal4 driver (Fig. 3B). No aggregation was detected in live embryos (Supplemental Fig. S6A; Supplemental Movies S16–S19; and see Materials and Methods). To quantify the amount of free scFv-FP using nosEPr-scFvmsGFP2 or nos-Gal4 > UASp-scFv-msGFP2, we performed fluorescence correlation spectroscopy (FCS) at early/mid n.c. 14 in the mesoderm of embryos. Fluorescence signal corresponding to free scFv-msGFP2 was recorded and fitted with diffusion models (Supplemental Fig. S6B). On average, ∼28 times more free scFv-msGFP2 molecules were available in the confocal volume using nos-Gal4 > UASp-scFv-msGFP2 compared to nosEPr-scFvmsGFP2 at early-mid n.c. 14 (∼710 and ∼25 free scFv-msGFP2, respectively) (Supplemental Fig. S6C). Using this system, we asked if it would allow detection of twi translation until late n.c. 14 and gastrulation stage. In twi_suntag_MS2_CRISPR embryos with maternally provided nos-Gal4 > UASp-scFv-msGFP2, we saw that twi mRNAs were translated throughout n.c. 14 (Fig. 3C), even in the most ventral part of the embryo, at the center of the twi domain of expression (Fig. 3C). However, we were not able to detect small dots of scFv-FP, most likely corresponding to individual mature proteins, probably due to the lower signal-to-noise ratio generated by the increased levels of free scFv-msGFP2. We also observed translation dots at the gastrulation stage in fixed twi_suntag_MS2_CRISPR embryos with nos-Gal4 > UASp-scFv-msGFP2 (Fig. 3D, left panels), but not with EPr-scFv-msGFP2 (Fig. 3D, right panels). Similar results were observed with live imaging, where twi_suntag_MS2_CRISPR mRNAs were translated until gastrulation with nos-Gal4 > UASp-scFv-msGFP2 (Fig. 3E; Supplemental Movie S20), but not with EPr-scFv-msGFP2. Control embryos lacking twi_suntag_MS2_CRISPR mRNAs did not show any translation spot at any stage (Fig. 3E; Supplemental Movie S20). These results indicate that the use of nos-Gal4 > UASp-scFv-msGFP2 would be more suitable to detect translation until gastrulation. The UASp promoter drives expression in the germline but is less efficient in somatic tissues (Rørth 1998). On the contrary, the UASt containing HSP70 promoter drives expression in the somatic tissue (Brand and Perrimon 1993). Recently, the UASt promoter has been modified to obtain a promoter, called UASz, to drive expression in both somatic and germline tissues and to be expressed at least four times higher than UASp (DeLuca and Spradling 2018). Due to the high amount of free scFv observed with the UASp-FP lines, we generated a new promoter derived from the UASz, in which we removed the translational enhancer IVS-Syn21 (DeLuca and Spradling 2018) to prevent excessive expression of free scFv-FP and obtain a better signal-to-noise ratio (Supplemental Fig. S7A,B). This new promoter, named UASy, was fused to the scFv-msGFP2 and crossed with the nos-Gal4 driver line. As all the other constructs generated in this study, nos-Gal4 > UASy-scFv-msGFP2 alone did not lead to aggregates during early embryogenesis (Supplemental Fig. S7B; Supplemental Movie S21).
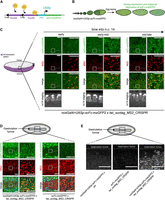
Increasing scFv-FP expression allows translation detection at later stages. (A) Schematic of UASp-scFv-msGFP2 construct and activation by the Gal4 protein. Ten UAS sequences (purple) are placed upstream of the P-promoter (blue) and scFv-msGFP2 (green) sequences. Gal4 proteins (yellow) will bind the UAS sequences to activate transcription of the scFv-msGFP2. (B) Schematic of the expression of the scFv-msGFP2 in nosGal4 > UASp-scFv-msGFP2 female strain during oogenesis until egg deposition. (C, left) Schematic of a sagittal view of a Drosophila embryo with twi expression pattern in purple. Anterior side is on the left, posterior on the right, dorsal on the top, and ventral side on the bottom. Black square represents the imaged area of the right panels. Single Z-planes of confocal images from smFISH with direct scFv-msGFP2 FP signal (green) and MS2 probes (red) on nosGal4 > UASp-scFv-msGFP2 x twi_suntag_MS2_CRISPR embryos in early, early-mid, and mid-late n.c. 14. Gray squares represent the zoomed images for each panel. Nuclei are counterstained with DAPI (gray, bottom images) for staging. Scale bars, 10 µm on the larger images, and 5 µm on the zoomed images. (D, top) Schematic of a Drosophila embryo on the ventral side with gastrulation furrow represented with invaginating cells. Black square represents the imaged area of the bottom panels. (Bottom) Single Z-planes of confocal images from smFISH with direct scFv-msGFP2 FP signal (green) and MS2 probes (red) on nosGal4 > UASp-scFv-msGFP2 x twi_suntag_MS2_CRISPR and scFv-msGFP2 x twi_suntag_MS2_CRISPR embryos at gastrulation stage and on the ventral side. Scale bars, 10 µm on the larger images, and 5 µm on the zoomed images. Note that translation dots are visible only with nosGal4 > UASp-scFv-msGFP2. (E, top) Schematic of a Drosophila embryo on the ventral side with gastrulation furrow represented with invaginating cells. Black square represents the imaged area of the bottom panels. (Bottom) Single Z-planes of confocal images from movie of scFv-msGFP2 x yw, scFv-msGFP2 x twi_suntag_MS2_CRISPR and nosGal4 > UASp-scFv-msGFP2 x twi_suntag_MS2_CRISPR embryos at gastrulation stage (furrow represented with gray dashed line). Scale bar, 10 µm (see related Supplemental Movie S20).
Unfortunately, the translation of twi_suntag_MS2_CRISPR mRNA at the end of n.c. 14 showed a similar pattern—although less pronounced—as with scFv-msGFP2, where translation was mostly present at the border of the twi pattern (Supplemental Fig. S7C), likely due to the weaker expression of the UASy compared to UASp promoters and subsequent depletion of scFv in the central mesoderm. Maternal expression of the scFv-FP constructs limits our ability to observe translational dynamics at later stages in development. To overcome this, we crossed UASy-scFv-msGFP2 with an early zygotic nullo-Gal4 driver to express throughout the embryo. We observed scFv-msGFP2 expression at the beginning of gastrulation (Supplemental Movie S22) and a strong and homogeneous expression in somatic tissues of later embryos (Supplemental Fig. S7D). We conclude that the nos-Gal4 > UASp-scFv-FP represents a good tool to image translation from early embryogenesis to gastrulation stage and that the new UASy-scFv-msGFP2 would enable the imaging of translation in somatic cells at later stages.
Development of the ALFA-array system to monitor translation in Drosophila
After having optimized the scFv-FP-based detector, we sought to generate an optimized orthologous system to the SunTag to detect the translation of two different mRNA species in Drosophila. To this end, we searched for a highly specific nanobody/tag pair and decided to use the recently developed ALFA-Tag (Götzke et al. 2019). The ALFA-Tag is a small peptide that harbors several advantages: its synthetic sequence is absent from the proteome of model organisms, its sequence is smaller than that of the SunTag sequence (15 amino acids compared to 19, respectively; Fig. 4A), it is monovalent, hydrophilic and was effective in Drosophila for protein manipulation (Vigano et al. 2021). Finally, the nanobody anti-ALFA detector (NB-ALFA) is smaller than the scFv (Fig. 4B), is quite soluble and displays a very strong affinity for the ALFA-Tag (measured at 26 pM) (Götzke et al. 2019). Taking advantage of these properties, we multimerized the ALFA-Tag sequences to create a 12x and 32x_ALFA-array. Each ALFA-tag sequence was flanked by a proline to reduce potential influence of neighboring secondary structures, and a spacer of 5 amino acids (GSGSG) to minimize steric hindrance of neighboring peptide binding sites (Fig. 4A,C). The NB-ALFA was fused to the msGFP2 and to the GB1 solubilization tag (also used for the scFv) to avoid potential aggregation caused by the multimerization of ALFA-tag sequences. Finally, we generated a Drosophila line with the NB-ALFA-msGFP2 under the control of nos EPr (NB-ALFA-msGFP2). The system was also tested in mammalian cells (see below).
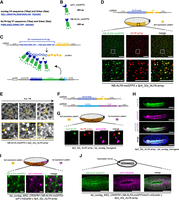
Development of the ALFA-array system to detect nascent translation in Drosophila. (A) Peptide sequence of one suntag with its linker (24 amino acids) and peptide sequence of the ALFA-tag with its linker (20 amino acids). (B) Schematic of the scFv and the nanobody ALFA (NB-ALFA) fused to the FP msGFP2 and their size in amino acids (aa). (C) Schematic of the ALFA-array system developed in this study to detect translation. Thirty-two ALFA-tag sequences were multimerized (blue amino acid sequence) and inserted at the 5′ of the gene of interest sequence (yellow). Upon translation, nanobodies ALFA fused to msGFP2 (NB-ALFA_msGFP2) will bind to the ALFA-tag peptides. As a bipartite system, the NB-ALFA is expressed under nos EPr fused to msGFP2, Streptococcal protein G (GB1) domain, and a nuclear localization signal (NLS). (D) Representation of the transgene mRNA containing 32x_ALFA-array in frame with the insulin-like peptide 4 (Ilp4) gene sequence. Schematic of a sagittal view of a Drosophila embryo with Ilp4 expression pattern in yellow. Anterior side is on the left, posterior on the right, dorsal on the top, and ventral side on the bottom. Black square represents the imaged area of the bottom panels. One Z-plane of confocal images from smFISH with direct Nb-ALFA-msGFP2 FP signal (green) and 32x_ALFA-array probes (red) on NB-ALFA_msGFP2 > Ilp4_32x_ALFA-array embryos in early-mid n.c. 14 is on the ventral side. Scale bars, 10 µm on the larger images, and 5 µm on the zoomed images. (E) Snapshots from representative fast-mode acquired confocal movies of Ilp4_32x_ALFA-array/+ n.c. 14 embryos carrying NB-ALFA_msGFP2. Bright white foci represent nascent translation of Ilp4 transgene. Yellow squares represent zoomed images of the top panels. Nascent translation of Ilp4 transgene is indicated by yellow arrowheads. Scale bars, 10 µm on the larger images, and 2 µm on the zoomed images (see related Supplemental Movie S24). (F) Representation of the transgene mRNAs containing 32x_ALFA-array fused to Ilp4 coding sequence or suntag fused to twist coding sequence used in G and H. (G) Schematic of a Drosophila embryo on the ventral side with twi expression pattern in purple and Ilp4 in yellow. Black square represents the imaged area of the bottom panels. One Z-plane of confocal images from immuno-smFISH with anti-ALFA (green) labeling nascent translation of Ilp4_32x_ALFA-array, probes against 32x_ALFA-array (red) labeling Ilp4_32x_ALFA-array mRNA molecules and anti-GCN4 antibody labeling nascent translation of twi_suntag_transgene (magenta) in n.c. 14 embryos. Scale bar, 1 µm. (H) Maximum intensity projection of a whole embryo confocal image from immunostaining with anti-ALFA antibody (green) and anti-GCN4 antibody (magenta) on Ilp4_32x_ALFA-array; twi_suntag_transgene gastrulating embryo. Scale bar, 100 µm. (I) Schematic of a Drosophila embryo on the ventral side with twi expression pattern in purple and Ilp4 in yellow. Black square represents the imaged area of the bottom panels. Single Z-plane of confocal images from dual-color live imaging of twi_suntag_MS2_CRISPR/+; NB-ALFA_msGFP2/scFv-mScarlet x Ilp4_32x_ALFA-array embryos in n.c. 14. Scale bar, 1 µm (see related Supplemental Movie S26). (J, top) Schematic of a Drosophila embryo on the ventral side with gastrulation furrow represented with invaginating cells. Confocal snapshots of a whole live embryo expressing twi_suntag_MS2_CRISPR/+; NB-ALFA_msGFP2/scFv-mScarlet x Ilp4_32x_ALFA-array, after gastrulation. Note the cytoplasmic staining from Ilp4 translation (green) and nuclear staining from twi translation (purple). Scale bar, 100 µm.
To study translation in Drosophila embryos using the 32x_ALFA-array system, we chose to tag the Ilp4 gene, which codes for a small protein. We reasoned that if we could visualize the translation of a very short transcript/protein, the tool would work even better for longer ones. A 32x_ALFA-array was inserted between the Ilp4 initiation codon and Ilp4 gene body, appended with Ilp4 UTRs and Ilp4 EPr (Ilp4_32x_ALFA-array, Fig. 4D). In the absence of fluorescent detector expression, we found by smFISH that the Ilp4_32x_ALFA-array was expressed in the mesoderm of early Drosophila embryos (Supplemental Fig. S8A), consistent with previous reports for Ilp4 (Brogiolo et al. 2001). Moreover, immunofluorescence with the anti-ALFA antibody showed bright dots specifically colocalizing with Ilp4_32x_ALFA-array mRNAs, and thus representing foci of translation (Supplemental Fig. S7B,C). Importantly, the Ilp4_32x_ALFA-array was not recognized by the anti-GCN4 antibody (Supplemental Fig. S8A).
We next confirmed by live imaging that the NB-ALFA-msGFP2 strain was expressed during embryonic development until the end of n.c. 14, that it was mainly localized to the nucleus, and that it did not form any aggregates or foci in the absence of tagged mRNA (Supplemental Fig. S8D; Supplemental Movie S23). Then, the Ilp4_32x_ALFA-array was crossed with NB-ALFA-msGFP2. The resulting embryos showed bright GFP spots overlapping with Ilp4_32x_ALFA-array mRNAs (Fig. 4D), showing the ability of NB-ALFA-msGFP2 to bind the nascent 32x_ALFA-array in vivo. Next, we monitored translation in live embryos and observed bright GFP dots appearing on the ventral side of the embryo (Fig. 4E; Supplemental Movie S24). The signal was restricted to the mesoderm during n.c. 14 (Supplemental Fig. S8E; Supplemental Movie S25) and became more restricted to the ventral furrow during gastrulation (Supplemental Fig. S8F; Supplemental Movie S25), demonstrating the specificity of the signals. Thus, the Ilp4_32x_ALFA-array – NB-ALFA-msGFP2 system is a useful alternative tool to detect mRNA translation during early embryogenesis.
Additionally, staining with a secondary antibody alone could label the translation foci only when the NB-ALFA-msGFP2 is present (Supplemental Fig. S9A,B). This was also observed with the scFv-FPs (see above Supplemental Fig. S2A,B), suggesting that secondary antibodies can directly bind both the NB-ALFA-msGFP2 and the scFv-FP (Supplemental Figs. S2A,B and S9A,B). Knowing that the only common part between NB-ALFA and scFv is the GB1 solubility domain, we tested whether this domain was responsible for binding secondary antibodies. We removed the GB1 from the scFv-msGFP2 and NB-ALFA-msGFP2, expressed them in Drosophila S2R + cells and performed western blot analyses (Supplemental Fig. S9C). All the scFv and NB-ALFA constructs (with and without the presence of the GB1) could be detected by an anti-GFP antibody in combination with a suitable secondary antibody. However, when using secondary antibodies alone, the constructs with GB1 were still detected, while no band was observed with the constructs without GB1 (Supplemental Fig. S9C). These results demonstrate the direct binding of the GB1 solubilization domain by secondary antibodies.
To test if we could use the ALFA-array system in combination with the SunTag to image the translation of two distinct mRNA species in the same embryo, the Ilp4_32x_ALFA-array was crossed with the twi_suntag_transgene (Fig. 4F). Using immuno-smFISH in n.c. 14 embryos, we observed the two correct expression patterns of Twi and Ilp4, including in the posterior region where only Twi is present (Supplemental Fig. S10A). With higher resolution images, we could visualize single molecules of Ilp4 mRNA in translation well distinct from twi mRNA translation dots (Fig. 4G). Furthermore, we were able to distinguish the localization of the Ilp4 protein in the cytoplasm from the Twi protein in the nucleus (Fig. 4H). Finally, we then combined four different transgenes to express scFv-mScarlet, NB-ALFA-msGFP2, Ilp4_32x_ALFA-array, and twi_suntag_MS2_CRISPR in the same embryo. We were able to live image simultaneously the translation of Ilp4 and twi mRNAs (Fig. 4I; Supplemental Fig. S10B; Supplemental Movie S26) in live embryos. Furthermore, we were again able to clearly distinguish the localization of Ilp4 protein in the cytoplasm from Twi protein in the nucleus of live embryos (Fig. 4J; Supplemental Fig. S10C; Supplemental Movie S27). Together, these results demonstrate that the 32x_ALFA-array can be used in conjunction with the SunTag system to study the translation of two different mRNAs during Drosophila early embryogenesis in live and fixed samples.
Development of the ALFA-array system to monitor translation in human cells
To test the performance of the ALFA-tag labeling system to image translation in a different model, we turned to mammalian cells. We first generated HeLa cells expressing an NB-ALFA-sfGFP recombinant nanobody. To evaluate the binding properties of the nanobody for the ALFA tag in vivo (measured at 26 pM in vitro [Götzke et al. 2019]), we took advantage of the available H2B_mCherry_ALFAtag constructs (Vigano et al. 2021). We performed fluorescence recovery after photobleaching (FRAP) of the NB-ALFA-sfGFP, knowing that H2B itself has a very slow recovery time, lasting hours (Mueller et al. 2012). This experiment showed little recovery of NB-ALFA-sfGFP in 5 min (Supplemental Fig. S11A,B), indicating that it is stably bound to its target in vivo.
Next, we evaluated the performance of the ALFA-array system to image translation in HeLa cells. We inserted a 12x_ALFA-array repetition at the N terminus of the DYNC1H1 gene by CRISPR-mediated knock-in (Fig. 5A), as previously done for the SunTag (Pichon et al. 2016). Heterozygous clones were obtained and imaged with and without a thirty-minute puromycin treatment to inhibit translation. In untreated cells, bright foci were observed in the cytoplasm, which disappeared following puromycin addition (Fig. 5B). In addition, single-molecule fluorescence in situ hybridization (smiFISH) against the endogenous DYNC1H1 mRNAs revealed that the bright ALFA-tag foci colocalized with single mRNAs (Fig. 5C), confirming that these corresponded to DYNC1H1 polysomes. The quality of the signals obtained with only 12 repeats of the ALFA-tag demonstrates the efficiency of this labeling system to image translation.
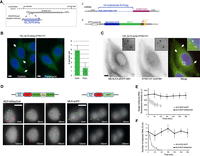
Development of the ALFA-array system to detect nascent translation in mammalian cells. (A) (1) Schematic of the CRISPR/Cas9 targeted insertion strategy to obtain endogenous DYNC1H1 gene tagged with 12X ALFA-tag. (2) Schematic of the ALFA-array system developed in mammalian cells. Twelve ALFA-tag sequences were multimerized (blue amino acid sequence) and inserted at the 5′ of the gene of interest sequence (DYNC1H1, yellow). (3) The NB-ALFA is expressed under spleen focus‐forming virus (SFFV) promoter fused to sfGFP and Streptococcal protein G (GB1) domain. (B, left) Micrographs of HeLa cells expressing a DYNC1H1 allele endogenously tagged 12x_ALFA-array tag and NB-ALFA-sfGFP, and treated (right) or not (left) with puromycin. (Green) NB-ALFA-sfGFP signal; (blue) DAPI. Scale bar, 5 µm. (Arrows) NB-ALFA-sfGFP spots. (Right) Quantification of the number of NB-ALFA-sfGFP spots per cell, with and without puromycin treatment. Error bars, standard deviation (n = 40 cells). (C) Micrographs of HeLa cells expressing a DYNC1H1 allele endogenously tagged 12x_ALFA-array tag and NB-ALFA-sfGFP, and hybridized in situ with a set of probes against DYNC1H1 mRNAs. On the merged panel: NB-ALFA-sfGFP signal (green); smFISH signals (red); DAPI (blue). Scale bar, 5 µm. (Arrows) DYNC1H1 polysomes. (D, top) Schematic of the MCP fusion used to image RNA. (Bottom) Maximum projection intensity images of cells stably expressing MCP-tdStayGold (on the left) or MCP-eGFP (on the right). All images were taken under the same conditions on an OMX wide-field microscope. Six time points were selected (0 min, 30 min, 60 min, 120 min, 150 min, and 180 min), and they are displayed with the same dynamic range. Red arrows point at transcription sites, and green arrows point at individual RNA molecules. Scale bar, 10 μm. (E) Intensities of single RNA molecules over time. Graph shows intensities of RNA molecules (mean and s.d. error; five cells). Because of bleaching, the single molecule signal could no longer be detected and measured after 120 min in the case of MCP-eGFP. Note that MCP-tdStayGold and MCP-eGFP signals were acquired with the same time frame frequency (see Materials and Methods). (F) The graph shows the number of single RNA molecules detected over time using FISHquant (five cells).
Finally, an optimal system to visualize RNA is very useful to image translation at the level of single molecules (Morisaki et al. 2016; Pichon et al. 2016; Wang et al. 2016; Wu et al. 2016; Yan et al. 2016). While the MS2/MCP system provides a very nice way to image single RNAs, it is still limited by the low brightness of the signals and its rapid photobleaching. To improve RNA imaging, we took advantage of the recently developed Staygold FP, which is bright and exceptionally photostable (Hirano et al. 2022). Staygold is an obligate dimeric FP, and we thus made a tandem dimer version (tdStaygold) by degenerating its sequence and separating two monomers with a (SAGG)x5 linker. This dimeric version of Staygold was then fused to MCP and used to image RNA in a previously developed HeLa cell line expressing an HIV-1 reporter RNA tagged with 128 MS2 sites (Tantale et al. 2021). In this system, the MS2 tag is intronic and enables labeling of nascent RNAs as well as nucleoplasmic pre-mRNAs. Live cells were imaged using a frame rate of one 3D image stack every 10 sec for up to 6 h (Fig. 5D). Single RNAs were observed with both NLS-MCP-tdStaygold and the previously used NLS-MCP-eGFP (Tantale et al. 2021). However, the signal bleached rapidly with NLS-MCP-eGFP, and single RNAs were no longer detectable after 120 min. In contrast, the signal showed little photobleaching with NLS-MCP-tdStaygold, and single RNAs were efficiently detected through all of the movie, and kept their initial brightness (Fig. 5E,F). The NLS-MCP-tdStaygold developed here thus shows largely improved performance for RNA imaging.
DISCUSSION
Amplification of biological signals is crucial to studying many biological processes with a high spatiotemporal resolution and single-mRNA-molecule sensitivity. Live imaging of translation at single molecule resolution is a relatively recent technology implemented in 2016 in tissue culture and in 2021 in multicellular organisms. In this study, we provide an expanded toolbox to image translation in living cells and organisms. We will discuss some of the limitations and challenges that need to be considered to obtain robust and reliable results.
Our data show that the choice of the FP is a key element for the signal quality of translation imaging-based systems. The development of FPs is a very rapidly evolving field and FP-based tools need to be updated to optimize their use. Often, the choice of the FP needs to be empirically defined for each cell type, tissue, or organism studied (Cranfill et al. 2016; Heppert et al. 2016; Botman et al. 2019; Lambert 2019; Schneider et al. 2021; Zhang et al. 2023; Chen et al. 2024). One important aspect in this choice is the monomeric property of the FP to prevent aggregation issues. Although the sfGFP (a weak dimer) was the standard FP for fusion with the scFv in mammalian cell culture, we found that it might present an aggregation issue in Drosophila. Local translation of specific mRNAs is an important biological process to control gene expression in space and time. To obtain quantitative answers, it is necessary to precisely resolve the location of mRNAs and where their translation occurs. In the present experimental designs, with the orthologous scFv and the NB-ALFA, the use of secondary antibodies can confound signal interpretation as they appear to bind the scFv and NB-ALFA fusion. We demonstrate that this binding is due to the GB1 solubilization domain added to limit aggregation and is in line with a recent study in plants, which showed a strong affinity between GB1 and IgG (Song et al. 2022). As the GB1 is required for the solubility of the detector, combining translation imaging with immunofluorescence must be carried out with great care, and could require a trial with fluorescent primary antibodies.
An important aspect in imaging live embryos or tissues is signal amplification to increase the signal-to-noise ratio. Indeed, in systems like the MS2/MCP, llama-Tag/FP (Bothma et al. 2018), or scFv/SunTag and their derivatives, the signal appears by local specific accumulation of fluorescent detector, over a diffuse background of molecules freely diffusing in the cells. To improve the signal-to-noise ratio, development of Quenchbody (Q-body) could in theory allow background free detection of translation as well as single mRNA (Dong and Ueda 2021). Currently, the signal-to-noise ratio is optimized by reducing the amount of free fluorescent detector and therefore the background. This is achieved by using weak promoters or targeting the free fluorescent detector to other cellular compartments such as the nucleus, or specific organelles for cytoplasmic analysis. However, one should be careful that the availability of these fluorescent detectors does not become limiting as more and more RNAs and proteins are produced during development. As we illustrate here, the available concentration of the detector can be a major challenge in developing organisms, especially when the source of the detector is controlled by an endogenous promoter and when the amount of template mRNA in translation is important. This limitation can also be particularly important when a burst of translation occurs, such as during viral infection (Boersma et al. 2020; Bruurs et al. 2023). We provide a direct example for detector limitation during early embryogenesis. Here, early activated genes such as twist are highly and rapidly transcribed and translated, leading to rapid depletion of the free detector. We demonstrate the importance of distinguishing between detector depletion and cessation of translation by validating the results with direct immunostaining. We also show that increasing the expression of the detector can overcome the detection problem; however, it will reduce the signal-to-noise ratio and has thus to be taken into consideration for the specific experimental design. To reach conditions that can most accurately capture the dynamics of translation, diverse UAS promoters together with a variety of available Gal4 drivers should be tested, depending on the tissue of interest and the expression level of the tagged gene.
Studies on mRNA localization and local translation have speculated that different mRNAs species may be translationally coregulated (Mateju et al. 2020; Ramat et al. 2020; Kang et al. 2022). To obtain independent translational readouts of different mRNAs simultaneously, one can combine orthogonal tagging systems such as hybrid scFvs, whether HA or FLAG frankenbody (Zhao et al. 2019; Koch et al. 2020; Liu et al. 2021) or MoonTag nanobodies (Boersma et al. 2019). In Boersma et al. (2019), the authors inserted the MoonTag and the SunTag into different translational reading frames of the same RNA. This allowed us to observe in real-time, heterogeneities in the start site selection of individual ribosomes on a single mRNA molecule. Here, we introduce a new antibody-based detector/tag pair to image translation in living cells and organisms based on multimerization of the ALFA-Tag. The ALFA-array system has a number of advantages: (i) it comes from synthetic design and its sequence is thus absent from organisms; (ii) the tag is small, soluble, hydrophilic, and lacks aldehydes-sensitive amino acids altered by fixation; (iii) the detection is through a nanobody, which is small and soluble, and has a very high affinity for the ALFA-Tag (Kd of 27 pM), favorably comparable to the MoonTag (Kd of 30 nM) (Boersma et al. 2019). The new translation imaging system described in this study should be applicable to many different organisms to visualize protein localization and control of translation. Moreover, the availability of several orthogonal systems will allow a better analysis of the complexity of translation dynamics by simultaneously comparing several mRNAs in diverse cellular environments and conditions. The wide range of applications of the ALFA-array system, coupled with other antibody-based translation detectors, provides to the scientific community a highly versatile toolbox to study translation at the single molecule level in cell lines and multicellular organisms. The combination of nascent protein visualization with improved RNA imaging, such as the one provided by the NLS-MCP-tdStaygold, will facilitate future scientific breakthroughs.
MATERIALS AND METHODS
Fly stocks, handling, and genetics
The yw fly stock was used as a wild type. The germline driver nos-Gal4:VP16 (BL4937) and the His2av-mRFP (Bl23651) fly stocks came from Bloomington Drosophila Stock Center. The nullo-Gal4 fly stock came from the Lehmann laboratory. The twi_suntag_MS2_CRISPR, twi_suntag_transgene, and scFv-mScarlet lines were from Dufourt et al. (2021). Briefly, the 32x suntag sequence from Pichon et al. (2016) (containing 33 suntag repeats) was inserted into the frame and into the twi gene (Dufourt et al. 2021), and 128× MS2 from Tantale et al. (2016) was placed just after the stop codon. All live experiments were done at 21°C, except when using—or comparing to—strains containing UAS-GAL4, which were done at 25°C. All Drosophila lines generated in this study are listed in Table 1.
Reagents created in this study
Cloning and transgenesis
scFv-FP under nanos enhancer-promoter (EPr) lines were generated using NEBuilder HiFi DNA Assembly Master Mix with primers listed in Supplemental Table 1 and inserted into an scFv-sfGFP vector (Dufourt et al. 2021) digested with BamHI/XhoI. The transgenic construct was inserted into the VK00033 (BL9750) and VK00027 (BL9744) landing site using PhiC31 targeted insertion (Venken et al. 2006). UASp-scFv-FP lines were done by inserting a fragment of the scFv-FP plasmid digested with XhoI/HpaI in the UASp-scFv-sfGFP vector (Formicola et al. 2021) digested with XhoI/HpaI. The transgenic construct was inserted in the VK00033 (BL9750) landing site using PhiC31 targeted insertion (Venken et al. 2006). FPs were extracted from plasmids: mAvicFP1 from pNCST-mAvicFP1 (addgene 129509), mGreenLantern from pcDNA3.1-mGreenLantern (addgene 161912), msGFP2 (addgene 160461), and mNeonGreen was a kind gift from S. Piatti. The Ilp4 transgene (regulatory regions and coding sequence) was synthesized (GenScript Biotech) into pUC57-simple (Dufourt et al. 2021). The 32x_ALFA-array repeats were synthesized (GenScript Biotech) into pUC57-simple (see Supplemental Material). The 32x_ALFA-array was inserted between Kpn1 and EcoRV restriction sites of the Ilp4 puc57-simple vector. Ilp4-ALFA-array fragment was inserted into pBPhi using PmeI and Nhe1 and injected into BL9750 using PhiC31 targeted insertion (Venken et al. 2006) (BestGene, Inc.). The NB-ALFA were synthesized (GenScript Biotech) into pUC57-simple (see Supplemental Material), then msGFP2, GB1, and an NLS were added using NEBuilder HiFi DNA Assembly Master Mix with primers listed in Supplemental Table 1 and inserted into an scFv-sfGFP vector (Dufourt et al. 2021) digested with BamHI/XhoI. The transgenic construct was inserted into the VK00033 (BL9750) landing site using a PhiC31 targeted insertion (Venken et al. 2006). All cloning for plasmids used in Drosophila S2 cells was performed using the In-Fusion HD Cloning Plus Kit (Takara Bio), and PCR was carried out with CloneAmp HiFi PCR Premix (Takara Bio). Primers used are listed in Supplemental Table 1. To inducibly express SunTag in S2 cells, we generated pMT-SuntagRLucFKBP24MS2v5-SV40 by inserting a SuntagRLucFKBP24MS2v5 fragment (addgene 119946) into a pMT backbone that was PCR-amplified from pMT-EGFPActin5C (addgene 15312), with the In-Fusion HD Cloning Plus Kit. For constitutive expression in S2 cells, pAWF (DGRC stock # 1112) was used as an expression vector. pAWF-stdMCP-stdHalotag was generated by inserting stdMCP-stdHalotag (addgene 104999) into a PCR-linearized pAWF vector, using the In-Fusion HD Cloning Plus Kit. To generate pAWF-scFv-FPs, sequences containing scFv fused to various FPs and GB1-NLS were amplified from scFv-FP under nanos enhancer promoter plasmids generated in this article and ligated with a PCR-linearized pAWF vector using the In-Fusion HD Cloning Plus Kit. All plasmid sequences are listed in Supplemental Material. The sequence of anti-ALFA-msGFP2-GB1-NLS was inserted into a pAWF vector (DGRC #1112) to generate plasmid pAWF-anti-ALFA-msGFP2. To remove GB1 and generate pAWF-anti-ALFA-msGFP2 ΔGB1, a pair of primers flanking the GB1 sequence were used to amplify the entire pAWF-anti-ALFA-msGFP2 sequence, except for the GB1, and ligated with KLD Enzyme Mix (NEB, M0554S). The same primer pairs were used to generate pAWF-scFv-msGFP2ΔGB1 from pAWF-scFv-msGFP2. Plasmids generated in this study are listed in Table 1.
Single-molecule fluorescence in situ hybridization and immuno-smFISH in Drosophila
A pool of 0–4 h after egg-laying (AEL) embryos were dechorionated with bleach for 3 min and thoroughly rinsed with H2O. They were fixed in 1:1 heptane:formaldehyde-10% for 25 min on a shaker at 450 rpm; formaldehyde was replaced by methanol, and embryos were shaken by hand for 1 min. Embryos that sank to the bottom of the tube were rinsed three times with methanol and kept at −20°C for further use.
Embryos were washed 5 min in 1:1 methanol:ethanol, rinsed twice with ethanol 100%, washed 5 min twice in ethanol 100%, rinsed twice in methanol, washed 5 min once in methanol, and rinsed twice in PBT-RNasin (PBS 1×, 0.1% tween, RNasin Ribonuclease Inhibitors). Next, embryos were washed four times for 15 min in PBT-RNasin supplemented with 0.5% ultrapure BSA, and then once for 20 min in wash buffer (10% 20× SCC, 10% formamide). They were then incubated overnight at 37°C in hybridization buffer (10% formamide, 10% 20× SSC, 400 µg/mL Escherichia coli tRNA [New England Biolabs]), 5% dextran sulfate, 1% vanadyl ribonucleoside complex (VRC) and smFISH Stellaris probes against suntag (Dufourt et al. 2021), or 32x_ALFA-array coupled to Quasar 570 (Supplemental Table 1), or probes against 32X MS2 coupled to Cy3 (from E. Bertrand) (Tantale et al. 2021), and/or GCN4 primary antibody (Novus Biologicals C11L34) (1/200), and/or affinity purified rabbit anti-ALFA polyclonal antibody (NanoTag Biotechnologies) (1/200). Probe sequences are listed in Supplemental Table 1. The next day, secondary antibody (1/500 anti-mouse Alexa 488-conjugated [Life Technologies, A21202]; anti-mouse Alexa 647-conjugated [Invitrogen, A32728]; anti-rabbit Alexa 555-conjugated [Life Technologies, A31572], or anti-rabbit Alexa 488-conjugated [Life Technologies, A21206]) was added, if necessary, for 1 h at 37°C in wash buffer. DAPI was added at 45 min (1/1000). Embryos were then washed three times for 15 min in 2× SCC, 0.1% Tween at room temperature before being mounted in ProLong Diamond antifade reagent.
Images were acquired using a Zeiss LSM880 confocal microscope with an Airyscan detector in super resolution (SR) mode. GFP/Alexa-488 was excited using a 488 nm laser, Cy3/Quasar 570 was excited using a 561 nm laser, and Alexa 647 was excited using a 633 nm laser. Laser powers were as follows: 27 μW for 488 nm laser (9 μW for UAS > nos images), 80 μW for 561 nm laser, and 46 μW for 633 nm laser. Laser powers were taken under a 10× objective. Figures were prepared with ImageJ (National Institutes of Health), Photoshop (Adobe Systems), and Illustrator (Adobe Systems).
Percentage of mRNA in translation and polysome intensities were quantified with custom-made algorithms developed in Python (Dufourt et al. 2021). Quantification was done on three areas at the center and three areas at the border of the mesoderm from three mid-late embryos for scFv-msGFP2 > twi_suntag_MS2_CRISPR/+ (see Fig. 2B), and three areas at the center and three areas at the border of the mesoderm from two mid-late embryos for twi_suntag_MS2_CRISPR/+ stained with anti-GCN4 antibody (see Fig. 2E). Outliers were removed using the ROUT method (Motulsky and Brown 2006), embedded in GraphPad Prism 9.3.1 software, with Q set to 0.1%. scFv-FP intensities (see Supplemental Fig. S1F) were quantified using images from two to three early-mid scFv-FP > twi_suntag_MS2_CRISPR/+ embryos; outliers were removed using the ROUT method (Motulsky and Brown 2006), embedded in GraphPad Prism 9.3.1 software, with Q set to 0.1%.
Cell culture
Drosophila S2R + cells (DGRC Stock 150) were maintained at 25°C in Schneider's medium containing 10% fetal bovine serum and 1% penicillin-streptomycin. For the transfection, 0.7 × 10⁶ cells in 350 µL were seeded into each well of a 24-well plate. Cells were transfected with a plasmid mix of pMT-SuntagRLucFKBP24MS2v5-SV40 or pMT-ALFAx32-RLucFKBP24MS2v5-SV40 (200 ng), pAWF-MCP-Halotag (5 ng), pAWF-scFv-FP-GB1-NLS, or pAWF-scFv-FP-NLS (10 ng) using Effectene Transfection Reagent. Twenty-four hours after transfection, cells were first incubated with Schneider's medium containing 200 nM Janelia Fluor 594 HaloTag Ligands (Promega GA1110) for 15 min, and then switched to medium with 1 mM CuSO4 for 1 h or 3 h to induce expression of pMT construct.
HeLa cells were maintained in DMEM supplemented with 10% FBS, 10 U/mL penicillin/streptomycin, and 2.9 mg/mL glutamine in a humidified CO2 incubator at 37°C. For translational inhibition, cells were treated with puromycin at 100 µg/mL for 30 min. Cells were transfected with jetPRIME (Polyplus) and selected on 150 µg/mL hygromycin. For each stable cell line, several individual clones were picked and screened by smFISH with sets of fluorescent oligonucleotide probes against the integrated sequence. For CRISPR recombination, clones were additionally analyzed by genomic PCR using amplicons specific for the nonrecombined or the recombined allele. The CRISPR guide and repair plasmids have been previously described (Pichon et al. 2016). For the repair plasmid, the 12x_ALFA-array replaced the SunTag 56× tag.
The NB-ALFA-sfGFP was introduced into HeLa cells by retroviral infection. HEK293T cells were transiently transfected with a cocktail of plasmids coding for retroviral components and producing the genomic NB-ALFA-sfGFP retroviral RNAs. Viral particles were collected and used to infect recipient HeLa cells, which were then sorted by FACS. Only lowly expressing cells were selected.
For the FRAP experiment, 150 k HeLa cells expressing NB-ALFA-sfGFP were seeded in a 35 mm fluorodish. The day after, cells were transfected with a mix of 3 µg of H2B_mCherry_ALFAtag plasmid, 4 µL of jetPRIME reagent, and 200 µL of jetPRIME buffer. The mix was vortexed for 15 sec and incubated at RT for 10 min before being added to the cells. After 24 h, the medium containing transfection reagents was washed with PBS and replaced with fresh medium. Cells were incubated for an additional 24 h before use. One hour before the FRAP experiment, cells were washed three times with PBS, and incubated in imaging media.
For testing NLS-MCP-tdStaygold, stable expression of fluorescent MCP fusions was achieved by lentivirus-mediated transduction of a self-inactivating vector containing an internal ubiquitin promoter, as described in Tantale et al. (2021). The MCP contained the deltaFG deletion, the V29I mutation, and an SV40 NLS. Cells expressing fluorescent MCP fusions were grown as a pool of clones and FACS-sorted to select cell populations expressing homogeneous levels of fluorescence. The reporter cell lines additionally expressed the HIV-1 reporter gene pIntro-MS2x128, previously described in Tantale et al. (2021).
Western blot
S2 cells (about 106 cells at 3 × 10⁶ cell/mL density) were transfected with 300 ng of plasmids pAWF-scFv-msGFP2, pAWF-scFv-msGFP2ΔGB1, pAWF-anti-ALFA-msGFP2, pAWF-anti-ALFA-msGFP2ΔGB1, or an empty pAWF vector using Effectene Transfection Reagent (Qiagen, # 301425). Cells were harvested 48 h after transfection, lysed with NuPAGE LDS Sample Buffer (Invitrogen NP0007), and denatured by heating at 70°C for 10 min. Proteins in the lysate samples were resolved by electrophoresis using NuPAGE 4–12%, Bis-Tris gel, and transferred onto a PVDF membrane using the Trans-Blot Turbo Transfer System (Bio-Rad). The PVDF membrane was blocked using Intercept (PBS) Blocking Buffer (LI-COR 927-70001) for 1 h before being incubated with primary antibodies (rabbit anti-GFP, Invitrogen, A11122; mouse anti-αTubulin, Sigma, T6199-100UL), with 1:3000 dilution overnight at 4°C. When the primary antibody was omitted, the membrane was incubated in the blocking buffer overnight at 4°C. The membrane was extensively washed before being incubated with secondary antibodies (Goat anti-Rabbit-HRP, Invitrogen 65-6120; Goat anti-Mouse-HRP, Sigma 12-349) at 1:3000 dilution for 1 h at room temperature. The membrane was extensively washed before applying Pierce ECL Western Blotting Substrate (Thermo Scientific 32106) and visualized in the Bio-Rad gel imaging system.
Single-molecule fluorescence in situ hybridization in mammalian cells
Cells were grown on glass coverslips (0.17 mm), washed with PBS, fixed in 4% PFA for 20 min, and permeabilized in 70% ethanol overnight at 4°C. Single-molecule inexpensive fluorescence in situ hybridization (smiFISH) was performed as in Tsanov et al. (2016). Briefly, probes of unlabeled oligonucleotides hybridize with the target RNA and include a supplementary sequence preannealed to a fluorescent oligonucleotide probe called the FLAP (Tsanov et al. 2016). We used sets of oligonucleotides for the DYNC1H1 mRNA (Pichon et al. 2016). Slides were mounted in Vectashield with DAPI (Vector Laboratories).
Fixed cells were imaged at room temperature on an AxioImager Z1 wide-field microscope (63×, NA 1.4; ZEISS), equipped with an sCMOs Zyla 4 0.2 camera (Andor Technology), and controlled by MetaMorph (Universal Imaging). 3D image stacks were collected with a Z-spacing of 0.3 µm. Figures were prepared with ImageJ (National Institutes of Health), Photoshop (Adobe Systems), and Illustrator (Adobe Systems).
Live cell imaging of mammalian cells
Cells were plated on FluoroDish (35 mm, FD35-100, World Precision Instruments) 1 day before the imaging. Before imaging, media was replaced for imaging purposes with a nonfluorescent media (FluoroBrite DMEM, Thermo Fisher Scientific, cat. no. A1896701), and was supplemented with 10% FBS, 1% penicillin/streptomycin, 1% glutamine and rutin (Evrogen). The dish was mounted in a temperature-controlled chamber with 5% CO2 and imaged on an inverted OMXv3 DeltaVision microscope in time-lapse mode. A 100×, NA 1.4 objective was used, with an intermediate × 2 lens and an Evolve 512 × 512 EMCCD camera (Photometrics). Nine stacks with a z-spacing of 0.6 μm were acquired. Illuminating light and exposure time were set at 1% of laser full power, exposure of 40 msec per plane. For the time-lapse mode, one stack was recorded every 10 sec for 3–6 h. Both the MCP-eGFP and MCP-tdStaygold cell lines were imaged under the same conditions.
Signal quantification in mammalian cells
MCP fusions and quantification were performed using big-FISH, a Python-based software for the analysis of RNA single molecules (Imbert et al. 2022). Spots were detected using a Laplacian of Gaussian threshold, and the program returned the number of the RNA molecule, mean, and standard deviation of the fluorescence intensity. The threshold was manually set for each frame for optimal detection of single RNAs, and transcription sites were removed from the analysis. Background nucleoplasmic intensities from free fluorescent MCP proteins were subtracted from each frame. The code for the analysis described in this paper is available on GitHub: https://github.com/fish-quant.
Fluorescence correlation spectroscopy
FCS experiments were performed on a Zeiss LSM780 microscope using a 40×/1.2 water objective. GFP was excited using the 488
nm line of an Argon laser with a constant excitation intensity. Fluorescence intensity fluctuations were acquired for 1 sec,
and autocorrelation functions (ACFs) generated by Zen software were loaded in the PyCorrFit program (Müller et al. 2014) and fit using a simple 3D Gaussian model:
 (1)
with N the number of molecules, τD the diffusion time, and s the structural parameter (shape of the PSF) fixed to 5. The brightness B is obtained by dividing the average value of the
fluorescence intensity F(t) by the number of molecules N obtained by the fit of the ACF with Equation 1.
(1)
with N the number of molecules, τD the diffusion time, and s the structural parameter (shape of the PSF) fixed to 5. The brightness B is obtained by dividing the average value of the
fluorescence intensity F(t) by the number of molecules N obtained by the fit of the ACF with Equation 1.
Multiple measurements per embryo in multiple positions, and embryos at 20°C, were used to generate multiple ACFs, used to extract brightness and molecule numbers. Outliers were removed using the ROUT method (Motulsky and Brown 2006), embedded in GraphPad Prism 9.3.1 software, with Q set to 0.1%.
Fluorescence recovery after photobleaching
FRAP was performed in HeLa cells expressing NB-ALFA-sfGFP, which was transfected with H2B_mCherry_ALFAtag plasmid (Vigano et al. 2021) and imaged 48 h later at 37°C. The following settings were used: a Zeiss LSM980 using a 40×/1.3 oil objective. Images (512
× 512 pixels), 16 bits/pixel, pixel size 0.12 µm, zoom 3.5×, were acquired every ≈10 sec during 30 frames. Excitation: GFP
with a laser at 488 nm and mCherry with a laser at 561 nm. Laser power was measured using the 40×/1.3 oil objective at 1 mW
for 488 nm and 561 nm laser at 100%, and acquisition laser power was measured at 50 µW and 2.2 µW for 488 nm and 561 nm diode
laser, respectively. A circular ROI (3.7 µm diameter) was bleached using 100 pulses of 488 nm and 561 lasers at maximal power
(100%) after one prebleach frame. To discard any source of fluorescence intensity recovery other than molecular diffusion,
the measured fluorescence recovery in the bleached ROI region (Ibl) was corrected by an unbleached ROI (Iunbl) of the same nucleus and another ROI outside of the cells (Iout), following the simple equation:
 (2)
(2)
Light-sheet microscopy
For light-sheet imaging (see Supplemental Fig. S1D; Supplemental Movies S6 and S7), the MuViSPIM (Krzic et al. 2012) (Luxendo, Brüker company) was used. This setup provides two-sided illumination with two Nikon 10×/0.3 water objectives and two-sided detection with two Olympus 20×/1.0 W objectives. The lightsheet is created by scanning a Gaussian beam, as in digital scanned laser light-sheet microscopy (DSLM). We used the line mode, which is an in-built synchronization between rolling shutter readout mode of sCMOS cameras and digital light sheet scanning. This allows the rejection of out-of-focus and scattered light, thus improving the signal-to-noise ratio. Images were acquired by two ORCA Flash 4.0 (C91440) from Hamamatsu and processed by LuxControl v1.10.2. A 50 msec exposure time was used for the green channel with a 488 nm laser. Maximum intensity projections were processed with Fiji (Schindelin et al. 2012).
Live imaging of the scFv-FP and NB-ALFA-msGFP2 alone
For all live imaging experiments, embryos were dechorionated with tape and mounted between a hydrophobic membrane and a coverslip, as described previously (Dufourt et al. 2018). Movies for scFv-FP (see Supplemental Fig. S1; Supplemental Movies S1–S5) and NB-ALFA-msGFP2 under a nanos promoter (see Supplemental Fig. S8; Supplemental Movie S23) were acquired using a Zeiss LSM880 confocal microscope with a Plan-Apochromat 40×/1.3 oil objective lens, with green excitation using a 488 nm laser (6 μw measured with 10× objective lens). A GaAsP detector was used to detect fluorescence with the following settings: 512 × 512-pixel images, zoom 2×, each Z-stack comprised of 25 planes spaced 1 μm apart.
Movies for UASp > scFv-FP (see Supplemental Fig. S6; Supplemental Movies S16–S19) and UASy > scFv-msGFP2 with the nos-Gal4 driver (see Supplemental Fig. S7; Supplemental Movie S21) were acquired using a Zeiss LSM880 confocal microscope with a Plan-Apochromat 40×/1.3 oil objective lens, with green excitation using a 488 nm laser (1 μw measured with 10× objective lens). A GaAsP detector was used to detect fluorescence with the following settings: 512 × 512-pixel images, zoom 2×, each Z-stack comprised of 25 planes spaced 1 μm apart.
Live imaging of the scFv-FP and anti-ALFA-msGFP2 in the presence of tagged genes
For all live imaging experiments, embryos were dechorionated with tape and mounted between a hydrophobic membrane and a coverslip, as described previously (Dufourt et al. 2018). Movies of scFv-FP > twi_suntag_MS2_CRISPR/+ (see Fig. 1; Supplemental Movies S8–S12) were acquired using a Zeiss LSM880 with a confocal microscope in fast Airyscan mode with a Plan-Apochromat 40×/1.3 oil objective lens. GFP was excited using a 488 nm (7 μW measured with 10× objective lens) laser with the following settings: 132 × 132-pixel images, each Z-stack comprised of 15 planes spaced 0.5 μm apart and zoom 8×. Intensity measurement of each polysomes was done on a MIP of five planes using a custom-made software written in Python, that performs a spot detection on the MIP raw data stack. For each time frame, the software performs a Laplacian of Gaussian 2D filter and the filtered images are than thresholded with a user-defined threshold. The threshold is expressed in terms of the average and standard deviation of intensity values of each image in order to have a threshold value self-rescaled with respect to the characteristics of the images itself. Spots smaller in size than a user-defined value are removed (considered as fake detection). Finally, for each of the detected spots, we use a 2D expansion of the spots silhouettes in order to define a region around the spots devoided of any other spots and that we can use to estimate background and measure it all along the time evolution for corrections purposes.
Movies of scFv-FP > twi_suntag_MS2_CRISPR/+ and scFv-msGFP2 > twi_suntag_transgene (see Fig. 2; Supplemental Fig. S4; Supplemental Movies S13–S15) were acquired using a Zeiss LSM880 with a confocal microscope in fast Airyscan mode with a Plan-Apochromat 40×/1.3 oil objective lens. GFP was excited using a 488 nm (4.7 μW measured with 10× objective lens) laser with the following settings: 568 × 568-pixel images, each Z-stack comprised of 61 planes spaced 0.5 μm apart and zoom 2×. Movies were then processed to remove the frame outside of the embryos or containing the membrane signal to correct drifting, and processed stacks were maximum intensity projected using custom-made software, developed in Python (Dufourt et al. 2021).
Movies of nos-Gal4 > UASp-scFv-msGFP2 x twi_suntag_MS2_CRISPR/+ and scFv-msGFP2 x twi_suntag_MS2_CRISPR/+ (see Fig. 3E; Supplemental Movie S20) were acquired using a Zeiss LSM880 with a confocal microscope in fast Airyscan mode with a Plan-Apochromat 40×/1.3 oil objective lens. GFP was excited using a 488 nm (5 μW measure with 10× objective lens) laser with the following settings: 396 × 396-pixel images, each Z-stack comprised of 30 planes spaced 0.5 μm apart and zoom 4×.
Live tile scans of nullo-Gal4 > UASy-scFv-msGFP2-NLS (see Supplemental Movie S22) were acquired using a Zeiss LSM880 with a confocal microscope in fast Airyscan mode with a Plan-Apochromat 40×/1.3 oil objective lens. GFP was excited using a 488 nm (13 μW measured with 10× objective lens) laser with the following settings: 1440 × 2746-pixel images using two tiles, each Z-stack comprised of nine planes spaced 2 μm apart and zoom 0.8×.
Live tile scans of UASy-scFv-msGFP2-NLS/ his2Av-RFP in the presence or not of the nullo-Gal4 driver (see Supplemental Fig. S7D) were acquired using a Zeiss LSM880 with a confocal microscope in fast Airyscan mode with a Plan-Apochromat 40×/1.3 oil objective lens. GFP was excited using a 488 nm (13 μW measured with 10× objective lens), and RFP was excited using a 561 nm laser with the following settings: 1024 × 3072-pixel images using three tiles, each Z-stack comprised of 14 planes spaced 2 μm apart.
Movies of NB-ALFA-msGFP2 under nanos EPr crossed with Ilp4_32x_ALFA-array (see Fig. 4E; Supplemental Movie S24) were acquired using a Zeiss LSM880 with a confocal microscope in fast Airyscan mode with a Plan-Apochromat 40×/1.3 oil objective lens. GFP was excited using a 488 nm (6.4 μW measured with 10× objective lens) laser with the following settings: 256 × 256-pixel images, each Z-stack comprised of six planes spaced 1 μm apart and zoom 6×.
Live tile scans of NB-ALFA-msGFP2 under nanos EPr crossed with Ilp4_32x_ALFA-array (see Supplemental Fig. S8E,F and Movie S25) were acquired using a Zeiss LSM880 with a confocal microscope in fast Airyscan mode with a Plan-Apochromat 40×/1.3 oil objective lens. GFP was excited using a 488 nm (13 μW measured with 10× objective lens) laser with the following settings: 1612 × 4860-pixel images using three tiles, each Z-stack comprised of nine planes spaced 2 μm apart.
Movies of NB-ALFA-msGFP2, scFv-mScarlet, twi_suntag_MS2_CRISPR crossed with Ilp4_32x_ALFA-array (see Fig. 4I; Supplemental Movie S26) and NB-ALFA-msGFP2, scFv-mScarlet crossed with Ilp4_32x_ALFA-array (see Supplemental Fig. S10B; Supplemental Movie S27) were acquired using a Zeiss LSM880 with a confocal microscope in fast Airyscan mode with a Plan-Apochromat 40×/1.3 oil objective lens. GFP and mScarlet were excited using a 488 nm and 561 nm laser, respectively, with the following settings: 372 × 372-pixel images, one Z-plane and zoom 6×.
S2 cell culture imaging
Cells were pipetted into a µ-Slide (Ibidi 80621) and live-imaged using a Zeiss LSM980 confocal microscope with an Airyscan detector in SR mode with a 63X Plan-Apochromat (1.4NA) oil objective lens. GFP was excited using a 488 nm laser, and MCP-Halotag labeled by Janelia Fluor 594 was excited using a 561 nm laser. Cells with mRNAs visible in cytoplasm and with a comparable GFP signal were chosen for acquiring images. Images of individual cells were acquired with the following settings: Z-stack of five planes with 0.5 µm interval, 8× zoom, 396 × 396 pixels, and 8 bits per pixel. GFP foci colocalized with mRNA foci (Janelia Fluor 594 signal) were considered as translation sites, while GFP foci or larger amorphous or ring-like GFP structures that were not colocalized with mRNA were considered as aggregates.
DATA DEPOSITION
All relevant data supporting the key findings of this study are available within the article and its Supplemental Material files or from the corresponding author upon reasonable request. The intensity measurement software is available through https://github.com/ant-trullo/Av_Ints_software/. Drosophila stocks will be deposited to the VDRC stock center; please direct inquiries to Mounia Lagha (mounia.lagha@igmm.cnrs.fr). For materials used in S2 cell experiments, contact Ruth Lehmann (lehmann@wi.mit.edu). For materials used in mammalian cell experiments, contact Edouard Bertrand (edouard.bertrand@igh.cnrs.fr).
SUPPLEMENTAL MATERIAL
Supplemental material is available for this article.
ACKNOWLEDGMENTS
We are grateful to NanoTag Biotechnologies for sharing ALFA-Tag and anti-ALFA nanobody plasmids. We are grateful to Dr. Karim Mazjoub's lab for sharing space in his experimental room. We thank Dr. Xavier Pichon and Dr. Vera Slaninova for their help in setting up the mammalian ALFA-array system and Dr. Vera Slaninova for helping to develop the MCP-tdStaygold fusion. For imaging, we acknowledge Sylvain de Rossi and Montpellier Ressources Imagerie (MRI), a microscopy facility of The National Infrastructure France-BioImaging (FBI), supported by the French National Research Agency (ANR-10-INBS-04). We acknowledge M. Verbrugghe for help with fly handling, and the Montpellier Drosophila Facility (BioCampus). We thank Dr. Radhan Ramadass for assistance with software. We acknowledge Dr. Etienne Schwob and Dr. Eric Kremer for their help in preparing the manuscript. We acknowledge HFSP (CDA grant to M.L.) for early sponsoring of the implementation of the Drosophila translation imaging project. This work was supported by the ERC SyncDev starting grant to M.L., the ANR MemoRNP to M.L., and by IGMM fundings, D.A. was supported by the CNRS consortium GDR ImaBio. M.L., J.D., E.B., and C.F. are sponsored by CNRS. M.B. was supported by a FRM fellowship, ERC SyncDev, and then by HFSP (postdoctoral long-term fellowship). H.L. was supported by ERC SyncDev. J.Dh. was supported by ANR grant ULTIM. E.B. was supported by grants from MSDAvenir and ANR ULTIM.
Author contributions: J.D. conceived the project. J.D. conceptually supervised the work with the help of M.L. at its early stages. J.D., M.B., M.L., E.B., R.L., and R.C. designed the experiments. J.D., M.B., and C.F. performed Drosophila embryos experiments. A.T. developed software. H.L. helped with cloning and fly handling. M.L. acquired funding. E.B. supervised mammalian cells experiments, which were performed by J.Dh. R.L. supervised Drosophila S2 cells experiments performed by R.C., J.D., M.B., R.C., A.T. E.B. and C.F. analyzed and interpreted the results. C.F. analyzed and supervised FCS experiments with the help of J.D. and M.B. J.D. and M.B. wrote the manuscript. M.L., R.C., E.B., R.L., and C.F. edited the manuscript. H.K., F.M., and E.B. developed MCP-tdStaygold fusion. E.B. and J.Dh. developed the mammalian ALFA-array system. J.D., M.B., R.C., D.A., H.K., F.M., and J.Dh. performed all experiments done for the review process. All authors discussed and approved the manuscript.
Footnotes
-
Article is online at http://www.rnajournal.org/cgi/doi/10.1261/rna.080140.124.
- Received June 21, 2024.
- Accepted June 30, 2024.
This article is distributed exclusively by the RNA Society for the first 12 months after the full-issue publication date (see http://rnajournal.cshlp.org/site/misc/terms.xhtml). After 12 months, it is available under a Creative Commons License (Attribution-NonCommercial 4.0 International), as described at http://creativecommons.org/licenses/by-nc/4.0/.
REFERENCES
MEET THE FIRST AUTHOR

Meet the First Author(s) is an editorial feature within RNA, in which the first author(s) of research-based papers in each issue have the opportunity to introduce themselves and their work to readers of RNA and the RNA research community. Maëlle Bellec is the first author of this paper, “Boosting the toolbox for live imaging of translation.” Maëlle is a postdoc at the Max Planck Institute for Heart and Lung Research in Bad Nauheim, Germany. Maëlle did her PhD in Montpellier and moved to Germany in April 2022. She has been working on gene expression regulation both at the transcription and translation levels, using a live imaging method in living organisms.
What are the major results described in your paper and how do they impact this branch of the field?
In this paper, we substantially improved the tools to live image translation in vivo both in cultured cells and Drosophila embryos. Specifically, we found that the detector used in the system to detect translation is critical and therefore needs to be controlled. Importantly, we developed a new system that allowed us to image the translation of two different mRNA species in the same embryo.
What led you to study RNA or this aspect of RNA science?
Initially, I had not intended to study RNA and genetics. During a lecture from Mr. Herzog at the University of Grenoble that I attended by chance, I discovered transposable element biology and gene expression. Since then, I never dropped my interest in RNA biology, from small RNA biology to gene expression during development. I started to study regulation of translation during my PhD and was drawn to this aspect of RNA regulation that was new to me.
If you were able to give one piece of advice to your younger self, what would that be?
If I could give one piece of advice to my younger self, it would be to never give up, and believe in yourself more. I never imagined I would be where I am today, so I would tell myself that it's possible if you stay persistent and have faith in your abilities.
Are there specific individuals or groups who have influenced your philosophy or approach to science?
Karl Popper's philosophy, which I leaned from Dr. Jérémy Dufourt, has profoundly influenced my approach to science. Popper's emphasis on the openness to criticism and the principle of falsifiability as a criterion for scientific theories has been central to my scientific methodology. By prioritizing the search for potential refutations and welcoming diverse perspectives, I aim to contribute to the robust and dynamic advancement of scientific understanding.
What are your subsequent near- or long-term career plans?
After my postdoc, I wish to continue in academia. I want to study the spatiotemporal control of gene expression, particularly translation, during the first step of the development of a vertebrate embryo. For this, I hope to set up my own lab studying zebrafish embryogenesis and developing high-end imaging tools.




