


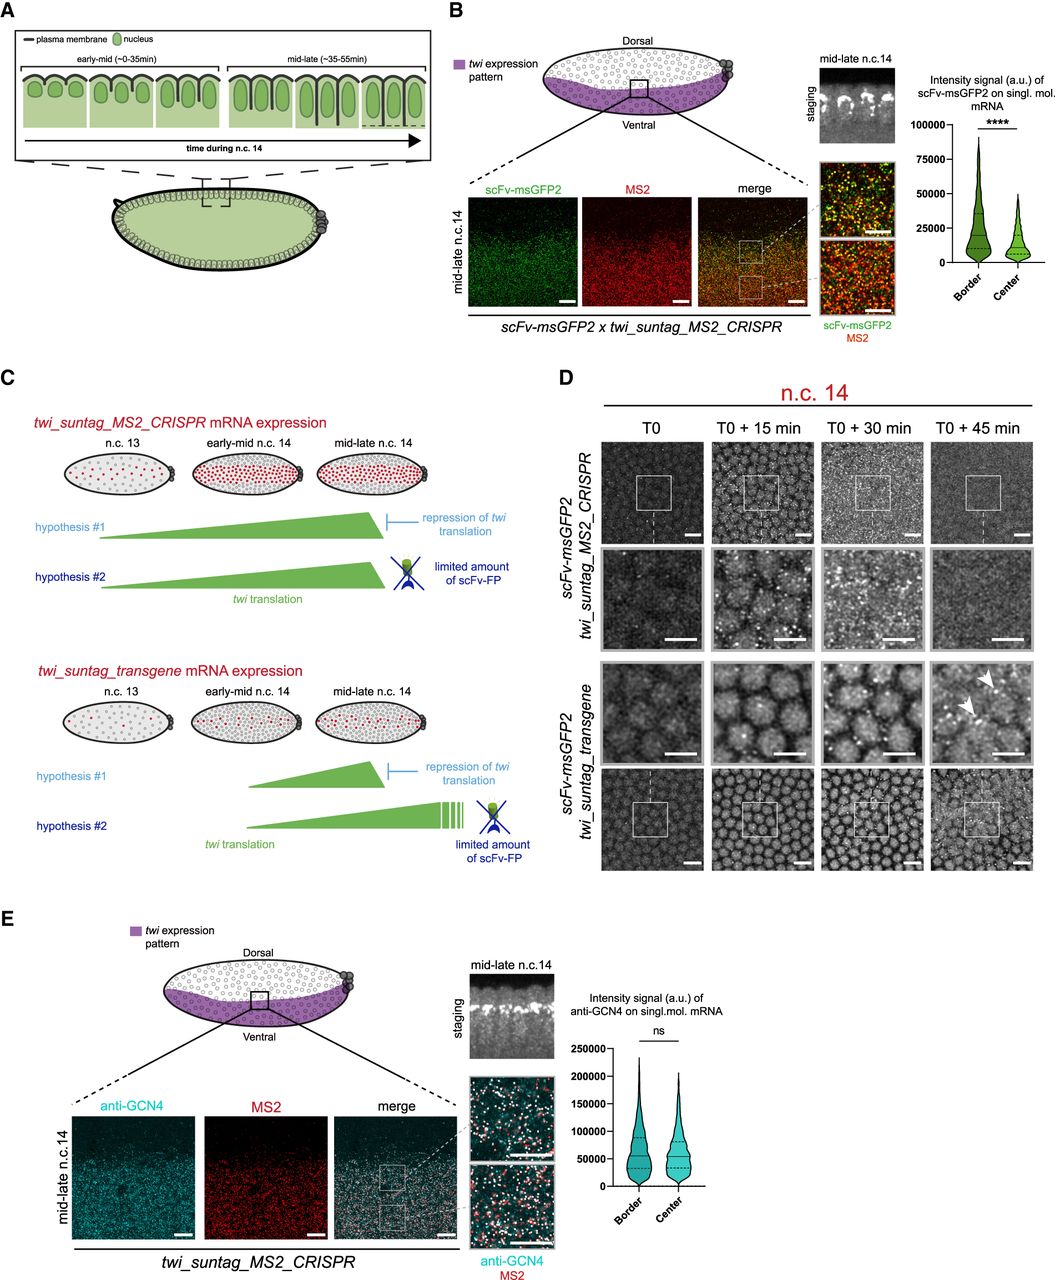
scFv-FP concentration under nos EPr creates an artifactual translation arrest of endogenous twi mRNA during early embryogenesis. (A) Schematic of nuclear elongation and cellularization during n.c. 14. In this study, we defined one early-mid stage (corresponding to 0–35 min of the n.c. 14 from the mitosis) and one mid-late stage (corresponding to 35–55 min of the n.c. 14 from the mitosis). (B, top) Schematic of a sagittal view of a Drosophila embryo with twi expression pattern in purple. Anterior side is on the left, posterior on the right, dorsal on the top, and ventral side on the bottom. Black square represents the imaged area of the bottom panels. (Bottom) A single Z-plane of confocal images from smFISH with direct FP signal in green (scFv-msGFP2) and MS2 probes (red) on scFv-msGFP2 x twi_suntag_MS2_CRISPR embryos at mid-late n.c. 14. Gray squares represent the zoomed images in the right panels. The two different zoomed images represent border (top) and internal (bottom) zone of the imaged pattern. Scale bars, 10 µm on the larger images, and 5 µm on the zoomed images. Staging is given by DAPI staining on a sagittal view of the imaged embryo (black and white image at the bottom). Quantification of the scFv-msGFP2 signal intensity on single-molecule mRNA at the border at mid-late n.c. 14 stages (dark green, nine images from three embryos, n = 2570), and center (light green, nine images from three embryos, n = 2737) of the mesoderm is represented on the right. (C) Schematic representing twi_suntag_MS2_CRISPR mRNA expression from n.c. 13 to late n.c. 14 in red. From the observations on twi CRISPR translation (B), two hypotheses can be considered. Hypothesis 1 is that the decrease of translation observed at mid-late n.c. 14 is due to an active repression of translation. Hypothesis 2 is that the amount of scFv-FP becomes limiting at mid-late n.c. 14, leading to an arrest of the detected green signal. These two hypotheses are represented in the context of twi_suntag_MS2_CRISPR expression (above) and twi_suntag_transgene expression (below). twi_suntag_transgene mRNA is expressed more stochastically and later than twi_suntag_MS2_CRISPR mRNA. In hypothesis 1, a decrease of translation should be simultaneously observed for the two constructs (mid-late n.c. 14). In hypothesis 2, no arrest of translation should be observed with twi_suntag_transgene as the amount of mRNA is lower. (D) Snapshots taken each 15 min from movies of scFv-msGFP2 x twi_suntag_MS2_CRISPR or scFv-msGFP2 x twi_suntag_transgene embryos on the ventral side. T0 corresponds to early n.c. 14. White squares represent the zoomed images in the center of the panel. Note a persistence of translation for the twi_suntag_transgene at T0 + 45 min (white arrowhead), absent in twi_suntag_MS2_CRISPR embryos. Scale bars, 10 µm on the larger images, and 5 µm on the zoomed images (see related Supplemental Movies S13 and S14). (E, top) Schematic of a sagittal view of a Drosophila embryo with twi expression pattern in purple. Anterior side is on the left, posterior on the right, dorsal on the top, and ventral side on the bottom. Black square represents the imaged area of the bottom panels. (Bottom) Single Z-planes of confocal images from immuno-smFISH with anti-GCN4 antibody (cyan) and MS2 probes (red) on twi_suntag_MS2 embryos at mid-late n.c. 14. Gray squares represent the zoomed images in the right panels. The two different zoomed images represent border (top square) and internal (bottom square) zones of the imaged pattern. Scale bars, 10 µm on the larger images, and 5 µm on the zoomed images. Staging is given by DAPI staining on a sagittal view of the imaged embryo (black and white image at the bottom). Quantification of the anti-GCN4 signal intensity on single-molecule mRNA at the border (dark blue, six images from two embryos, n = 3211) and center (light blue, six images from two embryos, n = 4001) at mid-late n.c. 14 stages of the mesoderm is represented on the right.




