


Tho2 is critical for the recruitment of Rrp6 to chromatin in response to perturbed mRNP biogenesis
- Valentin Beauvais1,
- Kévin Moreau1,
- Bojan Žunar2,
- Nadège Hervouet-Coste1,
- Ana Novačić2,
- Aurélia Le Dantec1,
- Michael Primig3,
- Christine Mosrin-Huaman1,
- Igor Stuparević2 and
- A. Rachid Rahmouni1,4
- 1Centre de Biophysique Moléculaire, UPR 4301 du CNRS, 45071 Orléans, France
- 2Laboratory of Biochemistry, Department of Chemistry and Biochemistry, Faculty of Food Technology and Biotechnology, University of Zagreb, Zagreb, Croatia
- 3Univ Rennes, Inserm, EHESP, Irset (Institut de recherche en santé, environnement et travail)—UMR_S 1085, F-2 Rennes, France
- Corresponding author: istuparevic{at}pbf.hr
-
Handling editor: Elena Conti
Abstract
The eukaryotic THO complex coordinates the assembly of so-called messenger RNA–ribonucleoprotein particles (mRNPs), a process that involves cotranscriptional coating of nascent mRNAs with proteins. Once formed, mRNPs undergo a quality control step that marks them either for active transport to the cytoplasm, or Rrp6/RNA exosome-mediated degradation in the nucleus. However, the mechanism behind the quality control of nascent mRNPs is still unclear. We investigated the cotranscriptional quality control of mRNPs in budding yeast by expressing the bacterial Rho helicase, which globally perturbs yeast mRNP formation. We examined the genome-wide binding profiles of the THO complex subunits Tho2, Thp2, Hpr1, and Mft1 upon perturbation of the mRNP biogenesis, and found that Tho2 plays two roles. In addition to its function as a subunit of the THO complex, upon perturbation of mRNP biogenesis Tho2 targets Rrp6 to chromatin via its carboxy-terminal domain. Interestingly, other THO subunits are not enriched on chromatin upon perturbation of mRNP biogenesis and are not necessary for localizing Rrp6 at its target loci. Our study highlights the potential role of Tho2 in cotranscriptional mRNP quality control, which is independent of other THO subunits. Considering that both the THO complex and the RNA exosome are evolutionarily highly conserved, our findings are likely relevant for mRNP surveillance in mammals.
Keywords
INTRODUCTION
In eukaryotes, mRNA molecules mature by undergoing several complex and highly coordinated processes. First, RNA polymerase II transcribes protein-coding genes into primary transcript mRNAs (pre-mRNAs), which are then 5′-capped, spliced, 3′-cleaved, polyadenylated, and assembled with various proteins (Cramer 2019). This process leads to the assembly of messenger RNA–ribonucleoprotein particles (mRNPs), which are exported from the nucleus to the cytosol for mRNA translation.
The assembly of mRNPs is guided by the carboxy-terminal domain (CTD) of RNA polymerase II, which recruits the THO complex. THO is a heterotetramer of Hpr1, Mft1, Tho2, and Thp2 (Chávez et al. 2000) that interacts with Tex1 (Peña et al. 2012), and recruits the mRNA-associated factors Sub2 and Yra1 at the 3′-ends of genes to form the TREX (TRanscription-EXport) complex (Stäßer et al. 2002). Through the RNA-binding protein Gbp2 and the posttranscriptionally modified Hpr1 subunit of THO, TREX interacts with Mex67 to flag mRNPs for export from the nucleus to the cytoplasm (Katahira 2012; Bretes et al. 2014; Hackmann et al. 2014; Xie et al. 2021).
THO is crucial for proper mRNP biogenesis. Without it, nuclear aggregates form and several GC-rich genes cannot be appropriately transcribed. Moreover, its absence induces genome instability by promoting abnormally frequent formation of R-loops, especially at CAG repeats (Peña et al. 2012; Brown et al. 2022). Moreover, mRNPs without THO are recognized as aberrant, retained in the nucleus, and their transcripts are degraded by the nuclear RNA exosome (Libri et al. 2002).
Aberrant mRNPs are recognized by the mRNP quality control (mRNP QC) system. However, as such mRNPs arise only rarely in wild-type yeast cells, and they are mainly studied either by investigating THO/Sub2 mutants or by analyzing specific wild-type transcripts under stress conditions (e.g., HSP104) (Rougemaille et al. 2007; Schmid and Jensen 2008; Villa et al. 2008; Stuparević et al. 2013). Such studies showed that aberrant mRNPs are disposed of by the TRAMP complex (Trf4/5–Air2–Mtr4) and the nuclear RNA exosome-associated 3′–5′ exonuclease Rrp6. However, these studies failed to identify specific components of the mRNP QC, that is, proteins, which recognize aberrant mRNPs and flag them for degradation.
To untangle the mechanism of yeast cotranscriptional mRNP QC, our group previously developed a Rho-based experimental system in Saccharomyces cerevisiae (Mosrin-Huaman et al. 2009). This system relies on an inducible nuclear version of the bacterial helicase Rho. This protein is a barrel-shaped nuclear hexameric RNA-dependent helicase and translocase responsible for 50% of transcription termination events in bacteria (Stuparević et al. 2020). As the helicase binds RNA, it translocates along the molecule and disrupts established RNA–protein interactions. Our genome-wide S. cerevisiae Rho-based studies (Moreau et al. 2019) have shown that Rho targets 20% of yeast mRNAs, most likely at their unstructured C-rich regions, which are reminiscent of bacterial Rho interaction sites. Moreover, using the model PMA1 locus, we have shown that Rho helicase impairs transcript processing and packaging factor recruitment during early and late transcription (Stuparević et al. 2013). Thus, our experimental system generates many nuclear mRNPs that are marked as aberrant by mRNP QC, retained in the nucleus, and subsequently degraded by a pathway involving Rrp6.
In this study, we used the yeast-based Rho system to investigate the role of THO in the cotranscriptional mRNP QC step. Consistent with other mRNP QC studies (Meinel et al. 2013; Moreau et al. 2019), we performed chromatin immunoprecipitation followed by DNA sequencing (ChIP-seq) to analyze, among others, actively transcribed and DNA-associated pre-mRNAs (local transcripts). This methodology enabled us to study the mRNP QC of a population of nascent, cotranscribed mRNPs. Our results show that Rho excludes Mft1 and Hpr1, while it enriches Tho2 and Rrp6 on chromatin, and that the enrichment of Rrp6 depends on the CTD of Tho2. On this basis, we propose a model in which Tho2 recognizes aberrant mRNPs, and marks them for degradation by the Rrp6 subunit of the nuclear RNA exosome.
RESULTS
Rho perturbs mRNP biogenesis by altering the recruitment of THO subunits to local transcripts
Our previous investigations with PMA1 have shown that Rho activity along the nascent transcript interferes with normal recruitment of mRNA processing and packaging factors, yielding mRNPs that are recognized as defective and eliminated by the QC apparatus in a process involving the 3′–5′ exonuclease activity of Rrp6 (Honorine et al. 2011; Stuparević et al. 2013; Moreau et al. 2019). In addition, it was shown that the reduction in mRNA levels was not due to a direct effect of Rho on the transcription elongation complex, which would lead to premature termination of transcription, because no significant reduction in RNAPII occupancy along the PMA1 gene was detected upon expression of Rho (Stuparević et al. 2013). Furthermore, we have shown that Rho interferes with proper mRNP maturation by displacing the THO subunit Mft1 from the DNA-associated pre-mRNA transcript (local transcript) of PMA1 (Stuparević et al. 2013). To extend this analysis, in this study we investigated whether Rho affects the retention of the THO subunits Hpr1, Thp2, and Tho2 on this local transcript. For this investigation, we used myc-tagged THO subunits (Tho2, Hpr1, Mft1, and Thp2), as the introduction of a myc tag does not disturb the Rho-induced phenotype or functionality of the constructed stains (Supplemental Fig. S1). ChIP analysis of PMA1 in strains with myc-tagged THO subunits showed that induction of Rho depleted chromatin-bound Hpr1 and Thp2 (Fig. 1A). Remarkably, chromatin-bound Tho2 deviated from this pattern, being enriched fivefold upon induction of Rho, indicating a role for Tho2 in the mRNP QC of aberrant mRNP transcripts. Absence of Tho2 or its CTD restores the abundance of mRNAs such as IZH4, HXT6, and GAC1 to nearly physiological levels upon Rho induction (Supplemental Fig. S2). A ChIP assay coupled with RNase I treatment shows that Tho2 recruitment does not depend on RNA binding in physiological (−Rho) conditions (Fig. 1B), in accordance with previously published results (Abruzzi et al. 2004; Peña et al. 2012). However, in the presence of activated Rho expression, we observe a large decrease in Tho2 recruitment to chromatin upon RNase A treatment (Fig. 1B), and also to PMA1 mRNA (Fig. 1C) in a RIP experiment, demonstrating that Tho2 recruitment to chromatin in the conditions of perturbed RNA biogenesis is RNA-dependent. To ensure that we did not observe a PMA1-specific effect regarding the pattern of THO subunit recruitment to chromatin, we sought to extend this analysis to all protein-coding loci. To this end, we performed a ChIP-seq analysis of myc-tagged Tho2, Hpr1, and Mft1 strains, in the presence or absence of Rho, and combined the data with our previously published Rho-based myc-tagged Rrp6 ChIP data set (Moreau et al. 2019). For each condition, we sequenced two biological replicates (85% aligned reads, r > 0.98). Without Rho, the in vivo binding profiles of Hpr1, Mft1, and Tho2 followed a similar trend (Fig. 2A; Gómez-González et al. 2011). Consistent with Meinel et al. (2013), the THO subunits were recruited progressively more toward the 3′-ends of the local transcripts, peaking around the transcription termination site (TTS). This suggests that the THO subunits were recruited increasingly efficiently as transcription progressed. In the presence of Rho, the in vivo binding profiles of the THO subunits were altered (Fig. 2A). Hpr1 and Mft1 levels failed to increase toward the 3′-ends of the local transcripts and remained at basal levels. On the contrary, Tho2 bound to the local transcripts almost nondiscriminately. Moreover, the Tho2 signal reached a plateau during mid-elongation, and its intensity was comparable to that of the Tho2 peak in cells lacking Rho. Thus, the data suggest that Rho displaces local transcript-bound Hpr1 and Mft1 and increases Tho2 levels.
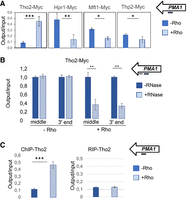
Rho action interferes in the cotranscriptional deposition of THO subunits packaging factors. (A) PMA1 ChIP of cells carrying myc-tagged THO subunits (Tho2, Hpr1, Mft1, and Thp2). The cells either did (+Rho) or did not (−Rho) express Rho. The panel shows the averages of three experiments; error bars in the graph represent SD, while asterisks denote the calculated P-value (***) P < 0.001, (**) P < 0.01, (*) P < 0.05. The top right inset illustrates the hybridization position of the oligonucleotides used for the qPCR (thick black line; coordinates on chromosome 7: 481431–481656). (B) PMA1 ChIP results for myc-tagged Tho2 strain harboring an empty vector (−Rho) or Rho expression vector (+Rho) with and without RNase A treatment. The average result for samples untreated by RNase is set as a reference at 100% for each gene locus (middle and 3′end). Percentage after RNase treatment was calculated relative to the untreated samples. The top right inset illustrates the hybridization position of the oligonucleotides used for the qPCR (middle, thick black line—coordinates on chromosome 7: 481431–481656; thick gray line—coordinates on chromosome 7: 480135–480416). The average of at least two independent experiments is shown. Error bars in the graph represent SD, while asterisks denote the calculated P-value (***) P < 0.001, (**) P < 0.01, (*) P < 0.05. (C) PMA1 ChIP and RNA immunoprecipitation experiments were performed with a myc-tagged Tho2 strain harboring an empty vector (−Rho) or a Rho expression vector (+Rho). The panel shows the averages of three experiments; error bars in the graph represent SD, while asterisks denote the calculated P-value (**) P < 0.01. The top right inset illustrates the hybridization position of the oligonucleotides used for the qPCR (thick black line; coordinates on chromosome 7: 481431–481656).
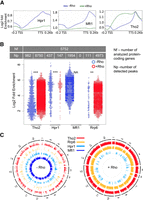
Quantification of chromatin (local transcript)-bound subunits of THO. (A) Average in vivo binding profiles of Hpr1, Mft1, and Tho2 with (+Rho, green line) and without the Rho helicase (−Rho, blue line), across 5752 yeast protein-coding loci. The y-axis plots the log2 ratio between IP samples (output) and input DNA. (B) Beeswarm plot summarizing the log2 fold-enrichment of Tho2, Hpr1, Mft1, and Rrp6 ChIP-seq peaks. P-values: 0.05 > * > 0.01 > ** > 0.001 > ***, (NA) not applicable, (Nf) number of analyzed protein-coding genes, (Np) number of detected peaks. (C) Circos plots showing the genome-wide distribution of ChIP-seq peaks across the protein-coding loci in cells expressing (+Rho) or not expressing (−Rho) the Rho helicase.
As it was previously revealed by ChIP analysis of PMA1, the Rho effect on mRNP protein composition is mediated by the displacement of the THO subunits Mft1 and Thp2, but not Tho2, with a concomitant enrichment by components of the Rrp6-dependent QC. To explore the general nature of the process, we analyzed the genome-wide association with chromatin in −Rho and +Rho conditions of Tho2, Hpr1, Mft1, and Rrp6 (Fig. 2B; Supplemental Data). Using differential peak calling, we identified ChIP-seq peaks of the THO subunits that overlapped protein-coding regions (Fig. 2B). Notably, 82% of the peaks overlapped protein-coding genes in −Rho and 70% in +Rho cells (minimal enrichment 1.5–2.0-fold). Among them, we identified 437 Hpr1 and 1954 Mft1 peaks in −Rho cells, and 147 Hpr1 and 0 Mft1 peaks in +Rho cells. Conversely, we identified 982 Tho2 peaks in −Rho cells and 8750 Tho2 peaks in +Rho cells. Similarly, the number of Rrp6 local transcript-associated peaks substantially increased from 111 in −Rho cells to 4973 in +Rho cells. The latter results could be explained by the fact that Tho2 contributes to the QC of Rho-affected, aberrant local transcripts during the recruitment of Rrp6. Using circos plots, we investigated the genome-wide distribution of ChIP-seq peaks in protein-coding regions (Fig. 2C). On these circular plots of the S. cerevisiae genome, signal intensity reflected the binding of THO subunits and Rrp6 to chromatin. The circos plots show that Rho-induced depletion of Hpr1/Mft1 and enrichment of Tho2/Rrp6 occurs on a genome-wide scale. Due to higher efficiency, we compare the effects of Tho2 to that of Mft1 rather than Hpr1, due to the poorer efficiency of Hpr1 ChIP-seq as compared to Mft1 ChIP-seq.
Tho2 contributes to Rrp6's recruitment to chromatin
Our previous work showing that Mft1 is removed upon Rho induction now extends to the THO subunit Hpr1 (Stuparević et al. 2013). We suspect that the other subunits Thp2 and Tho2 are likely to be removed along with Hpr1 and Mft1, because THO is known to function as a tetrameric complex. However, the removal of the Tho2 subunit is masked by the increased recruitment we observed. This unexpected event is accompanied by an increased recruitment of the Rrp6 subunit, suggesting that the binding of Tho2 to the aberrant local transcript is the signal that triggers Rrp6 recruitment.
To investigate this hypothesis, we assayed binding of myc-tagged Rrp6 to PMA1 local transcripts in tho2Δ and mft1Δ strains (Fig. 3A). ChIP analysis showed that Rho expression triggers an increased recruitment of Rrp6 to aberrant local transcripts in the mft1Δ background, whereas the intracellular level of the other subunits of THO complex remains unchanged (not shown), an effect that is also present in wt cells. However, in the tho2Δ strain, Rrp6 increased recruitment is no longer observed in Rho-expressing cells. Therefore, Rrp6-dependent degradation of PMA1 mRNA in the tho2Δ strain is completely attenuated by Rho induction. Taken together, these results indicate that the elimination of defective mRNPs cannot occur in the absence of Tho2.
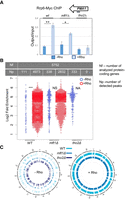
Tho2 recruits Rrp6 to aberrant local transcripts. Assays were performed with wild-type, tho2Δ, and mft1Δ cells, expressing (+Rho) or not expressing (−Rho) Rho. (A) PMA1 ChIP of cells carrying myc-tagged Rrp6. The panel shows the averages of three experiments, with error bars denoting SDs, while asterisks denote the calculated P-value (**) P < 0.01, (*) P < 0.05. The top right inset illustrates the hybridization position of the oligonucleotides used for the qPCR (thick black line; coordinates on chromosome 7: 481431–481656). (B) Beeswarm plot summarizing the log2 fold-enrichment of Rrp6 ChIP-seq peaks. P-values: 0.05 > * > 0.01 > ** > 0.001 > ***, (NA) not applicable, (NS) not significant, (Nf) number of analyzed protein-coding genes, (Np) number of detected peaks. (C) Circos plots showing the genome-wide distribution of Rrp6 ChIP-seq peaks across the protein-coding loci.
The genome-wide Rrp6 ChIP-seq analysis extended this result to other protein-coding loci. These loci overlapped 65% of Rrp6 peaks in −Rho and 80% in +Rho cells (enrichment threshold 1.7–3.5-fold). The analysis showed that, compared to wild-type Rho-expressing cells, the binding of Rrp6 was slightly decreased in the mft1Δ +Rho strain but completely abolished in the tho2Δ +Rho strain (Fig. 3B; Supplemental Fig. S3; Supplemental Data). Differential ChIP-seq peak calling identified 111 Rrp6 peaks in −Rho and 4973 Rrp6 peaks in +Rho wild-type cells, as well as 338 Rrp6 peaks in −Rho and 2832 Rrp6 peaks in +Rho mft1Δ cells, all distributed homogenously across the genome (Fig. 3C). Strikingly, peak calling identified 333 Rrp6 peaks in −Rho and 0 Rrp6 peaks in +Rho tho2Δ cells. Thus, Tho2 appears to play a role in the recruitment of Rrp6 to chromatin and—by implication—to aberrant local transcripts, which leads to their degradation.
The Tho2 carboxy-terminal domain mediates the binding of Rrp6 to chromatin
Interestingly, Tho2 is the only subunit of the THO complex capable of binding nucleic acids, and the CTD of this protein plays a key role in this process. Tho2 CTD, which is required for the function but not the stability of the THO complex (Peña et al. 2012), could therefore anchor Tho2 to the aberrant mRNA before their Rrp6-mediated elimination.
This hypothesis was evaluated by performing ChIP-seq analysis in myc-tagged Rrp6 strains carrying either a truncated version of the Tho2 CTD (tho2Δ1408–1597) or an allele lacking the entire nucleic acid-binding domain (tho2Δ1271–1597) (Fig. 4A).
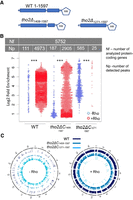
The Tho2 CTD recruits Rrp6 to aberrant local transcripts. Assays were performed with wild-type, tho2Δ1408–1597, and tho2Δ1271–1597 cells, expressing (+Rho) or not expressing (−Rho) Rho. (A) Schematic of the Tho2 constructs. tho2Δ1408–1597: a Tho2 variant with truncated Tho2 CTD (lacking residues 1408–1597), tho2Δ1271–1597: a Tho2 variant lacking the entire Tho2 CTD (lacking residues 1271–1597). (B) Beeswarm plot summarizing the log2 fold-enrichment of Rrp6 ChIP-seq peaks. P-values: 0.05 > * > 0.01 > ** > 0.001 > ***, (NA) not applicable, (NS) not significant, (Nf) number of analyzed protein-coding genes, (Np) number of detected peaks. (C) Circos plots showing the genome-wide distribution of Rrp6 ChIP-seq peaks across the protein-coding loci.
Differential ChIP-seq peak calling identified 111 Rrp6 peaks in −Rho and 4973 Rrp6 peaks in +Rho wild-type cells, whereas in the cases of partially or fully truncated Tho2 CTD variants, a considerable change was observed: In tho2Δ1408–1597 cells, 187 Rrp6 peaks were observed in −Rho but only 2905 Rrp6 peaks in +Rho, and in tho2Δ1271–1597 cells this effect was aggravated since 585 Rrp6 peaks were observed in −Rho and only 25 Rrp6 peaks in +Rho conditions (Fig. 4B; Supplemental Data). All peaks were distributed homogenously across the genome (Fig. 4C; Supplemental Fig. S4). In conclusion, the strain lacking the entire Tho2 CTD almost completely failed to recruit Rrp6 at the genome-wide level, which underlines the importance of Tho2 CTD for the recruitment of Rrp6 to chromatin under Rho induction.
Rho induction enhanced positional correlation between Tho2 and Rrp6
To gain insight into the functional relationship between Rrp6 and Tho2 in the QC, we used our ChIP-seq approach to study the distribution of Rrp6 and THO subunits proteins on chromatin. We mapped Hpr1, Mft1, Tho2, and Rrp6 ChIP-seq peaks at a confidence level of 0.95, focused on 491 genes whose Rho-affected aberrant local transcripts were degraded by Rrp6 (Moreau et al. 2019), and correlated their positions in −Rho and +Rho cells (Fig. 5A). As expected, without Rho, all THO subunits were strongly correlated in position (r = 0.51–0.68). Furthermore, no correlation of the Mft1 and Hpr1 with Rrp6 was observed, whereas a slight correlation with Rrp6 (r = 0.26) was observed for Tho2. This trend was enhanced upon Rho expression since the correlation between Tho2 and Rrp6 reaches 0.42. Moreover, 80% of Rrp6 peaks in +Rho cells overlapped with Tho2 peaks (Fig. 5B; Supplemental Fig. S5). In this work, we demonstrate that Tho2 possesses a yet unknown function important for the Rrp6-dependent cotranscriptional mRNP QC. Because this activity requires the Tho2 carboxy-terminal nucleic acids binding domain, we propose that Tho2 binding to nucleic acids flags aberrant nascent mRNP for subsequent Rrp6-dependent degradation. Further studies under conditions where the two players are stabilized would definitively confirm this attractive hypothesis (Fig. 5C).
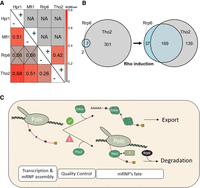
Rho induction enhanced the positional correlation between Tho2 and Rrp6. (A) Colocalization of the Tho2, Hpr1, Mft1, and Rrp6 ChIP-seq peaks estimated through an EDF correlogram showing the positional correlation of each protein pair. NA stands for nonapplicable in case not enough peaks were available to calculate the correlation. (B) Venn diagram plotting the overlap of the Tho2 and Rrp6 ChIP-seq peaks. (C) The drawing depicts the possible dual role of Tho2, either as part of THO or as a factor that flags aberrant mRNPs, targeting them for degradation by Rrp6. Successfully assembled mRNP is bound by THO and exported to the cytoplasm. Conversely, aberrant mRNPs are bound by Tho2, which recruits Rrp6 that then degrades aberrant local transcripts.
DISCUSSION
The current mRNP QC model suggests that aberrantly processed and packaged mRNPs are recognized as they are being transcribed and then degraded by Rrp6 (Rougemaille et al. 2007; Villa et al. 2008). However, it fails to identify proteins that mark such mRNPs for degradation. In this study, we used S. cerevisiae that expressed a bacterial Rho helicase targeted to the nucleus to investigate whether THO participates in the mRNP QC of aberrant mRNP transcripts. We coupled the Rho-perturbation assay with ChIP-seq to quantify the interactions between THO subunits and chromatin, which resulted in the identification of THO subunit Tho2 as an important component of mRNP QC.
The ChIP-seq analysis of myc-tagged THO subunits showed that in the absence of Rho, Hpr1, Mft1, and Tho2 are increasingly recruited toward the 3′-end of the local transcripts, and become most abundant around the TTSs. This pattern coincides with the phosphorylation profile of the RNA polymerase II CTD during transcriptional elongation (Meinel et al. 2013). Taken together, these results suggest that as the Ser2 residue becomes more phosphorylated, the polymerase is increasingly able to recruit THO to nascent pre-mRNAs (Hu et al. 2014). As a result, THO accumulates at the 3′ ends of transcribed genes (Luna et al. 2019).
In our experiments, the expression of Rho disrupted the homeostatic pattern of THO binding. Rho displaced chromatin-bound Hpr1 and Mft1 but additionally recruited Tho2 and Rrp6 to chromatin independently of RNA polymerase II Ser2 phosphorylation. We hypothesize that the unbound free Tho2 subunit interacts with local transcripts via its nucleic acid-binding CTD once Rho disrupts THO (Hurt et al. 2004). As Rho strips all nascent transcript-bound proteins throughout the entire length of the local transcript (Stuparević et al. 2020), Tho2 can bind anywhere, not only on the local transcript's 3′-end.
We demonstrated that Tho2 plays a role in the recruitment of Rrp6 to chromatin, thereby positioning it in close proximity to aberrant nascent transcripts, which are then likely degraded by Rrp6 alone (Callahan and Butler 2008, 2010) or in cooperation with the nuclear RNA exosome. Other proteins, such as Nrd1, Nab3, and Isw1, that are important for processing and export of ncRNA to the nucleus, are involved in tracing aberrant mRNAs (Babour et al. 2016; Moreau et al. 2019; Singh et al. 2021). Whether Tho2 cooperates with these proteins or functions independently remains unclear.
Our positional ChIP-seq peak analysis indicates that Tho2 and Rrp6 are colocalized in +Rho and the −Rho cells. Thus, our data are consistent with previous studies (Libri et al. 2002; Hieronymus et al. 2004) and raise the intriguing possibility that Tho2 and Rrp6 can assemble into a complex, either directly or via interaction with one or several adaptor proteins. Moreover, it also implies that THO and the nuclear RNA exosome can interact at protein-coding genes as they do at snoRNA-encoding loci (Larochelle et al. 2012). Tho2 can perform these functions by binding Rrp6 directly or by interacting, for example, with Gbp2. THO recruits this protein to pre-mRNAs via Tho2's CTD (Xie et al. 2021), where it monitors splicing and flags aberrantly spliced transcripts for Rrp6-mediated degradation (Hackmann et al. 2014). On the other hand, we have previously shown that Rrp6 is recruited to aberrant local transcripts disrupted by Rho via a process involving TRAMP and Nrd1 (Honorine et al. 2011; Stuparević et al. 2013, 2020; Moreau et al. 2019). Notably, Nrd1 is recruited to chromatin via RNA polymerase II CTD, in both Rho-dependent and Rho-independent experimental systems (Singh et al. 2021). Finally, we find the presence of the Rrp6 peaks under homeostatic, Rho− conditions in the tho2Δ mutant, which suggests that a Tho2-independent Rrp6-recruiting mechanism exists.
In −Rho cells, the mft1Δ strain recruits Rrp6 to three times as many loci as the wild-type strain. We hypothesize that the absence of Mft1 destabilizes THO, which thus dissociates from local transcripts more easily, rendering them aberrant, even in the absence of Rho. Remarkably, such cells would also contain more unbound Tho2, which could recruit Rrp6 onto aberrant transcripts. On the other hand, we noted that mft1Δ +Rho cells recruited Rrp6 to twice as many loci as the wild-type strain. However, this finding may be misleading, as it relies on differential ChIP-seq peak calling. Specifically, the more Rrp6-bound loci exist in −Rho cells, the harder it is to detect statistically significant enrichment of Rrp6 in +Rho cells, especially if the enrichment factor is weak.
We have also shown that the Tho2 CTD mediates the binding of Rrp6 to chromatin (and possibly aberrant local transcripts). Previous studies reported that THO interacts with nucleic acids via this domain. As such, this domain is critical for binding of THO to local transcripts but not for its stability (Peña et al. 2012). From our results, we conclude that partial deletion of the CTD of Tho2 reduces the affinity of Tho2 for nucleic acids, that is, for aberrant local transcripts, which are therefore less likely to be degraded by Rrp6. In summary, our study reveals a novel function of the Tho2 subunit, which is independent of its role during the cotranscriptional loading of the THO complex during elongation on nascent mRNP. Our results provide unprecedented information on the factors and molecular mechanisms that prevent the accumulation of deleterious aberrant mRNP. Further characterization of this cotranscriptional mRNP QC pathway will certainly lead to the discovery of new players and novel events necessary to fine-tune the expression/regulation of specific transcripts according to cell requirements.
MATERIALS AND METHODS
Yeast strains and growth conditions
Saccharomyces cerevisiae strains were derived from the wild-type strain BMA41 (MATa ade2-1 ura3-1 leu2-3,112 his3-11,15 trp1Δ can1-100) (Baudin-Baillieu et al. 1997). Deletions and tagging (Supplemental Table S1) were performed via one-step gene replacement (Wach et al. 1994) and were verified by PCR. Tagged loci were amplified by PCR and Sanger sequenced, and the presence of the tag additionally verified by immunoblotting. The doxycycline-regulated Rho helicase construct (pCM185-RhoNLS, Tet-off, TRP1 centromeric plasmid) was described previously (Mosrin-Huaman et al. 2009).
Saccharomyces cerevisiae was grown in a synthetic complete medium (2% glucose) without tryptophane (−trp) at 25°C, according to standard procedures. The growth was monitored by measuring OD600. Strains carrying pCM185-RhoNLS were grown under repressive conditions (5 µg/mL of doxycycline). The Rho helicase was induced by switching the yeast cells to the −trp medium without doxycycline, at 25°C/16 h.
RNA isolation and northern blotting
Yeast cells were grown with or without Rho induction, and total RNAs were extracted by the hot phenol method (Schmitt et al. 1990) and quantified with a Nanodrop spectrophotometer. Northern blot analysis and hybridization were done as described (Mosrin-Huaman et al. 2009). Briefly, 12 µg of RNA was fractionated on a 1.2% agarose–formaldehyde–MOPS gel, transferred onto a Nylon membrane by capillary blotting in 10× SSC for 12–15 h, and then the RNA was cross-linked to the membrane with a UV cross-linker. RNAs were detected by hybridization with a 5′ end-labeled probe. Hybridization signals were quantified with a Storm 860 PhosphorImager (Molecular Dynamics), and the data were processed with ImageQuant software version 2005.
ChIP, RIP, and ChIP-seq libraries
ChIP was performed as in Moreau et al. (2019). Briefly, samples were cross-linked, lysed with 1.2 mL of FA140 buffer (50 mM HEPES pH 7.5, 140 mM NaCl, 1 mM EDTA, 1% Triton X-100, 0.1% sodium deoxycholate, and 1:100 Protease Inhibitor Cocktail [Promega]), sonicated, and centrifuged (2500g). Twenty microliters of recovered supernatant, containing genomic DNA, were used as an input, and the rest was mixed with anti-c-MYC sc-40X antibody (Santa Cruz Biotechnology). Samples were incubated at 4°C/overnight, mixed with protein G PLUS-agarose beads (Sigma), rotated at 4°C/2 h, washed twice with FA140 lysis buffer, twice with FA360 lysis buffer (FA140 buffer with 360 mM NaCl), once with washing buffer 1 (10 mM Tris-HCl pH 8, 250 mM LiCl, 1 mM EDTA, 0.5% NP-40, 0.5% sodium deoxycholate), once with washing buffer 2 (10 mM Tris-HCl pH 8, 1 mM EDTA, 1% SDS), and once with TE buffer. DNA was eluted with the elution buffer (50 mM Tris-HCl pH 8, 10 mM EDTA, 1% SDS) (twice at 65°C/10 min). Eluates were de-cross-linked (65°C/overnight), digested with proteinase K, and purified on the DNA extraction columns (Thermo Fisher GeneJET PCR Purification Kit). For the RNase sensitivity assay, we omitted the RNasin from the buffer in which sonication was performed onward and added 15 µL of RNase A, T1 Mix (Fermentas) to treated output samples and 15 µL of the appropriate buffer to the control input sample. Immunoprecipitation in output samples was performed as above, but an additional 30 min incubation at 52°C in the presence of 5 µL of RNase mix was added before DNA extraction. For RIP experiments, we used the protocol described in Bretes et al. (2014). Cell lysates were collected and split into two parts, respectively, used for ChIP or RIP. ChIP libraries were prepared with NEBNext Ultra II DNA Library (New England Biolabs), in duplicate, and sequenced using the Illumina ScriptSeq protocol at the I2BC high-throughput sequencing platform (Gif-sur-Yvette).
qPCR and RT-qPCR
DNA was purified with the Qiagen PCR cleanup columns. The immunoprecipitated (IP) DNA (output) was normalized to a 1:200 dilution of input DNA and quantified by qPCR (LightCycler 480, Roche), using primers specific for the PMA1 gene (Supplemental Table S1). After qPCR, values of the IP samples (output) were normalized to the values of the input DNA. Amplifications for each sample were performed in duplicate. The mean values and standard deviations (SDs) were calculated from three independent experiments. For RT-qPCR, RNAs were first purified with the NucleoSpin RNA II kit (Macherey Nagel) and then reverse transcribed with the cDNA Synthesis kit from Thermo Scientific [the kit includes random hexamers and oligo(dT)20] as described in Mosrin-Huaman et al. (2016). Real-time PCR quantifications for ChIP were then performed as described; see above. To measure the level of IZH4, HXT6, and GAC1 mRNA relative to 18 S, the RNA was reverse transcribed as above and processed as described in Mosrin-Huaman et al. (2016).
Data processing
ChIP-seq reads were quality controlled (FastQC 0.11.5), trimmed (Cutadapt 1.15; Martin 2011), and uniquely aligned to S. cerevisiae genome V64.1.1 (downloaded via SGD) with bwa 0.7.17 (bwa mem -T 30 -t 6) (Li and Durbin 2009). Alignment omitted strand specificity, employed user-defined minimal quality, and was assessed with Samtools 1.7 (Li et al. 2009).
The in vivo binding profiles were generated with Deeptools 2.5.3 pipeline (Ramírez et al. 2016). Briefly, for each input and IP replicate, the reads were counted, pooled, and normalized with bamCompare. Read ratios (IP/input) were obtained with bigwigCompare, and profile plots with ComputeMatrix and plotProfile. ChIP-seq analysis was conducted with PePr 1.1.24 (Zhang et al. 2014), which can use differential mode and perform statistical analysis directly on the replicates. We used the differential mode to compare −Rho and +Rho conditions and the native mode to identify protein–DNA interactions. In the differential mode, the only retained regions were those with a P-value <0.05 and matching currently annotated 5752 yeast protein-coding genes (Wilkening et al. 2013; Challal et al. 2018; Villa et al. 2020). The circos and beeswarm plots were generated with R 3.6.2, using the OmicCircos (Hu et al. 2014) and the beeswarm (https://github.com/aroneklund/beeswarm) packages. Snapshots of ChIP-seq peak distributions were visualized with the IGV browser 2.8.10 (Robinson et al. 2011) and custom R scripts.
Statistical analysis
The correlation between biological replicates was calculated with the Spearman correlation test. The log2 enrichment of chromatin IP protein samples (−Rho vs. +Rho) was calculated with the Welch t-test. The statistical difference in the distribution of IP proteins was calculated with the Kolmogorov–Smirnov test implemented in the GenometriCorr package (Favorov et al. 2012).
DATA DEPOSITION
The data supporting the findings of this study are available within the article and its Supplemental Material. Additionally, the accession number for deposited ChIP-seq data at the array express database is E-MTAB-12378. For access, please use the following link: https://www.ebi.ac.uk/biostudies/arrayexpress/studies/E-MTAB-12378?key=ec0c1b92-e71a-40c7-b9cd-b63a4b8b55f2.
SUPPLEMENTAL MATERIAL
Supplemental material is available for this article.
ACKNOWLEDGMENTS
The authors dedicate this manuscript to A. Rachid Rahmouni, who always provided support and encouragement. Moreover, we thank Damir Baranašić for reading and commenting on the manuscript, Mateja Remenarić for discussions during the early steps of this work, Hélène Bénédetti for providing the polyclonal anti-Ylr179c and anti-Tfs1 antibodies, and Domenico Libri for providing the TSS sites used in this study. This work was supported by the Conseil regional du Centre-Val de Loire, recurrent funding from the CNRS to A.R.R., a doctoral fellowship from the Ecole Doctorale Santé, Sciences Biologiques et Chimie du Vivant of the University of Orléans to V.B., and Croatian Science Foundation grant UIP-2017-05-4411 to I.S.
Footnotes
-
Article is online at http://www.rnajournal.org/cgi/doi/10.1261/rna.079707.123.
-
Freely available online through the RNA Open Access option.
- Received May 11, 2023.
- Accepted October 24, 2023.
This article, published in RNA, is available under a Creative Commons License (Attribution-NonCommercial 4.0 International), as described at http://creativecommons.org/licenses/by-nc/4.0/.




