


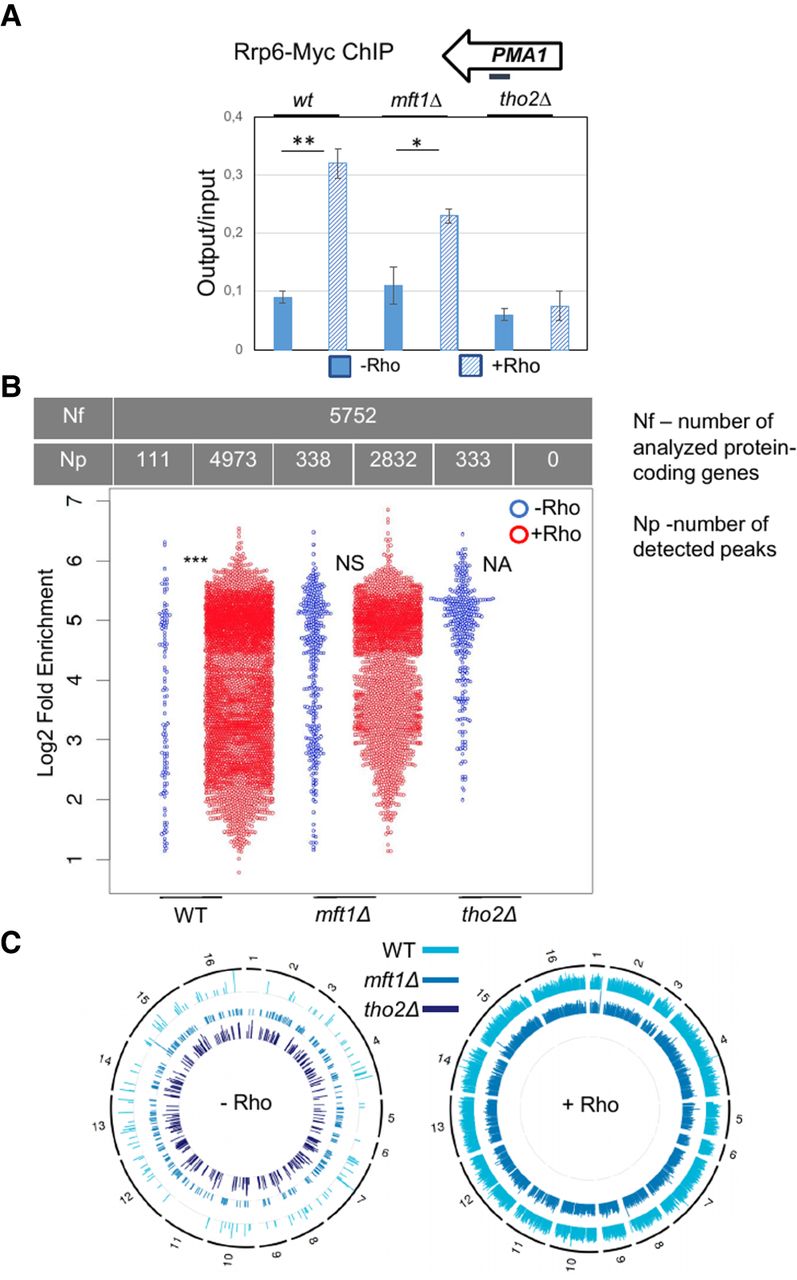
Tho2 recruits Rrp6 to aberrant local transcripts. Assays were performed with wild-type, tho2Δ, and mft1Δ cells, expressing (+Rho) or not expressing (−Rho) Rho. (A) PMA1 ChIP of cells carrying myc-tagged Rrp6. The panel shows the averages of three experiments, with error bars denoting SDs, while asterisks denote the calculated P-value (**) P < 0.01, (*) P < 0.05. The top right inset illustrates the hybridization position of the oligonucleotides used for the qPCR (thick black line; coordinates on chromosome 7: 481431–481656). (B) Beeswarm plot summarizing the log2 fold-enrichment of Rrp6 ChIP-seq peaks. P-values: 0.05 > * > 0.01 > ** > 0.001 > ***, (NA) not applicable, (NS) not significant, (Nf) number of analyzed protein-coding genes, (Np) number of detected peaks. (C) Circos plots showing the genome-wide distribution of Rrp6 ChIP-seq peaks across the protein-coding loci.




