


Nuclear magnetic resonance reveals a two hairpin equilibrium near the 3′-splice site of influenza A segment 7 mRNA that can be shifted by oligonucleotides
- Andrew D. Kauffmann1,2,
- Scott D. Kennedy3,
- Walter N. Moss4,
- Elzbieta Kierzek5,
- Ryszard Kierzek5 and
- Douglas H. Turner1,2
- 1Department of Chemistry, University of Rochester, Rochester, New York 14627, USA
- 2Center for RNA Biology, University of Rochester, Rochester, New York 14627, USA
- 3Department of Biochemistry and Biophysics, University of Rochester School of Medicine and Dentistry, Rochester, New York 14642, USA
- 4Department of Biochemistry, Biophysics, and Molecular Biology, Iowa State University, Ames, Iowa 50011, USA
- 5Institute of Bioorganic Chemistry, Polish Academy of Sciences, 61-704 Poznan, Poland
- Corresponding author: turner{at}chem.rochester.edu
Abstract
Influenza A kills hundreds of thousands of people globally every year and has the potential to generate more severe pandemics. Influenza A's RNA genome and transcriptome provide many potential therapeutic targets. Here, nuclear magnetic resonance (NMR) experiments suggest that one such target could be a hairpin loop of 8 nucleotides in a pseudoknot that sequesters a 3′ splice site in canonical pairs until a conformational change releases it into a dynamic 2 × 2-nt internal loop. NMR experiments reveal that the hairpin loop is dynamic and able to bind oligonucleotides as short as pentamers. A 3D NMR structure of the complex contains 4 and likely 5 bp between pentamer and loop. Moreover, a hairpin sequence was discovered that mimics the equilibrium of the influenza hairpin between its structure in the pseudoknot and upon release of the splice site. Oligonucleotide binding shifts the equilibrium completely to the hairpin secondary structure required for pseudoknot folding. The results suggest this hairpin can be used to screen for compounds that stabilize the pseudoknot and potentially reduce splicing.
Keywords
INTRODUCTION
Influenza A virus (IAV) continues to cause yearly epidemics that typically kill hundreds of thousands of people globally and tens of thousands in the United States (Salomon and Webster 2009; Biggerstaff et al. 2018; Putri et al. 2018). The United States Centers for Disease Control and Prevention scores flu seasons on the basis of visits to outpatient clinics, influenza-associated hospitalizations, and deaths (Biggerstaff et al. 2018). In this century, high severity has been assigned to the 2003–2004, 2014–2015, and 2017–2018 seasons, even though seasonal vaccines are available. Currently, only limited relief is available from small molecule therapeutics such as oseltamivir (Tamiflu), amantadine, and baloxavir marboxil (XOFLUZA) (Min and Subbarao 2010; Sheu et al. 2011; Hayden et al. 2018). All inhibit proteins and are susceptible to the development of resistance (Gubareva et al. 2019; Takashita et al. 2019). Several preclinical studies have tested oligonucleotide approaches that typically use sequences between 15 (Pao et al. 2014) and 42 (Hoy 2018) nucleotides (Lenartowicz et al. 2016; Michalak et al. 2019; Dhuri et al. 2020; Szabat et al. 2020). On the basis of NMR structural studies of small model hairpins, we suggest the possibility that short oligonucleotides or small molecules could be used to shift an RNA dynamic equilibrium to inhibit splicing and viral propagation.
Bioinformatics studies on IAV revealed several areas of evolutionarily conserved RNA secondary structures (Gultyaev et al. 2007; Ilyinskii et al. 2009; Moss et al. 2011; Moss and Steitz 2015; Soszynska-Jozwiak et al. 2015; Kobayashi et al. 2016). Because these structures have been preserved during evolution, it is likely that they accomplish a function beneficial for viral viability, thus making them attractive therapeutic targets. RNA structure can have a role in regulating splicing (Warf and Berglund 2010). One of the conserved regions contains the 3′ splice site of IAV segment 7 mRNA (Moss et al. 2011). This sequence is predicted to exist in a structural equilibrium between a pseudoknot and a long hairpin (Fig. 1A). NMR spectra show that in the hairpin stem (S7HP in Fig. 1A), the splice site is exposed in a dynamic internal loop (Chen et al. 2015). Within the predicted pseudoknot, however, the splice site is sequestered in a helix (S7PK in Fig. 1A). Chemical mapping and gel shift assays in solution confirmed the equilibrium between two conformations and showed that this equilibrium is affected by Mg2+ and [Co(NH3)6]3+ concentration (Moss et al. 2012). If conservative rules for interpreting DMS mapping are used (Mathews et al. 2004), then DMS mapping in cell culture (Simon et al. 2019) is consistent with the presence of predicted structures, assuming that the GU and three AU pairs at the 3′ termini (Fig. 1A) are dynamic. A mutational study showed that disrupting this structural equilibrium to favor retainment of the splice site in a helix increased production of unspliced mRNA and decreased viral viability in cell culture (Jiang et al. 2016). We speculate that the structural equilibrium could provide an on/off switch for regulating splicing.
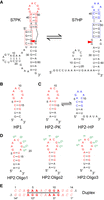
(A) Conserved region of influenza A segment 7 mRNA showing the 3′ splice site (red triangle) in two secondary structures predicted from sequence comparison (Table 1): a pseudoknot with hidden splice site (S7PK) and a long hairpin with exposed splice site (S7HP). Colored nucleotides are included in model hairpins shown in B–D. Colored boxes correlate with colors highlighting base pairs in Table 1. (B,C) Two 19-nt hairpins, HP1 and HP2, used for NMR studies. HP1 (B) and HP2 (C) shown in two hairpin loop conformations corresponding to those predicted in pseudoknot (HP2-PK) and hairpin (HP2-HP) of segment 7 mRNA. (D) HP2 with Oligonucleotides 1, 2, and 3 designed to target the loop as shown. The 5′ end of each oligonucleotide is assigned number 20. In the oligonucleotide residue names, “L” is LNA, “m” is 2′-O-methyl in the sugar, and “5m” is 5-methyl in the base. TL is thymidine LNA. (E) Self-complementary duplex with 8 × 8-nt internal loop formed by 5′CCAGAAACGGAUGGA at 100 mM K+ (Kauffmann et al. 2017).
Because the protein products and temporal expression of unspliced (M1) and spliced (M2) segment 7 mRNA are essential to the virus (Martin and Helenius 1991; Pinto et al. 1992; Holsinger et al. 1994; Shih et al. 1995; Pielak and Chou 2011), the proposed conformational on/off switch for splicing poses a potentially attractive target for therapeutics. Although most therapeutics target proteins, RNA is increasingly investigated as a drug target (Angelbello et al. 2018; Warner et al. 2018; Bennett et al. 2019; Meyer et al. 2020; Sreeramulu et al. 2021), including at splice sites (Dominski and Kole 1993; Goemans et al. 2011; Voit et al. 2014) and pseudoknots (Rangan et al. 2021; Sreeramulu et al. 2021). Significantly, even short hairpins appear to be promising targets for therapeutics (Davila-Calderon et al. 2020; Haniff et al. 2020; Lulla et al. 2021). Oligonucleotide-based therapeutics can be easily designed to target a specific RNA sequence due to base-pairing properties of nucleic acids (Watt et al. 2020).
Herein, we present NMR studies of two 19-nt hairpins (Fig. 1), 5′GUCCAGAAACGGAUGGACA (HP1) and 5′AUCCAGAAACGGAUGGAUA (HP2), derived from the consensus sequence of IAV segment 7 mRNA nucleotides 720–733 (Moss et al. 2011). To increase folding stability, 2 bp were added to the wild-type sequence, a UA in both hairpins and a GC in HP1 and an AU in HP2. NMR spectra of HP1 reveal a dynamic 8-nt hairpin loop. Similar to the natural sequence, HP2 is in equilibrium between two secondary structures. Three oligonucleotides complementary to the 8-nt hairpin loop of S7PK (Fig. 1A) shift this equilibrium to the base-pairing expected to stabilize the 8-nt hairpin of the native pseudoknot, as modeled by HP2-PK (Fig. 1C). Thus, HP2 could provide a simple target to screen for compounds that could stabilize the pseudoknot. Such compounds could be used to test the pseudoknot/hairpin hypothesis for splicing regulation and potentially provide lead therapeutics.
RESULTS
Sequence design and buffer conditions
The pseudoknot/hairpin splicing hypothesis was originally generated from sequence comparisons of base-pairing and predicted thermodynamic stabilities for roughly 500 IAV sequences (Moss et al. 2011). Sequence comparisons of base-pairing (Tables 1, 2; Figs. 1, 2) were extended to over 22,000 sequences from the influenza virus resource at the National Center for Biotechnology Information (Bao et al. 2008). Except for the C39–G48 base pair in the S7HP hairpin stem, all other base pair positions in S7PK and S7HP secondary structures (Table 1; Figs. 1, 2) are conserved with canonical pairs in more than 89% of sequences. This includes the C39–G52 base pair in S7PK. The C39–G48 base pair in S7HP is CG, CA, UA, and UG, respectively, in 41%, 31%, 23%, and 5% of sequences. These mutations likely allow similar 2 and 3D structures, but with a variety of possibilities for the bulged nucleotide. A49 is 100% conserved and not canonically base-paired in the S7HP secondary structures shown in Figures 1 and 2 (Chen et al. 2015). However, A49 is able to form a G42A49 pair in S7PK (Table 2; Figs. 1, 2). On the basis of base fractions in Table 2, G22A7 and/or G63A25 are also able to form GA pairs. GA pairs capping helixes are common in RNA (Elgavish et al. 2001) and are thermodynamically stabilizing (Sugimoto et al. 1987).
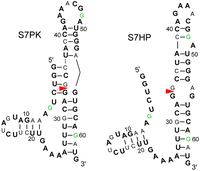
Graphic presentation of data in Tables 1 and 2. With the exception of G48, nucleotides represented as bold black, regular black, or green, have cut off fractions of a shown base of >0.965, >0.70, and >0.50, respectively (Table 2). A or G not bolded usually have a minor fraction of G or A (Table 2). C or U not bolded usually have a minor fraction of U or C (Table 2). Nucleotide 48 is 54% A and 46% G. It is represented as G because the 39–48 bp in S7HP has fractional occurrences of 0.41 CG, 0.31 CA, 0.23 UA, and 0.05 UG (Table 1). Moreover, G has been used in model hairpins (Fig. 1) to increase oligonucleotide binding and provide possible formation of a G48A43 pair in S7PK in HP1. On the basis of nucleotide fractions in Table 2, G22A7, G42A49, and/or G63A25 pairs could cap helixes. Such GA caps are prevalent in known RNA secondary structures (Elgavish et al. 2001). Terminal GA nearest neighbors are also thermodynamically stable (Sugimoto et al. 1987).
Base pair (i–j) counts for S7PK and S7HPa,b
Nucleotide fractions for S7PK and S7HP
To study the hairpin, a common natural sequence, CCAGAAACGGAUGGA, was originally used with the 3′ dangling A for added stability. However, in buffer containing 80 mM KCl, 20 mM potassium phosphate, and 0.05 mM Na2EDTA (pH 6.2), the natural sequence forms a self-complementary duplex consisting of an 8 × 8-nt internal loop (Kauffmann et al. 2017). Duplex was the majority stoichiometry even at 15 µM RNA. Screening of various sequences and conditions led to discovery that HP1 and HP2 (Fig. 1B,C) form only hairpins in, respectively, 2.0 and 10.0 mM potassium phosphate with 0.05 mM Na2EDTA (pH 6.2). Both have a longer stem to stabilize the hairpin in low salt.
HP1 forms a hairpin with a dynamic loop
One-dimensional imino proton spectra at both 1.5 mM and 35 µM RNA along with 2D NOESY spectra at 1.5 mM RNA (Fig. 3; Supplemental Figs. S1, S2) show that HP1 has the secondary structure in Figure 1B. Although the hairpin forms a stable, singular secondary structure, the 8-nt hairpin loop is dynamic. This differs from the self-complementary duplex, (5′CCAGAAACGGAUGGA)2, at 100 mM K+ (Fig. 1E; Kauffmann et al. 2017). The underlined internal loop of the duplex has two copies of the same loop sequence as HP1, but forms two stable 3RRs motifs (Lerman et al. 2011) with each containing three sheared GA (trans Hoogsteen/sugar edge) pairs (Kauffmann et al. 2017). Despite the dynamics, NMR spectra provide insight into features of the HP1 loop.
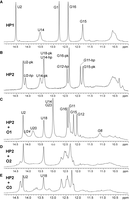
1D imino proton spectra at 1°C of 1.5 mM HP1 (A), 0.5 mM HP2 (B), 0.5 mM HP2 + Oligo1 (C), 0.5 mM HP2 + Oligo2 (D), and 0.5 mM HP2 + Oligo3 (E). Sharp peak at 10.35 ppm in B is likely due to G6 in GAAA tetraloop of HP2-HP (Chen et al. 2015). Buffers are 0.05 mM Na2EDTA (pH 6.2) with 2 mM potassium phosphate for HP1 and 10 mM potassium phosphate for solutions with HP2.
In HP1, nucleobases A7, A8, and A13 are intrahelical, but do not form stable GA pairs
Table 3 contains comparisons of NOE distances and chemical shifts for HP1 and the duplex. Clearly, the loop conformations are quite different. For example, the A13P chemical shift of −2.6 ppm for HP1 is slightly downfield from the HP1 and duplex average range of −4.0 ppm ± 0.4 ppm. In contrast, the equivalent shift of A11/11*P in the duplex is 0.2 ppm due to the distorted backbone between adjacent sheared GA pairs. The shift of 4.6 ppm for G11H2′ in HP1 is within the HP1 and duplex average range of 4.5 ppm ± 0.2 ppm. In contrast, the equivalent shift for G9/9* in the duplex is 3.4 ppm due to positioning over the ring of G10/10* (Kauffmann et al. 2017). Additionally, the imino proton resonances in HP1 for G6, G11, and G12 are very broad and have no detectable cross-peaks (Fig. 3A; Supplemental Fig. S1), which is in contrast to spectra for duplex (Kauffmann et al. 2017). Although the data do not eliminate the possibility of GA pairs, they do suggest that if sheared GAs form they are likely transient and allow exchange of the loop G imino protons with water. Evidently, the HP1 hairpin loop populates an ensemble of conformations. Nevertheless, the NOEs (Table 3) place A7, A8, and A13 of HP1 inside the loop. The A8H2 to G11H2′ NOE of 3.2 Å implies that the backbone makes a 180° turn between A8 and G11.
The chemical shift and NOE data suggest possible similarities in addition to the differences described above between HP1 and the 3RRs motif in the duplex. The A13P and U14H1′ chemical shifts in HP1 are the only 31P and H1′ that are shifted in the same direction as the unique 31P and H1′ in the equivalent residues of duplex (A11/11* and U12/12*, respectively) (see Table 3; Supplemental Table S1; Supplemental Fig. S3). These shifts suggest that A13 and U14 in HP1 may spend time in a sheared GA/Watson–Crick AU conformation similar to A11/11* and U12/12* in duplex. As described below, G6 is primarily anti relative to its ribose, and its ribose has primarily C3′-endo pucker. Both characteristics are also consistent with partial pairing to A13.
In the HP1 loop, G11 and G12 spend roughly half their time in the syn glycosidic torsion conformation
NMR provides additional evidence for a dynamic HP1 loop. The 13C8 chemical shifts of G11 and G12 (139.81 and 140.14 ppm, respectively) are ∼3 ppm downfield compared with other guanosine residues in HP1 and duplex at 137.1 ppm ± 1.0 ppm (Table 3). A downfield shift of 13C8 is predicted and observed in syn guanosine residues. Additionally, for G11 and G12, NOE distances between H8 and its own H1′ (2.9 and 2.8 Å, respectively) (Table 3) are shorter than expected for the anti conformation (3.5 Å ± 0.1 Å in stem of HP1), but longer than expected for pure syn residues (2.5 Å ± 0.1 Å). This chemical shift and NOE data suggest that close to 50% of G11 and G12 residues are in the syn conformation. G6 appears to be primarily anti, based on a 13C8 chemical shift of 138.01 ppm (Supplemental Table S1) and G6H8-H1′ NOE distance of 3.30 Å (Table 3).
A7 to A13 ribose groups in HP1 are dynamic
A TOCSY spectrum (Fig. 4) reveals that sugars for G6 to G12 in the HP1 loop are dynamic with at least partial C2′-endo ribose pucker. In a 400 msec mixing time NOESY spectrum, H1′–H2′ cross-peaks showed scalar-couplings measured from peak splitting to range between 3.0 Hz for G6, A7, A8, and 6.1 Hz for C10 (Fig. 4). The 3.0 and 6.1 Hz splittings, respectively, suggest preferences for C3′-endo and C2′-endo ribose puckers. Additionally, these seven residues had C1′ upfield chemical shifts compared with the other residues (Supplemental Table S1). The TOCSY spectrum had almost no H1′–H2′ cross-peak for A13, consistent with C3′-endo ribose pucker. The A13H1′ peak is broad, however, which may be a result of small H1′–H2′ coupling or conformational dynamics, or both.
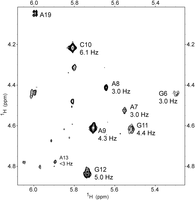
NMR 2D TOCSY spectrum of 3 mM HP1 at 25°C with mixing time of 29 msec in D2O. H1′–H2′ cross-peaks are labeled with corresponding residue. The magnitude of the H1′–H2′ scalar-coupling constant (3J) determined from splitting of H1′ peaks in a 400 msec mixing time NOESY spectrum is given below the residue identifier. Coupling accuracy is approximately ±0.5 Hz.
HP2 has two secondary structures in equilibrium
The 1D NMR spectrum of HP2 at 1°C has eight definite imino proton resonances consistent with Watson–Crick pairs (Fig. 3B). Two-dimensional NMR spectra reveal two secondary structures in slow exchange as indicated by large exchange cross-peaks near the diagonal in the aromatic region of the TOCSY spectrum (Fig. 5). The two secondary structures were determined to be HP2-PK and HP2-HP (Fig. 1C). Based on relative intensities of corresponding imino proton resonances in two samples at 1°C, roughly 64 ± 8% of the RNA folds into HP2-PK, with the rest forming HP2-HP. Thermodynamic parameters for 1 M NaCl (Turner and Mathews 2010) in the RNAstructure program (Mathews 2014) predict the equilibrium, though with a higher fraction of HP2-PK. Higher salt is expected to favor the structure with higher charge density (Manning 1978), and stabilization by more than one 3′-terminal dangling end is not included in the thermodynamic model.
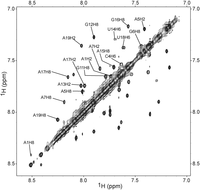
Aromatic region near the diagonal of a 2D TOCSY spectrum of 2.0 mM HP2 showing direct exchange cross-peaks between two conformations, HP2-PK and HP2-HP. Temperature is 20°C and mixing time is 29 msec. Assignment of each chemical shift to HP2-PK or HP2-HP is available in Supplemental Table S2.
Comparison of chemical shifts between HP2-PK and HP1 indicate that 3D structures of these hairpin loops are very similar (Fig. 6A; Supplemental Tables S1, S2). The average chemical shift deviation between HP2-PK and HP1 residues 5–14 is 0.010 ppm (|Δδ|avg of H1′, H6/8, and H2/5). Chemical shifts (Supplemental Table S2) also indicate the 3D structures of HP2-HP and the 5′-CAGAAACG hairpin loop (Chen et al. 2015) of S7HP (Figs. 1B, 2) are similar. Between HP2-HP residues 4–11 and the 5′CAGAAACG hairpin loop of S7HP (Chen et al. 2015), the average deviation is 0.02 ppm (Fig. 6B). In contrast, chemical shifts between equivalent residues of the hairpin loop of HP2-PK and the 5′AGAAAC hairpin loop of S7HP (Chen et al. 2015) and between equivalent residues of HP2-HP and HP1 differ by 0.13 ppm and 0.24 ppm, respectively (Fig. 6).
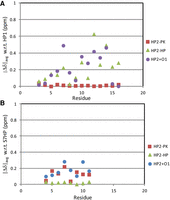
Average of absolute values of H1′, H8/6, and H2/5 chemical shift differences (|Δδ|avg) of HP2-PK, HP2-HP, and HP2 + Oligo1 compared with HP1 (A) and S7HP (B) (Chen et al. 2015).
On the basis of chemical shift similarities, the 5′AUC/3′UAG base-pairings in the stems of HP2-PK and HP2-HP have similar 3D structures even though the loops are different (|Δδ|avg is 0.064 ppm) (Supplemental Table S2). Evidently, the slippage of base-pairing retains the same 3D shape of the helix because sequences of the first four stem base pairs are the same even though the pairing partners on the 3′ side change (Fig. 1C). Further evidence of slippage comes from NOE data for HP2-HP showing a cross-peak between A1H2 and G15H1′, but no detectable cross-peak between A1H2 and A19H1′. Conversely, for HP2-PK there is a medium NOE cross-peak between A1H2 and A19H1′. Overlaps in HP2-PK, however, prevent assessment of a potential cross-peak between A1H2 and G15H1′.
Two copies of 5′GGA in the natural S7PK/S7HP sequence (Fig. 1A) allow the slippage observed between HP2-PK and HP2-HP (Fig. 1C). In S7PK, the G51–C40 pair is present in 100% of sequences, and G52 forms a CG or UG pair with nucleotide 39 in 72% and 28% of sequences, respectively (Table 1). For S7HP, G47 forms a CG pair with C40 in 100% of sequences, and nucleotide 48 can form a canonical pair with nucleotide 39% in 69% of sequences. The remaining 31% of sequences can have a C39–A48 pair (Table 1). The sequence variation of nucleotides 39 and 48 suggests there may be an interesting and variable 3D structure adjacent to the S7HP hairpin loop.
The IAV segment 7 splice site is restrained as part of two canonical pairs when in the S7PK pseudoknot (Fig 1A). In contrast, the splice site is in a dynamic internal loop (Chen et al. 2015) when part of the S7HP secondary structure (Fig. 1A). This difference suggests that splicing could be inhibited with compounds stabilizing the hairpin loop of HP2-PK relative to that of HP2-HP. Reducing splicing can decrease virus viability (Jiang et al. 2016). HP2 mimics the equilibrium of a hairpin that rearranges by sliding 3 bp between the S7PK and S7HP conformations (Fig. 1A,C). Thus, HP2 could serve as a target for screening compounds able to test this model and potentially provide lead compounds for therapeutics.
Oligonucleotides targeted to HP2-PK shift the equilibrium of HP2
Titrations monitored with 1D imino proton NMR spectra were used to test whether the binding of short oligonucleotides will shift the equilibrium of HP2. Three oligonucleotides (green in Fig. 1D) were used for these experiments: 5′Um(5mCL)CmGLUm (Oligo 1), 5′Cm(5mCL)Gm(TL)Um (Oligo 2), and 5′Cm(5mCL)Gm(TL)UmUm (Oligo 3). Here, superscripts m and L, respectively, following a nucleotide denote 2′O-methyl and LNA sugars; 5mCL denotes a 5-methyl C LNA.
At 20°C, each oligonucleotide binds to 0.50 mM HP2 in a 1:1 stoichiometry (Fig. 7). Assignment of imino protons in the NMR spectrum of the HP2:Oligo1 complex (Fig. 3C) were made by connection of Watson–Crick pairs (Fig. 8) to the backbone walk in 2D NOESY spectra. Pairs identified in the stem (A1–U18, U2–A17, C3–G16, C4–G15, and A5–U14) indicate that Oligo1 shifted the HP2 equilibrium completely to HP2-PK. This is further supported by long-range NOEs such as A1H2–A19H1′, A17H2–C3H1′, and A5H2–G15H1′ that would be absent if binding was only to HP2-HP (Supplemental Table S4). NOEs expected if binding was partially to HP2-HP are not observed. Moreover, chemical shifts of U2H3 and U18H3 are unchanged in HP2:Oligo1 relative to their shifts in HP2-PK, consistent with being furthest from the site of oligonucleotide binding. One-dimensional imino proton spectra of HP2 complexed with Oligo2 or Oligo3 (Fig. 3D,E, respectively) contain peaks at these same two spectral positions (14.2 and 13.4 ppm). Assignment of these two peaks to pairs U2–A17 and U18–A1 were confirmed with 2D NOESY spectra of HP2:Oligo3. These observations suggest that Oligo2 and Oligo3 also shift the equilibrium completely to HP2-PK.
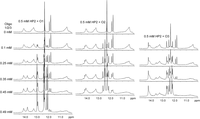
NMR spectra of imino protons in 0.5 mM HP2 (10 mM potassium phosphate, 0.05 mM Na2EDTA at pH 6.2) with indicated additions of Oligo1 (O1), Oligo2 (O2), or Oligo3 (O3) at 20°C.
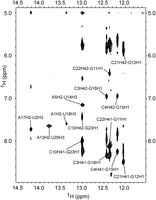
NMR 2D NOESY spectrum of 0.5 mM HP2:Oligo1 in 10 mM potassium phosphate and 0.05 mM Na2EDTA (pH 6.2) with mixing time of 150 msec at 1°C in 95% H2O/5% D2O.
The titrations at 20°C in Figure 7 show continuous reduction to minimal area for resonances near 12 ppm upon addition of oligonucleotides to roughly the same concentration as HP2. This is consistent with 1:1 stoichiometry of binding and Kd < 0.5 mM in 10 mM potassium phosphate (pH 6.2). Presumably, Kd would be tighter at a higher salt concentration. Measurements at higher salt would require designing a construct able to form hairpin but not duplex, for example, by covalently connecting the 5′ and 3′ termini.
Oligo1 forms at least 4 bp with the loop of HP2-PK
The HP2:Oligo1 complex (Fig. 1D) was further studied by NMR. Spectra confirmed that Oligo1 forms four Watson–Crick pairs with C10 to A13 and that the HP2-PK stem base pairs are stable (Figs, 3C, 8). A peak at 14.13 ppm in the 1D spectrum yields no 2D NOESY cross-peaks to identify it, but this chemical shift is typical of U imino protons in Watson–Crick pairs. It is likely that this peak is due to Um24 of Oligo1 forming a pair with A9. A very small NOESY cross-peak between A9H2 and Um24H1′ provides further support for the presence of this pair. It is possible the A9–Um24 pair forms only transiently.
The A13–Um20 pair at the 5′ end of Oligo1 may also be less stable than others as evidenced by the broad Um20H3 resonance (Fig. 3C) and missing assignments for Um20H5 and H6 (Supplemental Table S3). Nevertheless, the formation of the HP2-PK:Oligo1 complex rigidifies most of the HP2-PK loop nucleotides. In particular, the J(H1′–H2′) couplings of residues 8 through 12 disappear, indicating the ribose groups are held in C3′-endo conformation. Further, G11 and G12 no longer display partial syn character. In general, the base pair helix between HP2 and Oligo1 is rigid. In contrast, on the other side of the loop, G6 and A7 exhibit dynamic behavior with J(H1′–H2′) couplings of ∼3 and 2.5 Hz, respectively, and slight syn character of G6 suggested by H8–H1′ distance of 3.15 Å (Supplemental Table S4).
3D modeling of the HP2:Oligo1 complex and similarities to GAAA tetraloops
Restraints derived from NMR data were used to model the HP2:Oligo1 complex. A representative model from the resulting ensemble is shown in Figure 9. A Watson–Crick pair between A9 and Um24 was assumed, based on assignment of the imino proton peak at 14.13 ppm as Um24. Positions of residues G6 and A7 are highly variable near the major groove of the base pairs formed with Oligo1. In particular, G6 is found in at least three different hydrogen-bonded arrangements with three different bases, or extruded near the oligonucleotide backbone. Some of the extruded G6 conformations include a syn G6. The backbone makes a sharp turn between A7 and A8, consistent with the A8P chemical shift that is different from the other residues (−2.7 ppm vs. average of −3.8 ppm ± 0.2 ppm for nine unmodified, assigned residues in the complex; Supplemental Table S3). A turn between A7 and A8 is consistent with an A9–Um24 base pair being part of a continuous 5-bp helix with the oligonucleotide shifting the turn from between A8 and G11 in the unbound loop. The shifted turn is further supported by the absence of the A8H2–G11H2′ NOE observed in the unbound loop.
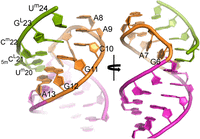
Representative NMR model of HP2:Oligo1. Views include HP2 stem (magenta; residues 1–5 and 14–19), loop (amber; residues 6–13), and Oligo1 (green; residues 20–24).
The sharp turn between A7 and A8 and stacking of A8, A9, and C10 form a loop (AAAC) that is reminiscent of a GAAA tetraloop (Legault and Pardi 1994; Wu et al. 2012; Chen et al. 2015). In GAAA tetraloops, the 31P chemical shift at the GA turn is also downfield relative to shifts in A-form helices, although the difference is ∼2 ppm in GAAA tetraloops (Legault and Pardi 1994; Chen et al. 2015) but ∼1 ppm in the HP2:Oligo1 complex. This could be due to a dynamic A7 as suggested above. Stacking of A8, A9, and C10 is similar to that of AAA in GAAA tetraloops. That stacking is largely retained even in simulations with A9–Um24 hydrogen-bond restraints removed and Um24 extruded.
Two MD simulations of HP2:Oligo1 at 298 K were carried out for 0.5 µsec each in explicit solvent without restraints in an attempt to identify stable or transient conformations that might be hidden by NMR restraints that represent the average of multiple conformations. Two starting structures were selected from the restrained calculations described above. The short simulations suggest the C10 G11 G12 A13 / Um20 5mCL21 Cm22 GL23 base pairs in Figure 1D are stable, but the A9–Um24 cis Watson–Crick/Watson–Crick pair is transitory. It was present only in 47% of frames. Occurrences of Um24 in other base pairs include A8–Um24 in a cis WC/Hoogsteen pair (24%), A9–Um24 in a trans WC/Hoogsteen pair (16%), and A8–Um24 rarely in a cis WC/WC pair. Unlike the A9–Um24 cis WC/WC pair, none of these alternate base pairs satisfy all the NOE restraints. They may occur, but they cannot be dominant conformations. Residues A8, A9, and Um24 are in various extruded or otherwise unpaired conformations in 11% of the frames.
In unrestrained simulations, G6 and A7 primarily remain stacked together, but oriented perpendicular to other bases in the duplexed strands, much as in the NMR restrained models. The position of A7, however, is significantly different between unrestrained and restrained simulations. NOE cross-peaks between A7 and C10 (A7H2–C10H5, A7H2–C10 amino, A7H1′–C10 amino) indicate A7 and C10 bases are in close proximity. In contrast, unrestrained simulations exhibit a large population of conformations where A7 does not interact with the helix formed by Oligo1. Nonetheless, the unrestrained simulations predict that the NOE-derived distance for A7H2 to C10H5, for instance, is 4.0 Å, which is within the maximum allowed distance of 4.5 Å in the NMR-restrained calculation. The possibility of a large population of extra-helical A7 residues cannot be excluded.
DISCUSSION
RNAs are increasingly becoming targets for therapeutics (Dominski and Kole 1993; Goemans et al. 2011; Voit et al. 2014; Disney and Angelbello 2016; Angelbello et al. 2018; Warner et al. 2018; Meyer et al. 2020) and splice sites are particularly promising targets (Dominski and Kole 1993; Garcia-Blanco et al. 2004; Douglas and Wood 2011; Kole et al. 2012; Singh and Cooper 2012; Pao et al. 2014). Discovery that a splice site in IAV is encased in a sequence that can be in equilibrium between a pseudoknot and a long hairpin (Figs. 1A, 2) suggests that perturbation of that equilibrium could be a therapeutic strategy. The pseudoknot structure sequesters the splice site in a canonical helix, presumably inhibiting splicing. In contrast, the hairpin structure exposes the splice site in a dynamic 2 × 2-nt internal loop (Moss et al. 2011, 2012; Chen et al. 2015). A key difference between the pseudoknot and long hairpin is folding of the red and blue sequences at the top of Figure 1A. The model HP2 sequence (Fig. 1C) studied here reproduces the equilibrium for that part of the natural sequence. Thus, it provides a model system that can be used to screen for molecules able to perturb the equilibrium between pseudoknot and long hairpin.
Oligonucleotides provide a relatively easy way to predict compositions able to bind RNA because rules for Watson–Crick pairing (Watson and Crick 1953) and for estimating thermodynamic stability of RNA complexes are known (Xia et al. 1998; Kierzek et al. 2005, 2006; Chen et al. 2012). These simple design principles provide a rapid approach to overcome resistance due to natural sequence mutations. Moreover, when regulation requires slippage of several base pairs as in Figures 1A and 2, evolution of resistance may take longer because concerted mutations are required. NMR spectra presented here confirm the ease of design for perturbing an RNA equilibrium. All three oligonucleotides shift the equilibrium to a single secondary structure (Fig. 3C–E). Imino proton NMR spectra of 5′Um(5mCL)Cm(GL)Um bound to HP2 indicate that at least 4 and probably 5 bp contribute to the binding. NMR restrained 3D models (Fig. 9) and unrestrained MD simulations support this base-pairing model. The NMR-derived models suggest that while 3 of the 8 nt in the loop of HP2:Oligo1 are not involved in pairs (Fig. 1D), A8 is well positioned to form a pair if an additional residue were present at the 3′ end of Oligo1. Thus, it appears that just two unpaired nucleotides in the loop are enough to accommodate the junction between stem and loop/oligo duplex.
Currently, FDA–approved oligonucleotides targeting mRNA are relatively long, typically containing >15 nt (Pao et al. 2014) and as many as 42 nt (Hoy 2018; Dhuri et al. 2020). They often rely on cleavage of an mRNA (Crooke et al. 2018). Such long oligonucleotides run the risk of lacking specificity due to binding strongly to sequences that are not perfect matches (Herschlag 1991). In principle, shorter oligonucleotide therapeutics could act by directing misfolding to an inactive structure (Childs et al. 2002, 2003). With that strategy, specificity can be achieved because it depends on the structure and function of the target in addition to sequence. For example, in vitro splicing can be inhibited with an 8-mer oligonucleotide that directs misfolding of a pseudoknot containing a splice site (Childs et al. 2002). The results presented here suggest that in some cases an opposite strategy of stabilizing a correctly folded intermediate structure may also be viable and that a short oligonucleotide may be sufficient. Short oligonucleotides also offer advantages in ease of design, testing of modifications, and cost of synthesis.
NMR titrations presented in Figure 7 indicate that almost complete binding is achieved at 20°C when both RNA hairpin and 5′Um(5mCL)Cm(GL)Um are at 0.5 mM. Additional modifications can further enhance binding of short oligonucleotides to RNA. For example, replacing a U–A pair inside a helix with a pseudoU–A pair can increase stability by 0.3–2.7 kcal/mol at 37°C (Hudson et al. 2013; Kierzek et al. 2014). Moreover, N1-methylpseudoU can increase cellular lifetime of RNA (Mauger et al. 2019). Modification by propynylation at C5 of pyrimidines enhances binding of DNA to DNA and to RNA (Wagner et al. 1996; Barnes and Turner 2001a,b; He and Seela 2002). In principle, the oligonucleotide could be extended to allow formation of base triples with the hairpin stem (Gupta et al. 2012; Zengeya et al. 2012; Ong et al. 2019). Thus, the structural data identify a model system for screening or designing small compounds that could affect splicing in IAV and also suggest that short, modified oligonucleotides are one possible modality. Other modalities can also specifically bind RNA loops (Shortridge and Varani 2015; Disney 2019) with binding constants required for therapeutics. For high-throughput screening at low concentration of RNA where duplex would not form, HP2 could be modified by adding a fluorophore and quencher FRET pair (Forster 1949; Stryer and Haugland 1967; Clegg 1992; Roy et al. 2008) at the 5′ and 3′ ends. Stabilization of the 8-nt hairpin loop relative to the 6-nt hairpin loop (Fig. 1) would then be detected by reduced fluorescence upon addition of a binder. This would allow measurements at 37°C and physiological salt concentrations. It is also likely that similar approaches could be applied to other RNA switches, especially ones requiring unfolding of a pseudoknot.
MATERIALS AND METHODS
Oligonucleotide synthesis
Desalted and 2′ deprotected RNA hairpins, HP1 (5′ GUCCAGAAACGGAUGGACA 3′) and HP2 (5′ AUCCAGAAACGGAUGGAUA 3′), were ordered from Dharmacon on a 5.0 μmol scale. No additional purification was necessary before suspending them in buffers for NMR.
Modified oligonucleotides were synthesized on a BioAutomation MerMade12 DNA/RNA synthesizer using β-cyanoethyl phosphoramidite chemistry and commercially available phosphoramidites (ChemGenes, GenePharma). For deprotection, oligoribonucleotides were treated with a mixture of 30% aqueous ammonia for 16 h at 55°C. Deprotected oligonucleotides were purified by silica gel thin-layer chromatography (TLC) in 1-propanol/aqueous ammonia/water (55/35/10 [v/v/v]) as described previously (Kierzek and Kierzek 2003).
NMR spectroscopy and assignment
Buffers for NMR samples were 2.0 mM (HP1) or 10 mM (HP2) potassium phosphate and 0.05 mM Na2EDTA (pH 6.2). Spectra were collected with a Varian Inova 600 MHz spectrometer. One-dimensional imino proton spectra were collected at 1°C and 20°C using a 1-1-spin-echo water suppression pulse (Sklenar and Bax 1987). Two-dimensional (2D) NOESY spectra in 95% H2O/5% D2O were collected using a WATERGATE pulse (Piotto et al. 1992; Grzesiek and Bax 1993) with flipback for water suppression at 1°C and 20°C and mixing times of 100 and 400 msec.
One-dimensional spectra of nonexchangeable protons were collected in D2O at 20°C. Assignment of nonexchangeable protons was achieved with 2D NOESY (75-, 175-, and 400-msec mixing times, except HP1 with just 175 and 400 msec), TOCSY (32-msec mixing time), natural abundance 13C–1H sensitivity enhanced HSQC, and 31P–1H HETCOR spectra.
Spectra from 2D NMR were processed, assigned, and integrated with NMRpipe (Delaglio et al. 1995) and NMRFAM-SPARKY (Lee et al. 2015) as described (Kauffmann et al. 2017). Imino proton assignments were made by cross-peaks to cytosine H5 and H6 for GC pairs and to adenine H2 for AU pairs.
Restraint generation
Distances between nonexchangeable protons were obtained from spectra at 20°C and 75 msec (HP2:Oligo1) or 175 msec (HP1) mixing time as similarly reported (Kauffmann et al. 2017). NOE cross-peak volumes were (1/r)6 scaled assuming 2.71 Å for H1′–H2′ cross-peak volumes of A1, G15, and U18 and 3.2 Å for H1′–H4′ of A1 and G15. Upper and lower bounds for distance restraints were calculated allowing a fourfold error in NOE volume measurements. For exchangeable protons, lower bounds were set to 2.0 Å, and upper bounds were set to 4.5, 5.0, or 6.0 Å, respectively, for large, medium, or small NOE volumes. Hydrogen bond restraints were applied between bases where NOEs indicated cis Watson–Crick base pairs.
Dihedral angles for Watson–Crick stems were restrained to typical A-form values, as described (Kauffmann et al. 2017). Based on the size of intraresidue H8/H6–H1′ NOE cross-peaks being consistent with χ in an anti conformation, χ was restrained to −255° ± 85° in all residues except G11 and G12 in HP1, and G6 in HP2:Oligo1. In the loop of HP1, no other dihedral angles were restrained. In HP2:Oligo1, ribose puckers for G6, A7, and A8 were not restrained. All other residues were restrained to C3′-endo, δ (80° ± 35°). Other than χ and δ, no dihedral angles were restrained in the loop or oligo of HP2:Oligo1.
Structure generation
Structures were generated as described (Kauffmann et al. 2017), but using AMBER 16 (Case et al. 2016) with restrained simulated annealing starting with a structure generated from NUCGEN (Bansal et al. 1995). Coordinates, restraints, and chemical shifts are deposited with the Protein Data Bank (ID# 7RQ5) and BMRB (ID# 30940). A generalized Born implicit solvent was used with a salt concentration of 0.1 M NaCl (Still et al. 1990). Limited restrained simulations at lower salt gave essentially identical results.
MD simulations
Unrestrained simulations of HP2:Oligo1 were carried out in TIP3P solvent using AMBER 16. Force field parameters for LNA nucleotides were taken from Condon et al. (2014), with 5-methyl charge and angle parameters in 5mCL adjusted to match replaced H5 in CL. Charges in 2′O-methyl modifications were adjusted to match replaced 2′-OH charges; angle and torsion parameters were taken from the AMBER library. Two starting structures were selected from an ensemble of 50 NMR structures generated with NMR restraints.
Structures were immersed in a truncated octahedral box filled with TIP3P water (Jorgensen et al. 1983) such that there was at least 10 Å of water from all surfaces of the complex. Enough Na+ ions were added to neutralize the RNA charge, resulting in ∼0.1 M Na+ concentration, which is higher than the bulk Na+ concentration used for the NMR experiments. Systems were then energy minimized in two stages. First, the RNA was held fixed and only water molecules were minimized for 1000 steps of 2 fsec each. Second, the whole system was allowed to equilibrate for 2500 steps. With the solute held fixed again, the system was heated from 0 K to 298 K over 20 psec using a Langevin thermostat (Chandrasekhar 1943) with 1 psec−1 frequency of collision. In the final stage of equilibration, Berendsen pressure regulation (Berendsen et al. 1984) with isotropic position scaling was turned on and the system equilibrated for 1 nsec at a pressure of 1 atm. Finally, production simulations were run with Monte Carlo pressure regulation at 298 K and 1 atm (NPT ensemble). Bonds to hydrogens were constrained with the SHAKE algorithm (Ryckaert et al. 1977), which allowed 2-fsec time steps. Simulations were run with the graphical card implementation (Salomon-Ferrer et al. 2013) of the MD engine of the Amber 16 software package. All molecules were modeled with the AMBER ff99RNAOL3 force field. This force field contains the original parameters from force fields ff94 (Cornell et al. 1995) and ff99 (Cheatham et al. 1999; Wang et al. 2000) along with revisions for α and γ backbone dihedrals (Perez et al. 2007) and glycosidic dihedrals for all four bases (Zgarbova et al. 2011). Each starting structure was simulated for 0.5 µsec.
SUPPLEMENTAL MATERIAL
Supplemental material is available for this article.
ACKNOWLEDGMENTS
This research was supported by National Institutes of Health Grant R01 GM22939 to D.H.T., R01 GM133810 to W.N.M., and National Science Centre grant 2020/39/B.NZ1/03054 to E.K.
Footnotes
-
Article is online at http://www.rnajournal.org/cgi/doi/10.1261/rna.078951.121.
- Received August 17, 2021.
- Accepted December 13, 2021.
This article is distributed exclusively by the RNA Society for the first 12 months after the full-issue publication date (see http://rnajournal.cshlp.org/site/misc/terms.xhtml). After 12 months, it is available under a Creative Commons License (Attribution-NonCommercial 4.0 International), as described at http://creativecommons.org/licenses/by-nc/4.0/.




