


Splicing efficiency of minor introns in a mouse model of SMA predominantly depends on their branchpoint sequence and can involve the contribution of major spliceosome components
- Valentin Jacquier1,
- Manon Prévot1,
- Thierry Gostan1,
- Rémy Bordonné1,
- Sofia Benkhelifa-Ziyyat2,
- Martine Barkats2 and
- Johann Soret1
- 1Institut de Génétique Moléculaire de Montpellier, Univ Montpellier, CNRS, Montpellier 34293, France
- 2Centre de Recherche en Myologie (CRM), Institut de Myologie, Sorbonne Universités, UPMC Univ Paris 06, Inserm UMRS974, GH Pitié Salpêtrière, Paris 75013, France
- Corresponding author: johann.soret{at}igmm.cnrs.fr
Abstract
Spinal muscular atrophy (SMA) is a devastating neurodegenerative disease caused by reduced amounts of the ubiquitously expressed Survival of Motor Neuron (SMN) protein. In agreement with its crucial role in the biogenesis of spliceosomal snRNPs, SMN-deficiency is correlated to numerous splicing alterations in patient cells and various tissues of SMA mouse models. Among the snRNPs whose assembly is impacted by SMN-deficiency, those involved in the minor spliceosome are particularly affected. Importantly, splicing of several, but not all U12-dependent introns has been shown to be affected in different SMA models. Here, we have investigated the molecular determinants of this differential splicing in spinal cords from SMA mice. We show that the branchpoint sequence (BPS) is a key element controlling splicing efficiency of minor introns. Unexpectedly, splicing of several minor introns with suboptimal BPS is not affected in SMA mice. Using in vitro splicing experiments and oligonucleotides targeting minor or major snRNAs, we show for the first time that splicing of these introns involves both the minor and major machineries. Our results strongly suggest that splicing of a subset of minor introns is not affected in SMA mice because components of the major spliceosome compensate for the loss of minor splicing activity.
Keywords
INTRODUCTION
Spinal muscular atrophy is an autosomal recessive disease characterized by both degeneration of motor neurons from the anterior horn of the spinal cord and skeletal muscle atrophy (Pearn 1978; Crawford and Pardo 1996). This leading cause of infant mortality is classified into four types according to the age of onset and clinical severity (Sendtner 2001; Talbot and Davies 2001; Frugier et al. 2002; Monani 2005; Sumner 2006). In all patients, the disease results from homozygous deletions or mutations in the survival motor neuron gene (SMN1), but its severity is inversely correlated to the number of copies of the nearly identical gene called SMN2 (Lefebvre et al. 1995, 1997). Indeed, because of an exonic splicing mutation (Cartegni and Krainer 2002; Kashima and Manley 2003), SMN2 transcripts preferentially splice out exon 7 and produce a truncated and very unstable protein (Burnett et al. 2009; Cho and Dreyfuss 2010). As a consequence, SMN2 only expresses low levels of functional SMN protein, accounting for the observation that multiple SMN2 are required to compensate for the loss of SMN1 (Coovert et al. 1997; Lefebvre et al. 1997; McAndrew et al. 1997).
SMN is a ubiquitously expressed protein that is essential for viability from yeast to human (Schrank et al. 1997; Wang and Dreyfuss 2001; Paushkin et al. 2002; Campion et al. 2010). It has been implicated in many cellular processes including transcription (Pellizzoni et al. 2001a), pre-mRNA splicing (Fischer et al. 1997; Pellizzoni et al. 1998), biogenesis of small nucleolar RNPs (Charroux et al. 2000; Pellizzoni et al. 2001b, Whitehead et al. 2002), and axonal mRNA transport (Pagliardini et al. 2000; Rossoll et al. 2003; Zhang et al. 2003; Jablonka et al. 2004; Fallini et al. 2011, 2012; Rage et al. 2013; Rihan et al. 2017). However, the best-characterized function of SMN is currently as part of a multiprotein complex required for the biogenesis of small nuclear ribonucleoproteins particles (snRNPs), which are components of the splicing machinery (Meister et al. 2001; Pellizzoni et al. 2002). In the cytoplasm, the SMN complex composed of Gemin 2–8 and Unrip assembles a heptameric ring of Sm proteins on each RNA polymerase II–transcribed U-rich snRNA (U1, U2, U4, U4atac, U5, U11, and U12) to form a mature snRNP (Charroux et al. 2000; Meister et al. 2001; Pellizzoni et al. 2002), this being a prerequisite for import of snRNPs in the nucleus (Pellizzoni 2007) where the splicing reaction occurs. In agreement with the fundamental role of SMN in snRNP biogenesis, it has been shown that extracts of SMA patient cells have a lower snRNP assembly efficiency, in correlation with their level of functional SMN protein (Wan et al. 2005). Taken together, these observations led to propose that SMA is caused, at least in part, by perturbations of the snRNP biogenesis, leading to splicing defects of specific mRNAs involved in motor neuron functions. Consistent with this, Gabanella et al. have reported a strong impairment of snRNP assembly in various tissues of a severe SMA mouse model (Gabanella et al. 2007). They showed that defective SMN complex function results in a significant decrease in the levels of a subset of snRNPs and predominantly alters the levels of the U11 snRNP, which is a component of the minor spliceosome responsible for the splicing of a rare class of introns (Turunen et al. 2013). Using a moderate SMA mouse model, Zhang et al. have confirmed that SMN deficiency alters the stoichiometry of both major and minor snRNAs and causes widespread pre-mRNA splicing defects in SMA mouse tissues such as spinal cord, liver, and kidney (Zhang et al. 2008). In a previous study, we have examined the snRNP repertoire in lymphoblasts from a type I SMA patient and noted a slight decrease of U4atac and U6atac snRNAs in these SMN-deficient cells (Boulisfane et al. 2011). Interestingly, we also observed that the formation of the minor U4atac/U6atac/U5 snRNP is hindered in the SMA cells and that this defect is correlated to a significant splicing inhibition of some, but not all, minor introns (Boulisfane et al. 2011). Accordingly, it has been reported that SMN deficiency impairs splicing of a subset of U12 introns in Drosophila larvae, supporting the notion that minor introns are differentially processed when the level of minor snRNPs decreases (Lotti et al. 2012). More recently, other studies using different SMA models have confirmed that splicing of all minor introns is not similarly affected upon SMN deficiency (Custer et al. 2016; Doktor et al. 2017; Jangi et al. 2017).
In the present study, we sought to decipher the molecular bases of the differential splicing defects of minor introns in the SMA context. Using spinal cords of an SMA mouse model, we show that the branchpoint sequence (BPS) of minor introns is a key determinant of splicing efficiency in SMA cells. We also observed that splicing of several minor introns, whose BPS significantly diverges from the consensus motif, is not affected in SMA mice. Since these motifs bear some resemblance to major branchpoint sequences, we have used minor splicing reporters to investigate the role of the major spliceosome in the splicing of minor introns. Altogether, our studies indicate that splicing of a subset of minor introns can depend on both the minor and major splicing machineries.
RESULTS
Minor introns are differentially spliced in SMA mice spinal cords
To investigate the splicing efficiency of minor introns in a moderately severe mouse model of SMA (Le et al. 2005), we collected spinal cords from three SMA (KO6, KO9, KO10) and two control mice (WT6, WT7) killed at postnatal day 12 or 13. Splicing efficiency of 30–40 minor introns listed in the U12 database (U12DB, genome.crg.es/cgi-bin/u12db/u12db.cgi; Alioto 2007) was analyzed by RT-PCR experiments performed with primers allowing the simultaneous amplification of both spliced and unspliced RNA species. As already observed in previous studies (Boulisfane et al. 2011; Lotti et al. 2012; Custer et al. 2016; Doktor et al. 2017; Jangi et al. 2017), some minor introns were significantly retained in spinal cords of SMA mice, as compared to the wild-type samples (Mapk9, Ints4, Mapk11; Fig. 1A,C), whereas splicing of others was not affected (Derl2a, Ppp2r2b, Ppp2r2c; Fig. 1B,C).
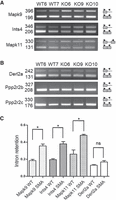
Differential splicing of minor introns in spinal cords of SMA mice. (A) RT-PCR analysis of minor introns splicing in spinal cords of control (WT6, WT7) and SMA (KO6, KO9, KO10) mice. Three examples of retained introns are shown. Gene names and size (in base pairs) of the amplified products are indicated on the left. The schematic structure of the amplified products is shown on the right. (B) RT-PCR analysis of minor introns splicing in spinal cords of control (WT6, WT7) and SMA (KO6, KO9, KO10) mice. Three examples of unaffected introns are shown. (C) Retention index of minor introns in spinal cords of control (WT, n = 2) and SMA (SMA, n = 3) mice determined as described in the Materials and Methods section. Mean and SEM are shown. Statistical significance was calculated using the Student t-test (ns: nonsignificant; (*) P < 0.05). Histograms for Ppp2r2b and 2c are not shown because retained introns are not detectable.
Splice donor sequence and intron size are not critical for minor intron retention
To identify the molecular determinants responsible for this differential processing efficiency, we first focused on the sequence of the splice donor site. The U11 consensus sequence for the donor site (RTATCCTTT) is highly conserved and distinct from the U1 consensus (GTRAGT; Dietrich et al. 1997). We observed that splicing of minor introns containing perfect consensus donor sequences was either not affected (Mapk1, Vezt; Fig. 2A,E) or significantly impaired (Ppp2r2d, Cip2a; Fig. 2B,E), regardless of the donor subtype (GT or AT). Similar results were obtained for minor introns containing splice donor sequences divergent from the consensus motif. Their splicing was either not affected (Ncbp2, Gpaa1; Fig. 2C,E) or significantly inhibited (Gbl, Nup210; Fig. 2D,E). These observations indicate that the sequence of the splice donor site is not the primary determinant for the minor introns differential splicing in SMA mice.
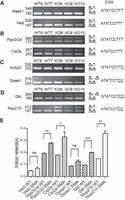
The sequence of the splice donor site is not a key determinant of minor intron retention in spinal cords of SMA mice. RT-PCR analysis of minor introns splicing in spinal cords of control (WT6, WT7) and SMA (KO6, KO9, KO10) mice. (A) Unaffected minor introns containing canonical 5′ splice site sequences. (B) Retained minor introns containing canonical 5′ splice site sequences. (C) Unaffected minor introns containing suboptimal 5′ splice site sequences. Nucleotides diverging from the consensus are underlined. (D) Retained minor introns containing suboptimal 5′ splice site sequences. Nucleotides diverging from the consensus are underlined. Gene names and size (in base pairs) of the amplified products are indicated on the left. The schematic structure of the amplified products is shown on the right. (E) Retention index of minor introns in spinal cords of control (WT, n = 2) and SMA (SMA, n = 3) mice determined as described in the Materials and Methods section. Mean and SEM are shown. Statistical significance was calculated using the Student t-test (ns: nonsignificant; (*) P < 0.05; (**) P < 0.01; (***) P < 0.005). Histograms for Mapk1 and Ncbp2 are not shown because retained introns are not or hardly detectable.
To determine whether the size of the intron could influence the splicing process, we then analyzed the splicing efficiency of minor introns of various lengths. For short introns, some such as Mapk11 (198 nt; Fig. 1) were clearly affected in SMA spinal cords, whereas others such as Gpaa1 (176 nt; Fig. 2) were not retained. Differential splicing efficiency was also observed for longer introns (>1.0 kb), which were either slightly/not affected such as Derl2a (1082 nt; Fig. 1) or significantly retained such as Ppp2r2d (1067 nt; Fig. 2), indicating thereby that intron size is not responsible for the observed differential intron retention.
Branchpoint sequence is a key determinant for minor intron retention in SMA mice
Minor introns share a highly conserved branchpoint sequence (BPS, TTCCTTRAY; Hall and Padgett 1994; Alioto 2007), which serves as a primary recognition sequence for the U12 snRNA. To determine whether the sequence of BPS could be involved in the differential splicing of minor introns in the spinal cords of SMA mice, we analyzed the splicing efficiency of minor introns containing consensus or divergent branchpoint sequences. As shown in Figure 3A,C, the splicing of introns containing consensus BPS (Ddx54, Ppp2r2b, and Slc12a4) was not significantly inhibited in SMA samples compared to wild-type, whereas the retention of introns diverging from the consensus by only one or more nucleotides (Plcb2, Ncbp1, and Vps16b) was increased by ∼2 to 3.5 times (Fig. 3B,C).
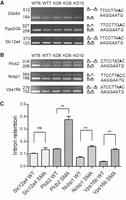
Branchpoint sequence is a key determinant of minor intron retention in the spinal cord of SMA mice. RT-PCR analysis of minor intron splicing in spinal cords of control (WT6, WT7) and SMA (KO6, KO9, KO10) mice. (A) Minor introns containing canonical branchpoint sequences. (B) Minor introns containing suboptimal branchpoint sequences. Nucleotides diverging from the consensus are underlined. The putative branch site adenosine is indicated in bold. The branchpoint sequence is aligned with the anti-branch site of the U12 snRNA (in italics). Gene names and size (in base pairs) of the amplified products are indicated on the left. The schematic structure of the amplified products is shown on the right. (C) Retention index of minor introns in spinal cords of control (WT, n = 2) and SMA (SMA, n = 3) mice determined as described in the Materials and Methods section. Mean and SEM are shown. Statistical significance was calculated using the Student t-test (ns: nonsignificant; (**) P < 0.01). Histograms for Ddx54 and Ppp2r2b are not shown because retained intron is not detectable.
To confirm these results, we first determined the U12 binding energy for each of the 142 different branchpoint sequences identified in the 555 murine minor introns compiled in the U12 database. This was performed as described in Mercer et al. (2015) by calculating the number of hydrogen bonds between the branchpoint motifs and the branchpoint binding sequence of the U12 snRNA. We then examined the splicing efficiency of several minor introns differing by the score of their BPS (see Table 1). As expected, Ddx54, Ppp2r2b, Slc12a4 (Figs. 2C, 3A), as well as Pten, Srpk1, and Usp14 introns (Fig. 4A,C), whose BPS corresponds to the TTCCTTRAY consensus and exhibits the highest scores (19 and 18), are spliced almost as efficiently in WT and SMA spinal cords. As already observed (Fig. 3B,C), the splicing efficiency is clearly affected in SMA mice when the BPS score decreases as shown for Plcb2, Ncbp1, and Vps16b introns in Figure 3 (BPS score = 13, 17, and 17, respectively) or for Ap4e1, Ncoa6ip, and Vac14 introns in Figure 4 (BPS score = 16, 15, and 12, respectively).
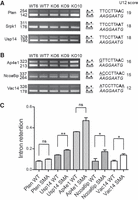
The score of the branchpoint sequence is correlated to the splicing efficiency of most minor introns. RT-PCR analysis of minor introns splicing in spinal cords of control (WT6, WT7) and SMA (KO6, KO9, KO10) mice. Gene names and size (in base pairs) of the amplified products are indicated on the left. The schematic structure of the amplified products is shown on the right. The branchpoint sequence aligned with the anti-branch site of the U12 snRNA (in italics) as well as the BPS scores are shown on the right. The putative branch site adenosine is indicated in bold. (A) Minor introns containing canonical branchpoint sequences. (B) Minor introns containing suboptimal branchpoint sequences. (C) Retention index of minor introns in spinal cords of control (WT, n = 2) and SMA (SMA, n = 3) mice determined as described in the Materials and Methods section. Mean and SEM are shown. Statistical significance was calculated using the Student t-test (ns: nonsignificant; (*) P < 0.05; (**) P < 0.01). Histograms for Srpk1 are not shown because retained introns are not detectable.
Features of murine minor introns used in this study
Altogether, these observations indicate that minor introns with optimal BPS are not significantly affected in SMN-deficient cells and suggest that suboptimal branchpoint regions are correlated to an increase of minor intron retention in response to SMN depletion.
Splicing of a subset of minor introns containing a suboptimal BPS is not inhibited upon SMN deficiency
Our analysis of the splicing efficiency of introns containing suboptimal BPSs revealed, however, that if some of them (Derl2b, Exosc1, Ints7; Fig. 5A,C) are clearly affected in SMN-deficient spinal cords, others (Llglh, Gosr1, Tsta3; Fig. 5B,C) appear to be insensitive to SMN deficiency. Careful examination of the branch sequences contained in the unaffected introns pointed to an increased capacity to interact with the U2 snRNA, thereby suggesting that components of the major spliceosome could compensate for the biogenesis defects of minor snRNPs in SMA mice. To address this possibility, we reexamined the 142 minor BPSs for their complementarity with the corresponding anti-branch sequence (5′-GTAGTATC-3′) of the U2 snRNA. In major introns, the GTAGTA motif binds to the TRYTRAY sequence surrounding the branchpoint nucleotide (underlined; Taggart et al. 2017), and it has been shown that base-pairing of TC with nucleotides upstream to the BPS can help to stabilize U2–BPS interaction (Xu and Query 2007). Scores were determined as described in the Materials and Methods section, taking into account that, as described for minor BPS, either of two adjacent adenosines within the branch site sequence can be used as the branchpoint nucleotide (Query et al. 1994). Results presented in Table 1 indicate that the highest U2 scores (16 and 14) correspond to branchpoint sequences represented in several minor introns such as Tsta3, Llglh, and Gosr1 (Fig. 5B,C), whose retention is not significantly affected in SMA spinal cords, despite moderate U12 scores (<17). For lower U2 scores, splicing of the corresponding introns (such as Vac14, Exosc1, Ncoa6ip, and Ints7) is significantly inhibited (Table 1; Figs. 4, 5).
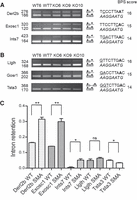
Splicing of a subset of minor introns containing suboptimal BPS is not affected in spinal cords of SMA mice. RT-PCR analysis of minor introns splicing efficiency in spinal cords of control (WT6, WT7) and SMA (KO6, KO9, KO10) mice. Gene names and size (in base pairs) of the amplified products are indicated on the left. The schematic structure of the amplified products is shown on the right. The branchpoint sequence aligned with the anti-branch site of the U12 snRNA (in italics) as well as the U12 BPS scores are shown on the right. The putative branch site adenosine is indicated in bold. Minor introns with low BPS scores are retained (A) or not affected (B) in spinal cords of SMA mice. (C) Retention index of minor introns in spinal cords of control (WT, n = 2) and SMA (SMA, n = 3) mice determined as described in the Materials and Methods section. Mean and SEM are shown. Statistical significance was calculated using the Student t-test (ns: nonsignificant; (*) P < 0.05; (**) P < 0.01). Histograms for Gosr1 are not shown because retained intron is not detectable.
Altogether, these observations reinforce the hypothesis that splicing of a subset of minor introns can depend on both the minor and major spliceosome activities.
In vitro splicing of the Tsta3 minor intron depends on both minor and major spliceosome components
To evaluate the role of the major spliceosome in the splicing of minor introns, we constructed four reporters sharing similar splice donors, splice acceptors, and intron sizes but differing at the level of their branchpoint sequence (Fig. 6). In the Slc12a4 construct, the BPS corresponds to the consensus sequence and exhibits the highest U12 score (U12 = 19) but an intermediate U2 score (U2 = 9). This intron belongs to the category whose splicing is only slightly affected in SMA spinal cords (Table 1; Fig. 3A,C). The Tsta3 reporter contains a minor intron with a poor U12 BPS (U12 score = 14), which in turn exhibits a high U2 score (U2 = 16). As shown in Figure 5B,C, splicing of this intron is not inhibited, and even moderately increased, in SMN-deficient spinal cords. The third construct, Hip1r, contains a minor intron whose BPS exhibits a medium score for U12 (U12 = 15) and a good enough U2 score (U2 = 15). The last reporter, Vac14, contains a minor intron with a BPS whose score is very low for both U12 and U2 (U12 = 12 and U2 = 4). As a consequence, splicing of this intron is significantly inhibited in SMA spinal cord (Fig. 4B,C).
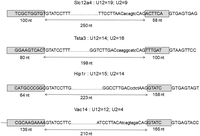
Schematic representation of the reporters used for in vitro splicing experiments. The name of the corresponding gene, the U12 and U2 scores of the minor introns and the size of the exons and introns are indicated. Exonic sequences (gray boxes), minor splicing signals (splice donor, branchpoint sequence, and splice acceptor), as well as downstream sequences containing the major splice donor site are in capital letters.
In vitro splicing experiments were performed with the different reporters in HeLa nuclear extracts and splicing products were analyzed as described in Materials and Methods. To test whether splicing only depends on the minor spliceosome or also involves the major splicing machinery, nuclear extracts were preincubated with locked nucleic acids (LNAs) targeting the U12 or U2 snRNAs. As expected, treatment of nuclear extracts with U12 LNA had a significant effect on Slc12a4, Tsta3, Hip1r, and Vac14 splicing efficiency (2.0-, 2.5-, 4.0-, and 8.0-fold decrease, respectively; Fig. 7A,B). A much lower reduction of the splicing efficiency was observed for the Slc12a4, Tsta3, Hip1r, and Vac14 reporters following preincubation of the nuclear extracts with the U2 LNA (1.3-, 1.4-, 2.1-, and 1.15-fold decrease, respectively, statistically nonsignificant). Interestingly, simultaneous treatment with the U12 and U2 LNAs had no effect on the Slc12a4 splicing efficiency as compared to that observed following U12 LNA treatment alone, whereas splicing of the Tsta3 reporter was further decreased by 4.0-fold under the same conditions. For the Hip1r reporter whose BPS U2 score is slightly lower than that of the Tsta3 intron, splicing efficiency observed upon U12 inactivation was also reduced by 2.0-fold (nonsignificant) following treatment with U12 and U2 LNAs. In the same conditions, splicing of the Vac14 reporter was reduced by 75%, although in a nonsignificant way, as compared to the U12 inhibition alone. These observations indicate that splicing of the Tsta3 minor intron is significantly affected by U12 inactivation and even more when both U2 and U12 are targeted, thereby suggesting that components of the major spliceosome likely play a substantial role in its splicing.
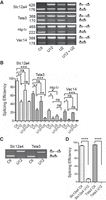
The U2 snRNP participates in the splicing of the Tsta3 minor intron in the presence of functional U12 snRNPs. (A) Representative gel of RT-PCR experiments analyzing simultaneously the amount of unspliced and spliced products obtained with the different reporters. Reporter names and size (in base pairs) of the amplified products are indicated on the left and the schematic structure of the splicing products is shown on the right. Preincubation of the splicing extracts with LNAs targeting the U2 (U2, 2 µM), U12 (U12, 2 nM), or U12 + U2 snRNAs is indicated. The faint band detected immediately below the Slc12a4 and Vac14 unspliced products likely corresponds to a spliced–unspliced heteroduplex RNA. (B) Splicing efficiency (in %) determined for the different reporter substrates following incubation in control (Ctl) or LNA-pretreated extracts. (C) Representative gel of RT-PCR experiments analyzing simultaneously the amount of unspliced and spliced products obtained with the Slc12a4 and Tsta3 reporters. Preincubation of the splicing extracts with LNAs targeting the U2 (U2, 2 µM) or U12 (U12, 2 µM) snRNAs is indicated. (D) Splicing efficiency (in %) determined for the different reporter substrates following incubation in control (Ctl) or LNA-pretreated extracts. Statistical significance was calculated using the Student t-test (n = 3; (*) P < 0.05; (**) P < 0.01; (***) P < 0.001; (****) P < 0.0001).
To determine whether the major spliceosome can, on its own, carry out splicing of the Tsta3 minor intron, in vitro splicing experiments were performed following treatment of the nuclear extracts with a much higher concentration of U12 LNA. Under these conditions, splicing of the Slc12a4 reporter is almost no longer detectable (Fig. 7C,D), while that of the Tsta3 minor intron is fully inhibited, thereby indicating that the major splicing machinery alone is not able to achieve removal of this intron. Moreover, these observations strongly suggest that a sufficient amount of functional U12 snRNP is required to allow the involvement of the U2 snRNP in this process.
The Plcb3 minor intron contains competing BPSs differentially affected by U2 depletion
To exclude the possibility that the effect of U2 depletion is specific for the Tsta3 splicing reporter, we performed similar in vitro splicing experiments with the Plcb3 construct (Fig. 8A) in which the BPS (CTGACCGAC) has a high U2 score (U2 = 15). Surprisingly, in vitro splicing of this construct gives rise to the expected product (245 nt) but also to a shorter one (127 nt) not already described (Fig. 8B). Sequencing of this product indicated that it results from the use of an alternative 3′ splice site located 7 nt upstream from the end of the 3′ exon. Careful examination of the intronic sequence allowed us to identify a potential BPS (GCCCTCAAC) where the branchpoint adenosine is located 8 nt upstream from the alternative 3′ splice site and whose U12 and U2 scores are low (U12 = 13; U2 = 10). Interestingly, treatment of the nuclear extracts with the U12 LNA resulted in a significant decrease of both the expected and the alternative splicing products (3.2- and 4.9-fold decrease, respectively), whereas treatment with the U2 LNA only affected the splicing efficiency of the expected splicing product (2.4-fold decrease; Fig. 8C). Following simultaneous treatment with the U12 and U2 LNAs, the splicing efficiency of the expected and alternative products was further reduced by fourfold and 3.2-fold, although in a statistically nonsignificant way, as compared to the U12 inhibition alone (Fig. 8C). Taken together, these observations indicate that the splicing efficiencies of the two Plcb3 products are differentially affected by U2 depletion, in good agreement with the U2 score of their corresponding branchpoint sequence.
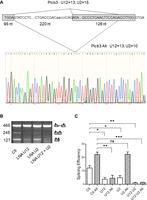
The Plcb3 minor intron contains competing BPSs differentially affected by U2 depletion. (A) Schematic representation of the Plcb3 splicing reporter and electrophoregram indicating the alternative 3′ splice site used to generate the 127 nt mRNA. The U12 and U2 scores of the competing branch sites and the size of the exons and introns are indicated. Exonic sequences (gray boxes), minor splicing signals (splice donor, branchpoint sequence, and splice acceptor), as well as downstream sequences containing the major splice donor site are in capital letters. (B) Representative gel of RT-PCR experiments analyzing simultaneously the amount of unspliced and spliced products obtained with the Plcb3 reporter. Preincubation of the splicing extracts with LNAs targeting the U2 (U2, 2 µM), U12 (U12, 2 nM), or U12 + U2 snRNAs is indicated. The schematic structure of the splicing products is shown on the right and the size (in base pairs) is indicated on the left. (C) Splicing efficiency (in %) determined for the different splicing products following incubation in control (Ctl) or LNA-pretreated extracts. “Alt” refers to the 127-nt-long mRNA. Statistical significance was calculated using the Student t-test (n = 3; ns: nonsignificant; (*) P < 0.05; (**) P < 0.01; (***) P < 0.001).
The branchpoint sequence is responsible for the U2 snRNP-dependent splicing of Tsta3 minor intron
To definitely establish that the sequence of the BPS is responsible for the involvement of major spliceosome components in the splicing of the Tsta3 minor intron, we performed swapping experiments to replace its original BPS by that of the Slc12a4 intron. As shown in Figure 9, the splicing efficiency of the Tsta3 BPS Slc12a4 construct is increased as compared to that of the original Tsta3 reporter and very similar to that of the Slc12a4 reporter (Figs. 7, 9). Upon treatment of the nuclear extracts with the U12 LNA, the splicing efficiency was reduced by 1.85-fold, this decrease being consistent with that observed for the original Slc12a4 reporter (Figs. 7, 9). Noteworthy, an alternative product was detected in these conditions, indicative of the activation of cryptic splice sites. Sequencing of this product indeed revealed that major donor (TG/GTGAGG) and acceptor (CAAG/GC) sites located within the Tsta3 intron are used to generate this variant RNA (Fig. 9B). Following treatment with the U2 LNA, the alternative product was no longer detected, thereby confirming that it results from the activity of the major spliceosome (Fig. 9A,C). Under the same conditions, the minor splicing efficiency was slightly reduced (1.4-fold), although in a nonsignificative way, as already observed for the Slc12a4 construct (Figs. 7, 9). Simultaneous treatment with the U12 and U2 LNAs had no significant effect on the Tsta3 BPS Slc12a4 splicing efficiency as compared to that observed following U12 LNA treatment alone (Fig. 9A,C). These observations indicate that the Slc12a4 BPS is sufficient, per se, to confer to the Tsta3 construct the splicing behavior of the Slc12a4 reporter and to abrogate its dependency toward the U2 snRNA.
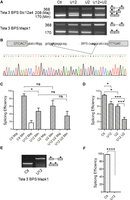
The branchpoint sequence is responsible for the Tsta3 splicing dependence on U2 snRNP. (A) Representative gel of RT-PCR experiments analyzing simultaneously the amount of unspliced and spliced products obtained with the Tsta3 reporter with different branchpoint sequences. Reporter names and size (in base pairs) of the amplified products are indicated on the left. The schematic structure of the splicing products is shown on the right. Preincubation of the splicing extracts with LNAs targeting the U2 (U2, 2 µM), U12 (U12, 2 nM), or U12 + U2 snRNAs is indicated. (B) Schematic representation and electrophoregram indicating the major cryptic splice sites activated in the Tsta3 BPS Slc12a4 reporter following partial inactivation of the U12 snRNPs. (C,D) Splicing efficiency (in %) determined for the Tsta3 BPS Slc12a4 (C) and Tsta3 BPS Mapk1 (D) reporter substrates following incubation in control (Ctl) or LNA-pretreated extracts. In C, Min refers to the regular splicing event and Maj to the cryptic one. (E) Representative gel of RT-PCR experiments analyzing simultaneously the amount of unspliced and spliced products obtained with the Tsta3 BPS Mapk1 reporter. Preincubation of the splicing extracts with LNAs targeting the U12 (U12, 2 µM) snRNAs is indicated. (F) Splicing efficiency (in %) determined for the Tsta3 BPS Mapk1 following incubation in control (Ctl) or LNA-pretreated extracts. Statistical significance was calculated using the Student t-test (n = 3; (*) P < 0.05; (**) P < 0.01; (***) P < 0.001; (****) P < 0.0001).
Interestingly, the splicing behavior of the Tsta3 construct was restored following replacement of the Slc12a4 BPS by that of the Mapk1 minor introns, which exhibit a suboptimal U12 score (15; Table 1) but a rather high U2 score (14; Table 1), and whose splicing is not affected in SMA spinal cords (Fig. 2). Indeed, U12 and U2 degradation led to a ∼1.4- and ∼1.5-fold decrease of the splicing efficiency, respectively. Following simultaneous U12 and U2 LNA treatment, the splicing efficiency of the Tsta3 BPS Mapk1 reporter was decreased by 5.0-fold as compared to the U12 LNA treatment alone (Fig. 9A,D). As already observed for the Tsta3 construct (Fig. 7C,D), splicing of the Tsta3 BPS Mapk1 reporter was fully inhibited following treatment of the nuclear extracts with a high U12 LNA concentration (Fig. 9E,F), confirming that a sufficient amount of functional U12 snRNP is required to allow the involvement of the U2 snRNP in their splicing.
Altogether, these results indicate that the U2 snRNP from the major spliceosome can contribute to the splicing of minor introns in a way that is mainly dependent on their branchpoint sequence.
U2 snRNAs interact with the Tsta3 BPS
To determine whether the U2 snRNA interacts with the Tsta3 BPS, we performed UV cross-linking experiments with the Tsta3 reporter as well as with the Tsta3 BPS Slc12a4 construct where the original Tsta3 BPS has been exchanged for that of the Slc12a4 reporter (Figs. 7, 9). In vitro splicing reactions were performed in the presence of the splicing inhibitor isoginkgetin (O'Brien et al. 2008), which prevents the stable recruitment of the U4/U5/U6 and U4atac/U5/U6atac tri-snRNPs and results in the accumulation of the prespliceosomal A complexes. Following UV cross-linking, RNA was purified, hybridized to biotinylated oligonucleotides specific for Tsta3 intronic and 3′ exon sequences, and reporter pre-mRNAs were affinity-purified with Streptavidin-coupled magnetic beads. Amounts of U12 and U2 snRNAs copurifying with the reporter pre-mRNAs were determined by RT-PCR analyses using primers located in the 3′ region of both snRNAs to avoid strong reverse transcriptase stops induced by UV irradiation. Indeed, using UV cross-linking of purified U2 snRNPs, Dybkov et al. (2006) reported that only five faint UV-dependent reverse transcriptase stops (A123, C128, U130, G131, and C135) occur in the region comprised between nucleotides 104 and 149 of the U2 snRNA, whereas much stronger UV-dependent stops are observed upstream. In good agreement with this study, we were able to amplify U2 sequences with oligonucleotides located at positions 105–125 (Fw) and 157–176 (Rev; Fig. 10) but not with an upstream forward primer located at positions 65–84 (data not shown). To detect U12 sequences, we tested two primer pairs (Fw: 39–58 × Rev: 124–145 and Fw: 81–101 × Rev: 124–145), and we found that both allowed efficient amplification (Fig. 10 and data not shown).
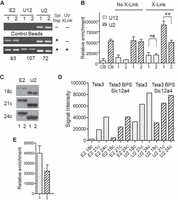
The Tsta3 branchpoint sequence efficiently interacts with the U2 snRNA. (A) Representative gels of RT-PCR experiments analyzing the amount of U12 and U2 snRNAs binding to the beads alone (control beads), to the reporter RNAs without the UV cross-linking step or cross-linked to the Tsta3 (1) or Tsta3 BPS Slc12a4 (2) reporter pre-mRNAs. PCR reactions specific for sequences of the 3′ exon present in both reporters (E2) was used to normalize for affinity purification efficiency. The size (in base pairs) of the amplified fragments is indicated. (B) Relative enrichment of U12 and U2 snRNAs obtained with the control beads (CBs) and with the Tsta3 (1) or Tsta3 BPS Slc12a4 (2) reporter pre-mRNAs. For each snRNA, the intensities (expressed in arbitrary units) were normalized using the signal obtained with primers specific for the Tsta3 3′ exon (E2) as a reference. Statistical significance was calculated using the Student t-test (n = 4; (**) P < 0.01). (C) Semi-quantitative RT-PCR analyses of U2 snRNA amounts copurified with the Tsta3 (1) or Tsta3 BPS Slc12a4 (2) reporter pre-mRNAs after UV cross-linking. PCR reactions specific for sequences of the 3′ exon present in both reporters (E2) and used to normalize for affinity purification efficiency of the Tsta3 (1) or Tsta3 BPS Slc12a4 (2) reporter pre-mRNAs are shown. The size of the amplified fragments is the same as in A. The number of PCR cycles is indicated on the left. (D) Quantification of the PCR products shown in C. (E) Relative enrichment of U2 snRNA in UV cross-linking experiments performed with the Tsta3 (1) or Tsta3 BPS Slc12a4 (2) reporter pre-mRNAs. The intensities (expressed in arbitrary units) were normalized using the signal obtained with primers specific for the Tsta3 3′ exon (E2) as a reference (n = 2).
As controls, we analyzed the amounts of snRNAs copurified with magnetic beads alone (without reporter RNAs) or with reporter RNAs without cross-linking. As shown in Figure 10, the amount of U12 snRNA copurified with the beads alone was nearly undetectable, whereas U2 snRNAs were significantly detected, thereby indicating nonspecific sticking proportional to the relative amounts of these two snRNAs in the splicing extracts. When reporter RNAs were incubated in the splicing extracts but not submitted to UV cross-link, the amounts of copurified snRNAs were not significantly different than those obtained with the beads alone. After UV cross-link, the amount of U12 snRNA was only slightly increased for both reporters, consistent with the low abundance of minor snRNAs (Montzka and Steitz 1988) and likely because of the short incubation time we used prior to UV irradiation. Strikingly, the amount of U2 snRNAs was increased by ∼1.7-fold for the Tsta3 reporter as compared to that obtained with the beads alone or when cross-linking is omitted, whereas that obtained with the Tsta3 BPS Slc12a4 construct was not changed. To confirm the U2 snRNA enrichment observed with the Tsta3 reporter, we performed semi-quantitative RT-PCR analyses as described in the Materials and Methods section. As shown in Figure 10C,D, amplification of the products corresponding to U2 snRNA and Tsta3 exon 2 used for normalization increased up to 24 cycles, indicating that the reaction is still in its exponential range. Quantification of the signals obtained after 18 cycles for two independent experiments indicated that the amount of U2 snRNA obtained with the Tsta3 reporter is increased by ∼1.8-fold as compared to that detected with the Tsta3 BPS Slc12a4 construct (Fig. 10E).
Altogether, these observations confirm that the Tsta3 branchpoint sequence efficiently interacts with the U2 snRNA.
The Tsta3 branchpoint sequence increases the rate of the splicing reaction
To determine whether the Tsta3 BPS-U2 snRNA interaction increases the splicing rate of high U2 score reporters, we performed time course analyses of the splicing reaction using radiolabeled Tsta3 and Tsta3 BPS Slc12a4 transcripts. As shown in Figure 11A, products of the first step of the splicing reaction, lariat-exon 2 and exon 1 (visible after long exposure), were detected for both reporters following 5 min of incubation. Strikingly, spliced RNA was also clearly detected after 10 and 15 min for the Tsta3 reporter, whereas it was still barely visible after 20 min for the Tsta3 BPS Slc12a4 transcript. Analysis of the splicing efficiencies (Fig. 11B) confirmed that the splicing reaction proceeds faster for the Tsta3 substrate than for the Tsta3 BPS Slc12a4 transcript (between 4.5-fold after 5 min and twofold after 20 min of incubation). In a longer time course study (20 to 100 min), we observed the apparition of the lariat product, at the expense of the lariat-exon 2 intermediate, as well as the accumulation of the spliced RNA. From 20 to 100 min, the splicing efficiency of the Tsta3 substrate was always higher (between 2.2- and 1.4-fold) than that of the Tsta3 BPS Slc12a4 transcript (Fig. 11A,C).
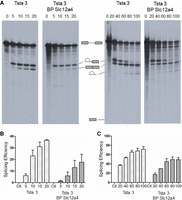
Time course analyses of splicing reactions performed with the Tsta3 or Tsta3 BPS Slc12a4 reporter pre-mRNAs. (A) Time course analysis of the Tsta3 or Tsta3 BPS Slc12a4 pre-mRNAs splicing was performed at 0, 5, 10, 15, and 20 min time points (left panels) and at 0, 20, 40, 60, 80, and 100 min time points (right panels). Splicing products were separated in 4% denaturing polyacrylamide gels. The schematic structure of the splicing products is indicated. (B,C) Splicing efficiency (in %) of the Tsta3 and Tsta3 BPS Slc12a4 pre-mRNAs (n = 2).
Taken together, these results indicate that interaction of the Tsta3 BPS with the U2 snRNP correlates with increased splicing rate and efficiency as compared with those observed for the Tsta3 BPS Slc12a4 substrate, yet containing an optimal U12 branchpoint sequence.
DISCUSSION
Splicing inhibition of U12-dependent introns has been reported in SMA patient cells (Boulisfane et al. 2011) as well as in a severe SMA mouse model (Zhang et al. 2008; Doktor et al. 2017; Jangi et al. 2017). Among all introns whose retention is increased in the SMA mice, minor introns are preferentially affected and nearly one-third of them exhibit significant retention levels (Doktor et al. 2017). Aside from its role in driving the assembly of major spliceosomal snRNPs, SMN is also involved in the biogenesis of minor snRNPs (Zhang et al. 2008), which are much less abundant than their major counterparts (Montzka and Steitz 1988). This, along with the observation that splicing of minor introns is already a slow process under physiological conditions (Patel et al. 2002; Pessa et al. 2006), could explain why minor splicing is preferentially impacted by SMN depletion.
Our previous studies allowed us to show that splicing of some, but not all, minor introns is significantly affected in SMA patient lymphoblasts (Boulisfane et al. 2011). In the present study, we have investigated the molecular bases of this differential intron retention by analyzing the splicing efficiency of ∼30 minor introns in spinal cords of a mild SMA mouse model. Our results indicate that the very stringent and highly conserved branchpoint sequence of the minor introns is the primary determinant of this process. Indeed, we show that splicing of minor introns containing consensus branchpoint sequences is not significantly affected, whereas that of most introns with suboptimal BPS (U12 score <17) is inhibited in spinal cords of SMA mice (Figs. 3, 4). Interestingly, we identified minor introns harboring nonconsensus BPSs and whose splicing is nevertheless not affected in SMA mice (Fig. 5). Since these suboptimal BPSs exhibit an increased capacity to interact with the anti-branch site of the U2 snRNA, this led us to test whether components of the major spliceosome could play a role in the processing of these minor introns. Using in vitro splicing experiments and LNAs targeting U12 and/or U2 snRNAs, we have shown for the first time that splicing of a subset of minor introns depends on both splicing machineries. To date, the sole example of an intron whose splicing relies on components of the two spliceosomes is a major intron of the rat CGRP gene (Roesser 2004). The context is however different because splicing of CGRP exon 5, which is dependent on the major spliceosome, also requires the U12 snRNP but the exact role of this minor splicing component has not been elucidated.
Our in vitro splicing experiments performed with reporters containing branchpoint sequences with different U2 scores strongly suggested that involvement of the U2 snRNP in the splicing of several minor introns proceeds through direct binding of the U2 snRNA to the branchpoint motif. This has been further confirmed by in vitro splicing assays performed with Tsta3 reporters only differing by their branchpoint sequence (Fig. 9) and by cross-linking experiments (Fig. 10) showing that the Tsta3 reporter containing its genuine BPS (GGTCTTGAC; U2 score = 16) efficiently binds U2 snRNAs, whereas the same construct containing the Slc12a4 BPS (TTCCTTAAC; U2 score = 9) does not. Finally, time course analyses of splicing reactions performed with these two reporters have revealed that involvement of the U2 snRNP in the splicing of the Tsta3 substrate results in an increased rate and a better efficiency of intron excision as compared to those observed for the Tsta3 BPS Slc12a4 (Fig. 11).
In major introns, interaction between the U2 snRNP and the branchpoint sequence requires prior binding of the U2 auxiliary factor (U2AF) to the polypyrimidine tract (PPT) located downstream from the BPS (Ruskin et al. 1988; Michaud and Reed 1991, 1993). Since minor introns lack apparent PPTs between the BPS and the 3′ splice site (Sharp and Burge 1997), this raises the question of knowing how the interaction of the U2 snRNP with specific minor BPSs can be promoted and/or stabilized. A likely explanation relies on the exon-definition model initially reported for splicing of major introns and whereby U1 snRNP bound to a 5′ splice site can be bridged to the U2AF complex bound to an upstream PPT through interactions with arginine-serine-rich (SR) proteins (Robberson et al. 1990; Hoffman and Grabowski 1992; Wu and Maniatis 1993). Later, it was shown that such a model can also apply to minor intron splicing since addition of a major 5′ splice downstream from a minor splicing reporter enhances the excision of the upstream minor intron (Wu and Krainer 1996). In that situation, bridging between U1 and U12 snRNPs would then occur through interactions with SR proteins and maybe other factors likely related to U2AF proteins such as Zrsr2/Urp (Shen et al. 2010), compensating for the absence of U2AF (Fig. 12).
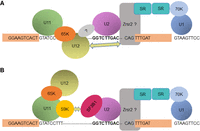
Alternative models for U2 snRNP involvement in the splicing of a subset of minor introns. (A) Schematic representation of putative interactions between the U2 and U12 snRNPs. These interactions could be either direct or involve additional factor(s) related (Zrsr2) or not to the U2AF complex. The 65K protein involved in the bridging of the U11 and U12 snRNPs is shown. The exon definition model accounting for the need of a major 5′ splice site for efficient splicing of the upstream minor intron (Wu and Krainer 1996) is also depicted. (B) Schematic representation of putative interactions between the U2 and U11 snRNPs. These interactions could involve the 59K protein of the U11 snRNP and components of the U2 snRNP such as SF3B1, as recently proposed (Olthof et al. 2021).
Our in vitro studies also reveal that the almost complete inactivation of the U12 snRNP results in the full splicing inhibition of the Tsta3 minor intron (Fig. 7C,D), thereby indicating that the major spliceosome is not, by itself, able to carry out the removal of this intron. This is consistent with the fact that consensus minor 5′ splice sites (such as that of the Tsta3 intron, i.e., GTATCCTTT) do not contain a G at position +5, which is involved in a crucial base-pairing interaction with the U6 snRNA (Kandels-Lewis and Séraphin 1993; Lesser and Guthrie 1993). Moreover, the nucleotide at position −1 in minor 5′ splice sites of the GT-AG subtype is generally a U (Moyer et al. 2020), whereas a G is preferred in major 5′ splice sites because it pairs with a C in the U1 snRNA (Pomeranz Krummel et al. 2009; Kondo et al. 2015). Altogether, these observations argue against a role of the U1 snRNP in the splicing of the Tsta3 intron but rather support a cooperation between the minor U11–U12 di-snRNP and the U2 snRNP in the prespliceosomal A complex. Our results also raise interesting questions concerning the need for functional U12 snRNPs to reveal the role of the U2 snRNP in the splicing of the Tsta3 minor intron. It has been shown that all the U12 snRNPs exist as di-snRNP complexes in splicing extracts (Montzka and Steitz 1988; Wassarman and Steitz 1992) and that treatment of nuclear extracts with a U12-specific 2′-O-methyl oligonucleotides results in a dramatic decrease of U11 snRNP binding to the 5′ splice site of a P120 minor splicing substrate (Frilander and Steitz 1999). One can therefore envisage that complete inactivation of the U12 snRNP precludes binding of the di-snRNP to the 5′ splice site or that structural modifications of the inactivated U12 snRNP inhibit the formation of the chimeric spliceosomal A complex. Along this line, formation of this complex could involve interactions between the U2 and U12 snRNPS, either in a direct way or through binding to an additional factor that remains to be identified (see below; Fig. 12A). In an alternative model, interactions could be established between the U2 and U11 snRNPs (Fig. 12B). In support of the latter model, a recent study suggests that the U11-59K protein of the minor spliceosome could bind proteins of the major spliceosome to form exon-bridging interactions involved in the regulation of alternative splicing events around minor introns (Olthof et al. 2021). Strikingly, one of the proteins bound by U11-59K is SF3B1 (SF3b155), which is part of the U2 snRNP (Reed 1996). These observations would therefore confirm previous reports indicating the existence of cross talks between the two splicing machineries (Wu and Krainer 1996; Cologne et al. 2019; Akinyi and Frilander 2021).
The involvement of the U2 snRNP in the splicing of several minor introns raises interesting questions concerning the evolutionary fate of these introns. Indeed, the high U2 score exhibited by their BPS suggests that this subset of minor introns could correspond to those undergoing U12- to U2-type conversion. Evolutionary mechanisms concerning minor introns have been documented 20 years ago (Burge et al. 1998), and it was proposed that the conversion from the U12 to the U2 splicing type first requires mutation of the highly conserved U12 5′ splice site (GTATCCTTT), generally at the +5 position, to be recognized by the U1 snRNP. It was also suggested that the C/T-rich minor BPS (TTCCTTRAY) could fulfill the role of the pyrimidine-rich region important in the splicing of U2 introns, and that an upstream motif close to the highly degenerated U2 BPS could be used as a functional major branch site. The situation described in our study is somewhat different because we identified minor introns that contain suboptimal U12 BPS and exhibit an increased capacity to interact with the U2 snRNA. Our analyses thereby support another model where the U12 BPS can be recognized by either the U12 or U2 snRNA. In the latter case, the absence of a PPT suggests that the U2AF complex, known to help in anchoring U2 snRNP at the BPS, is not involved in the recognition of the 3′ splice site. However, it has been shown that for major introns with weak PPTs, interaction of the U2AF35 subunit with the 3′ splice site dinucleotide AG is determinant for U2AF binding and splicing (Merendino et al. 1999; Wu et al. 1999; Zorio and Blumenthal 1999). Alternatively, U2AF could be replaced by a U2AF-related protein such as ZRSR2/Urp (Fig. 11), which is not only required for minor intron splicing but also for the second step of major intron splicing where it is thought to replace U2AF35 (Shen et al. 2010).
Overall, our study reveals the existence of a cooperative cross talk between components of both the minor and major splicing machineries participating in the efficient splicing of a subset of minor introns containing suboptimal BPSs. The ability of the branchpoint sequence to interact with the U2 snRNA could help to preserve efficient splicing of the corresponding minor introns, not only upon SMN depletion, but also in other diseases such as isolated growth hormone deficiency (IGHD) and cerebellar ataxia (for review, see Verma et al. 2018), which result from mutations of minor spliceosome components affecting the intron recognition step.
MATERIALS AND METHODS
Animals
SMNΔ7 founder mice were purchased from Jackson (stock number: 5025). These mice harbor a single targeted mutation (disruption of exon 2 in the endogenous mouse Smn gene and two transgenic alleles, the entire human SMN2 gene, and an SMN1 cDNA lacking exon 7 (SMNΔ7). Wild-type mice were [SMN2+/+, SMNdelta7+/+, Smn+/+], heterozygous mice were [SMN2+/+, SMNdelta7+/+, Smn+/−], and SMNdelta7 mice were [SMN2+/+, SMNdelta7+/+, Smn−/−]. The clinical signs are apparent at 5 d, and mean survival is ∼13 d. Heterozygous breeding pairs were mated and litters were genotyped at birth. Mice were kept under controlled conditions (22 ± 1°C, 60 ± 10% relative humidity, 12-h light–12-h dark cycle, food, and water ad libitum). Care and manipulation of mice were performed in accordance with national and European legislations on animal experimentation and approved by the institutional ethical committee.
Tissue sampling
Spinal cords were collected 12–13 d after birth. Mice were deeply anesthetized by intraperitoneal injection of 100 mg/kg ketamine 1000 (Imalgene 1000, 100 mg/mL, Merial) and 10 mg/kg xylazine (2%, Rompun, Bayer) and intracardially perfused with phosphate buffer solution (PBS). The spinal cord was harvested and immediately flash-frozen in liquid nitrogen for total RNA purification.
Total RNA purification and RT-PCR analyses
Total RNA was purified from spinal cords with Tri-Reagent (Sigma) according to the manufacturer's procedure and treated with RQ1 DNase (1 unit per µg; Promega) for 40 min at 37°C. First-strand cDNA was synthesized from 5 µg of total RNA and pd(N)6 random oligonucleotides with a First-strand cDNA Synthesis Kit (Cytiva/GE-Healthcare). For PCR analyses, the RT reaction was diluted to obtain a 40 ng/µL concentration of starting RNA material. Primers were designed so as to amplify simultaneously the unspliced (Exonn forward × Intronn reverse) and spliced forms (Exonn forward × Exonn+1 reverse) in the same PCR reaction. For short introns (<250 nt), only the Exonn forward and Exonn+1 reverse primers were used.
Three microliters of the diluted RT reaction were amplified with GoTaq polymerase (Promega) in a volume of 50 µL containing 20 pmoles of each of the three primers, 200 µM dNTPs and 1.5 mM MgCl2 in 1× GoTaq buffer. Reactions were cycled 25–30 times, depending on the mRNA expression level. For very weakly expressed mRNAs, reactions were cycled up to 40 times. Primer sequences and PCR regimes are available on request. The PCR products were separated on 1.5%–2.0% agarose gels containing ethidium bromide and visualized under UV light. The gel images were digitally captured and analyzed using ImageJ software. Intron retention was calculated by dividing the signal of the unspliced form by the total (spliced + unspliced) signal.
Construction of splicing reporters
Splicing reporters were amplified from mouse genomic DNA (Slc12a4, Plcb3) or cDNA (Tsta3, Hip1r). To maintain a similar intron size in all the reporters, the Vac14 reporter was constructed by PCR recombination of two fragments lacking the central part of the original intron. In all constructs, the downstream major splice site was included because it has been reported that this improves the in vitro splicing efficiency (Wu and Krainer 1996). The different reporters were introduced into the PGEM-9Z plasmid (Promega) and sequence-verified. Following linearization of the reporters, in vitro transcription was performed with T7 RNA polymerase according to the manufacturer's instructions.
BPS swapping experiments were performed by PCR mutagenesis with oligonucleotides overlapping the Tsta3 sequences and containing either the Slc12a4 (TTCCTTAAC) or the Mapk1 (GACCTTAAC) branchpoint motif.
In vitro splicing experiments and RT-PCR analyses
Transcripts were synthesized in vitro for 2 h at 37°C with 40 units of T7 RNA polymerase (NEB) in the presence of 500 µM ATP, CTP, UTP, 200 µMGTP, 1.25 mM cap analog, 10 mM DTT, 30 units of RNasin, and 1.5 µg of linearized DNA template in the recommended transcription buffer. Following RQ1 DNase treatment, reactions were extracted with phenol-chloroform and precipitated overnight at −20°C.
In vitro splicing experiments were performed 5 h at 34°C in a 40 µL mix containing 60% HeLa nuclear extracts (Ipratech), 2.4 mM MgCl2, 2.5 mM ATP, 20 mM phosphocreatine (Sigma), 10 units creatine kinase (Sigma), 1% polyvinyl alcohol, and 10 ng of purified transcript.
For inactivation of major or minor snRNPs, reaction mixtures were preincubated 20 min at 34°C in the presence of corresponding locked nucleic acids (LNAs) before addition of the splicing substrates: LNA U2 (27–49): ATAAGAACAGATACTACACTTGA; LNA U12 (11–28): ATTTTCCTTACTCATAAG (underlined nucleotides indicate modified bases).
Following proteinase K digestion for 30 min at 37°C, RNA species were phenol-extracted and precipitated with ethanol in the presence of 1.5 µg glycogen. Unspliced and spliced products were reverse transcribed with a First-Strand cDNA Synthesis Kit (Cytiva/GE-Healthcare) using 33 pmoles of reverse primers specific for each construct. For RT-PCR analyses, the RT reaction was diluted to obtain a 0.66 ng/µL concentration of starting RNA transcript. Three microliters of RT reaction were amplified for 30 cycles with primers located in the upstream and downstream exons of each splicing reporter. Splicing efficiency was calculated by dividing the signal of the spliced form by the total (spliced + unspliced) signal.
UV cross-linking experiments
In vitro splicing reactions were assembled as described above in a final volume of 200 µL containing 75 ng of purified transcripts and in the presence of 70 µM isoginkgetin (MedChemExpress). Following a 45 min incubation at 34°C, reaction mixtures were diluted 10-fold in buffer E (12 mM HEPES-NaOH pH 7.9, 60 mM KCl, 1.5 mM MgCl2, 0.12 mM EDTA, 12% glycerol) to minimize nonspecific cross-linking and irradiated two times with UV light (wavelength 254 nm) in Stratalinker (Stratagene) at 250,000 µJ/cm2 on a six-well culture plate on ice at a distance of 10 cm from UV light. Control experiments without reporter RNAs (control beads) or where the UV cross-linking step was omitted were also performed. Following proteinase K digestion for 30 min at 37°C, RNAs were phenol-extracted and precipitated with ethanol in the presence of 1.5 µg glycogen. RNAs were resuspended in 200 µL of Dignam's buffer D (Dignam et al. 1983) and hybridized to two 5′-biotinylated oligonucleotides (10 pmoles each) specific for Tsta3 introns and 3′ exon sequences by heating at 70°C for 5 min and slow cooling at room temperature. Hybridized RNAs were captured with 150 µg MyOne Streptavidin C1 Dynabeads (Invitrogen), washed three times with 200 µL of 1× BW buffer (5 mM Tris-HCl pH 7.5, 0.5 mM EDTA, 1 M NaCl), and eluted at 70°C for 5 min in 30 µL of RNase-free water.
First-strand cDNA was synthesized from 5 µL of eluted RNA and pd(N)6 random oligonucleotides with a First-Strand cDNA Synthesis Kit (Cytiva/GE-Healthcare). For PCR analyses, one fifth of the RT reaction was amplified with primer pairs specific for U12 (Fw: 5′GGTGACGCCCGAATCCTCAC3′; Rev: 5′AGATCGCAACTCCCAGGCATCC3′) or U2 (Fw: 5′GGAGCAGGGAGATGGAATAGG3′; Rev: 5′CCTGGAGGTACTGCAATACC3′) snRNAs as well as for Tsta3 3′ exon (E2, Fw: 5′TTTGATTCAACAAAGTCAGATGGG3′; Rev: 5′GAAGGGTGTGAAACGGAAGTC3′) for normalization. The gel images were digitally captured and analyzed using ImageQuant TL software.
For semi-quantitative RT-PCR analyses, cDNA was amplified as mentioned above in the presence of 2 µCi dCTP α-32P (Hartmann Analytics; 3000 Ci/mmol) and the concentration of the corresponding nucleotide was lowered to 40 µM. One-fifth of the PCR products was separated in a 10% nondenaturing polyacrylamide gel and visualized by autoradiography at −80°C. The gel images were digitally captured and analyzed using ImageJ software.
Time course analyses of splicing reactions
Radiolabeled transcripts were synthesized as described above in the presence of 60 µCi UTP α-32P (Hartmann Analytics; 800 Ci/mmol) and the concentration of the corresponding nucleotide was lowered to 50 µM. Transcripts were gel-purified and 50,000 cpm were used for the splicing reactions. Reactions were stopped at the indicated times by quick-freezing in dry ice. Following proteinase K digestion, splicing products were extracted with phenol-chloroform, precipitated overnight at −20°C and separated in 4% and 6% denaturing (8 M urea) polyacrylamide gels. After autoradiography at −80°C, gel images were digitally captured and analyzed using ImageJ software. Signals corresponding to spliced and unspliced species were normalized according to their uridine content. Splicing efficiency was calculated by dividing the signal of the spliced form by the spliced + unspliced signal.
ACKNOWLEDGMENTS
We thank Drs. F. Rage and T. Forné for critical reading of the manuscript and helpful discussions. This study was supported by the CNRS and by a grant from the Association Française contre les Myopathies (no. 17760) to J.S.
Footnotes
-
Article is online at http://www.rnajournal.org/cgi/doi/10.1261/rna.078329.120.
- Received November 9, 2020.
- Accepted November 22, 2021.
This article is distributed exclusively by the RNA Society for the first 12 months after the full-issue publication date (see http://rnajournal.cshlp.org/site/misc/terms.xhtml). After 12 months, it is available under a Creative Commons License (Attribution-NonCommercial 4.0 International), as described at http://creativecommons.org/licenses/by-nc/4.0/.




