


The landscape of translational stall sites in bacteria revealed by monosome and disome profiling
- Tomoya Fujita1,2,
- Takeshi Yokoyama3,4,
- Mikako Shirouzu3,
- Hideki Taguchi2,5,
- Takuhiro Ito6 and
- Shintaro Iwasaki1,7
- 1RNA Systems Biochemistry Laboratory, RIKEN Cluster for Pioneering Research, Wako, Saitama 351-0198 Japan
- 2School of Life Science and Technology, Tokyo Institute of Technology, Midori-ku, Yokohama 226-8503, Japan
- 3Laboratory for Protein Functional and Structural Biology, RIKEN Center for Biosystems Dynamics Research, Tsurumi-ku, Yokohama 230-0045, Japan
- 4Graduate School of Life Sciences, Tohoku University, Aoba-ku, Sendai 980-8577, Japan
- 5Cell Biology Center, Institute of Innovative Research, Tokyo Institute of Technology, Yokohama, Midori-ku, Yokohama 226-8503, Japan
- 6Laboratory for Translation Structural Biology, RIKEN Center for Biosystems Dynamics Research, Tsurumi-ku, Yokohama 230-0045, Japan
- 7Department of Computational Biology and Medical Sciences, Graduate School of Frontier Sciences, The University of Tokyo, Kashiwa, Chiba 277-8561, Japan
- Corresponding author: shintaro.iwasaki{at}riken.jp
Abstract
Ribosome pauses are associated with various cotranslational events and determine the fate of mRNAs and proteins. Thus, the identification of precise pause sites across the transcriptome is desirable; however, the landscape of ribosome pauses in bacteria remains ambiguous. Here, we harness monosome and disome (or collided ribosome) profiling strategies to survey ribosome pause sites in Escherichia coli. Compared to eukaryotes, ribosome collisions in bacteria showed remarkable differences: a low frequency of disomes at stop codons, collisions occurring immediately after 70S assembly on start codons, and shorter queues of ribosomes trailing upstream. The pause sites corresponded with the biochemical validation by integrated nascent chain profiling (iNP) to detect polypeptidyl-tRNA, an elongation intermediate. Moreover, the subset of those sites showed puromycin resistance, presenting slow peptidyl transfer. Among the identified sites, the ribosome pause at Asn586 of ycbZ was validated by biochemical reporter assay, tRNA sequencing (tRNA-seq), and cryo-electron microscopy (cryo-EM) experiments. Our results provide a useful resource for ribosome stalling sites in bacteria.
Keywords
INTRODUCTION
Ribosomes traverse along mRNA to decode codons in coding sequences (CDSs) in mRNA. This movement is not always smooth but is instead impeded for various reasons. Ribosome pauses define the quality of proteins and the stability of mRNAs. Slowing ribosome movement can have functional or detrimental results. The beneficial and regulatory roles of ribosome pauses originate from the duration of the nascent protein to recruit widespread factors, including chaperones for protein folding (Oh et al. 2011; Han et al. 2012; Döring et al. 2017; Shiber et al. 2018; Stein et al. 2019; Zhao et al. 2021), signal recognition particles (SRPs) for membrane insertion (Walter and Blobel 1981; Mason et al. 2000; Fluman et al. 2014; Arpat et al. 2020), and components of the complex for assembly (Panasenko et al. 2019; Bertolini et al. 2021).
In contrast, severely paused ribosomes are recognized as harmful and are removed from mRNAs. The trailing ribosome reaches the leading stalled ribosome, after which a complex of the two ribosomes collides to form a unit known as a “disome.” The unique interface of the disome recruits multiple factors and leads to events such as ribosome-associated quality control (RQC) (yeast and mammals) and/or ribotoxic stress response (RSR) (mammals) (for review, see Meydan and Guydosh 2020a). RQC is specific to mRNA with a ribosome pause; RQC dissociates the stalled ribosome, degrades nascent proteins and mRNAs, and represses the loading of a new ribosome on the mRNA by blocking translation initiation (Meydan and Guydosh 2020a). On the other hand, RSR induces a cell-level response by inhibiting global translation and/or evoking apoptosis (Vind et al. 2020; Wu et al. 2020).
In cells, various factors (e.g., tRNA availabilities, RNA secondary structures, and nascent peptide-ribosome exit tunnel interactions) have been reported to slow ribosome elongation (Nakatogawa and Ito 2002; Lu and Deutsch 2008; Yanagitani et al. 2011; Brandman et al. 2012; Dana and Tuller 2012; Charneski and Hurst 2013; Pop et al. 2014; Hussmann et al. 2015; Weinberg et al. 2016; Zhang et al. 2017; Dao Duc and Song 2018; Diament et al. 2018; Ibrahim et al. 2018; Mohammad et al. 2019; Sharma et al. 2019; Arpat et al. 2020; Han et al. 2020; Meydan and Guydosh 2020b; Bhatt et al. 2021; Zhao et al. 2021). However, the prediction of pause sites has been challenging, and thus, empirical identification is a demanding task.
Techniques to identify ribosome pause sites have been developed. Integrated nascent chain profiling (iNP) (Chadani et al. 2016) monitors the accumulation of 35S-methionine-labeled polypeptidyl-tRNA, an intermediate of temporarily halted peptide growth, by retarding migration in SDS-PAGE at neutral pH because of tRNA (∼20 kDa) conjugation. Systematic application of this technique to ∼1000 genes in Escherichia coli (covering a quarter of genes in this organism) has revealed the widespread occurrence of ribosome stalling (Chadani et al. 2016). On the other hand, ribosome profiling has been a powerful and sensitive tool to measure ribosome movement along mRNA in vivo (Ingolia et al. 2009; Iwasaki and Ingolia 2017; McGlincy and Ingolia 2017). Harnessing the protection of RNA fragments by ribosomes from RNase digestion, deep sequencing of the ribosome footprints allows one to survey ribosome occupancy across the transcriptome and thus ribosome pause sites at codon resolution. Although each technique has unique and mutually complementary features, no clear picture of the ribosome pause landscape in bacteria has emerged because of the significant gaps in the results of the two approaches (Chadani et al. 2016).
To overview the landscape of ribosome pausing in E. coli, we applied disome profiling, a modified ribosome profiling for sequencing footprints generated by collided ribosomes (Guydosh and Green 2014; Subramaniam et al. 2014; Diament et al. 2018; Arpat et al. 2020; Han et al. 2020; Meydan and Guydosh 2020b; Tuck et al. 2020; Bhatt et al. 2021; Kim et al. 2021; Zhao et al. 2021). The ribosome stalling found by disome profiling further extended the list of ribosome pause sites that was overlooked in standard (or monosome) profiling. The sites identified agreed well with those found in in vitro and in vivo iNP. In addition, a subset of those sites showed puromycin resistance, indicating the halted peptidyl transfer reaction. Among the identified ribosome pause sites, we then validated ribosome stalling at Asn586 of ycbZ by biochemical assays, cryo-electron microscopy (cryo-EM), and tRNA-seq. Our study provides a fruitful catalog of ribosome stall sites in bacteria.
RESULTS AND DISCUSSION
Profiling of collided ribosomes in bacteria
Given that disome profiling is a sensitive method to survey ribosome pause sites in eukaryotes (Guydosh and Green 2014; Subramaniam et al. 2014; Diament et al. 2018; Arpat et al. 2020; Han et al. 2020; Meydan and Guydosh 2020b; Bhatt et al. 2021; Kim et al. 2021; Zhao et al. 2021), we applied this approach to bacteria. Although filtration has been a popular procedure for bacterial cell collection for ribosome profiling (Oh et al. 2011; Woolstenhulme et al. 2015; Nakahigashi et al. 2016), a recent report indicates that this method may stress E. coli to induce aberrant deacylation of a subset of tRNAs, such as tRNASer and tRNAGly, and thus ribosome stalling at those codons (Mohammad et al. 2019). To avoid this bias, we used the flash-freezing cell harvest method, which minimizes the irregular deacylation of tRNASer and tRNAGly (Mohammad et al. 2019). The disome footprints peaked at 52–60 nucleotides (nt) in length (Fig. 1A), which was almost double the size of monosome footprints (25–37 nt) generated from the same cell lysate. Similar to monosome profiling, disome footprints had 3-nt periodicity, which is a hallmark of codon-wise movement of ribosomes, as observed in metagene analysis (for 5′ end of reads) around the start codon (Fig. 1B). Thus, the disome footprint profile was reflected by the elongation process of ribosomes in cells.
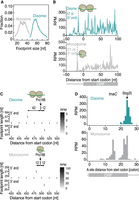
Disome footprints generated from translational pauses in E. coli. (A) Distribution of ribosome footprints from monosome and disome profiling. (B) Metagene plots of 57-nt disome footprints (top) and 27-nt monosome footprints (bottom) around the start codon. The 5′ end position of reads is plotted. (C) Tile plots for disome footprints (top) and monosome footprints (bottom) around Pro166 of secM. Their 5′ and 3′ ends of the indicated length of reads are depicted. (D) The read distribution along tnaC in disome profiling (top) and monosome profiling (bottom). The A-site position (in the case of disome, A-site of leading ribosome) of the reads is shown. The identified pause sites are indicated by an arrow.
To assign the A-site position on disome footprints, we harnessed the well-defined ribosome stalling event on the Pro166 codon on secM (Nakatogawa and Ito 2002; Muto et al. 2006; Woolstenhulme et al. 2015; Zhang et al. 2015). Here, we illustrated the 5′ and 3′ ends of disome footprints around the pause site (Fig. 1C). Given that the prominently enriched 57 nt reads originated from the disome with the leading ribosome stalled on the Pro166 codon, we deduced the offsets to the A-site as 42 nt from the 5′ end and 12 nt from the 3′ end (Fig. 1C, top). We also observed the same 3′ end offset to the A-site in monosome footprints (Fig. 1C, bottom), congruent with less variable 3′ end cleavage than the 5′ end in bacterial ribosome profiling experiments (Woolstenhulme et al. 2015).
The A-site assignment of leading ribosomes in disome footprints allowed us to detect ribosome collisions at other ribosome pause sites at sub-codon resolution. The nascent chain of tnaC (Gong et al. 2001; Bischoff et al. 2014; van der Stel et al. 2021) specifically interacts with the ribosome exit tunnel and thus ultimately halts the translocation of the ribosome at Stop25 for tnaC. We observed the prominent enrichment of disome footprints on the defined codon (Fig. 1D).
Widespread ribosome pause sites across transcriptome
Given that bacterial disome profiling precisely assigned the translation attenuator sites found by earlier studies, we explored the disome pause sites where disome footprints were enriched. Here, we calculated the “ribosome occupancy” on each codon across the transcriptome. This ribosome occupancy score is calculated by ribosome footprint counts for the given codons normalized by the average reads per codon on the transcript. The codon positions with pronounced footprint accumulation (defined as sites of the highest scores in five codons with mean + 1.5 SD or more) were surveyed (Fig. 2A; Supplemental Table 1). Earlier reports have suggested that enzymes used in library preparation may intrinsically have artificial biases (O'Connor et al. 2016; Tunney et al. 2018). However, the “disome pause sites” were associated with higher ribosome occupancy in previous monosome profiling data (Supplemental Fig. 1A; Oh et al. 2011; Woolstenhulme et al. 2015; Nakahigashi et al. 2016; Mohammad et al. 2019), irrespective of the enzymes used for library construction, ensuring the potency of the disome pause sites to slow the ribosome traversal.
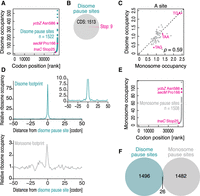
Genome-wide survey of bacterial ribosome collision sites. (A) Disome occupancies across codons. The pause sites are defined as a position of the highest scores in five codons larger than the mean + 1.5 SD. (B) Pie chart indicating the positions (CDS or stop codon) of disome pause sites defined in A. (C) Comparison of disome and monosome occupancies on A-site codons. (D) Metagene plots of disome footprints (top) and monosome footprints (bottom) around disome pause sites. (Inset) Zoomed-up view of the panel. (E) Monosome occupancies across codons. The pause sites are defined as a position of the highest scores in five codons larger than the mean + 1.5 SD. (F) Venn diagram for disome and monosome pause sites.
This characterization of disome pause sites highlighted the difference in ribosome collisions in bacteria and eukaryotes. Although disomes in yeast, humans, and zebrafish were significantly enriched on stop codons (Han et al. 2020; Meydan and Guydosh 2020b; Zhao et al. 2021), bacterial disome pause sites were not (Fig. 2B; P > 0.05; hypergeometric test). The average disome occupancy on codons also indicated a lower frequency of disomes on TAA and TAG stop codons than monosomes (Fig. 2C).
In humans and zebrafish, we observed queues of disomes upstream of disome pause sites; disome footprint peaks appeared in every ∼11 codons (i.e., a size of one ribosome) (Han et al. 2020). However, we could not find such a feature in E. coli disome pause sites (Fig. 2D, top), suggesting a limited queue of ribosomes in this species.
The eukaryotic disome was not formed in the first 12 nt of the ORF (Guydosh and Green 2014; Arpat et al. 2020; Han et al. 2020; Zhao et al. 2021), possibly because initiation factor(s) associated with scanning ribosomes or 80S on the start codon (Archer et al. 2016; Bohlen et al. 2020; Lin et al. 2020; Wagner et al. 2020) may occupy the area and block the formation of collided ribosomes. However, the bacterial disome could be formed without such a restriction, as shown in metagene analysis (Fig. 1B). Considering that the peak of the 5′ end of disome footprints upstream of the AUG codon is closely aligned to that of monosome footprints, which originated from ribosomes on AUG codon (Fig. 1B), bacterial disomes may assemble with trailing ribosomes on AUG codon. This lined up with the mechanism of AUG start codon selection in prokaryotes, which use the Shine–Dalgarno (SD) sequence (Shine and Dalgarno 1974) and do not rely on 5′ UTR scanning facilitated by the initiation factors that may occupy the first 12 nt area.
Among the various rationales attributed to ribosome pauses, duplex formation between the SD-like sequence in mRNA and the anti-SD sequence in 16S rRNA, which is docked in the chamber on the 30S ribosome subunit (Kaminishi et al. 2007), was reported to lead to slow ribosome traversal along mRNAs in bacteria (Li et al. 2012; Fluman et al. 2014). Although subsequent studies reported that the SD/anti-SD interaction has a minor contribution to ribosome pauses (Mohammad et al. 2016, 2019), we tested whether disome pause sites surveyed in this study are associated with SD/anti-SD duplex formation. As the SD/anti-SD duplex blocks trimming by RNase and results in longer monosome footprints (Mohammad et al. 2016), the SD-like G-rich sequence (e.g., UGG) resulted in the accumulation of extended footprints (and the depletion of shorter footprints) ∼20–25 nt downstream (Supplemental Fig. 1B), which corresponds to the distance between the anti-SD sequence of 16S rRNA and the A-site. However, we did not find significant enrichment of disome (or monosome as the sum of entire length reads) footprints downstream from the SD-like sequence (Supplemental Fig. 1C).
For the comparison, we also assessed the pause sites in monosome profiling data using the same criteria for disome pause sites (Fig. 2E; Supplemental Table 1). Although the monosome footprints tended to enrich the disome pause sites (Fig. 2D, bottom; Supplemental Fig. 1A), we observed that a significant fraction of disome pause sites were inconsistent with those defined by monosome profiling (Fig. 2F); some sites overrepresented disome footprints, and the other sites overrepresented monosome footprints. Indeed, the same discrepancy between disome and monosome pause sites has also been found in yeast and vertebrates (Arpat et al. 2020; Han et al. 2020; Meydan and Guydosh 2020b; Zhao et al. 2021). This finding reflects two different scenarios previously discussed (Arpat et al. 2020). Slower codons may lead to monosome accumulation at a given site and, concomitantly, to ribosome collision to form disomes, as disome pause sites are associated with more monosome footprints (Fig. 2D, bottom; Supplemental Fig. 1A). Alternatively, since frequent ribosome collision occurs, monosomes predominantly become disomes, such that monosome footprints are depleted at the sites (Fig. 2F). Both possibilities were probably cases in our bacterial disome and monosome profiling, and the balance of two scenarios ultimately determined the extent of monosome and disome footprints. Apparently, disome profiling captured the ribosome pause sites that have been overlooked by conventional monosome profiling. Thus, hereafter, we considered both monosome and disome pause sites to cover the maximum spectrum of ribosome pauses in E. coli.
We note that monosome pause sites were also not frequently found in stop codons (Supplemental Fig. 1D). The limited ribosome pauses on the stop codons showed resistance to the high salt wash (Supplemental Fig. 1E), which dissociates polypeptide nascent chain-free ribosomes from mRNAs (Zylber and Penman 1970; Blobel and Sabatini 1971; Mills et al. 2016; Saito et al. 2020), suggesting that the leading ribosomes on the stop codon were in the middle of the termination reaction.
Ribosome collision is associated with polypeptidyl-tRNA accumulation
Ribosome pausing could be associated with characteristics of amino acid sequences in nascent chains or under decoding. For example, nascent polypeptides may interact with ribosome exit tunnels and reduce the elongation reaction. Positive charge (Lu and Deutsch 2008; Brandman et al. 2012; Dana and Tuller 2012; Charneski and Hurst 2013; Weinberg et al. 2016; Dao Duc and Song 2018) and hydrophobicity (Dao Duc and Song 2018) in nascent peptides may define the ability to retard ribosome traversal; however, we did not observe such a property in nascent chains in disome and monosome pause sites (Supplemental Fig. 2A,B). Alternatively, amino acid motifs in the E-, P-, and A-sites are often associated with ribosome pausing; for instance, eukaryotic disomes are found in Pro-Pro/Gly/Asp (Han et al. 2020; Meydan and Guydosh 2020b) and Arg-X-Lys (Han et al. 2020), which provide contexts of donors and acceptors poor at peptidyl transfer (Doerfel et al. 2015; Melnikov et al. 2016; Sothiselvam et al. 2016). However, we could not observe that those motifs were not found in bacterial disome pause sites (Supplemental Fig. 2C, top), while monosome pause sites were enriched in Pro-rich contexts at the E-P-A-site (Supplemental Fig. 2C, bottom).
This led us to systematically address the ability of each site to stall ribosomes. For this purpose, we harnessed the earlier systemic iNP (Chadani et al. 2016), which surveyed ∼1000 genes in the first quarter of bacteria both in vitro and in vivo (Supplemental Fig. 3A). Despite the lack of codon resolution in iNP, the molecular weights of polypeptidyl-tRNAs detected by in vitro and in vivo iNP were in line with those predicted by pause sites found in disome profiling (Fig. 3A; Supplemental Table 2). The correspondence between disome pause sites and iNP was maintained even when we used milder or more severe definitions of the pause sites, respectively (Supplemental Fig. 3B).
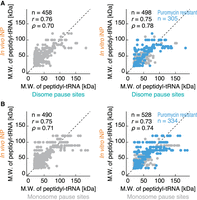
Correspondence between identified pause sites and iNP. (A) Correlation between the molecular weight (M.W.) of polypeptidyl-tRNA predicted by gel migration in in vivo (left) and in vitro (right) iNP (Chadani et al. 2016) and that identified in disome profiling (Fig. 2A). Puromycin-resistant polypeptidyl-tRNAs in in vitro iNP are highlighted in blue. (B) The same as A but for the comparison with monosome pause sites (Fig. 2E).
In theory, two distinct steps could slow ribosome elongation: decoding of the A-site codon (i.e., aminoacyl-tRNA recruitment) and peptidyl transfer/translocation. Although decoding speed has been thought to be the global rate-limiting step for ribosome traversal on codons (Hussmann et al. 2015; Mohammad et al. 2019; Wu et al. 2019), a previous systematic in vitro iNP study highlighted that deterministic ribosome pauses originated from halted peptidyl transfer reactions (Chadani et al. 2016); many pause sites were maintained even with puromycin treatment, which functions as a donor of peptidyl transfer and ultimately leads to the release of tRNA from nascent peptides. The substantial fraction of pause sites matched in in vitro iNP and disome profiling was indeed puromycin-resistant (Fig. 3A, right; Supplemental Table 2).
Of note, irrespective of the broadly different codon positions encompassed (Fig. 2F), monosome pause sites also showed correspondence with in vitro and in vivo iNP studies (Fig. 3B; Supplemental Fig. 3C; Supplemental Table 3), along with puromycin resistance. These data further supported that the integration of both monosome and disome pause sites provided a reasonable list of ribosome stalling events in cells.
Ribosomes stall on ycbZ
To follow up on the found ribosome stalling sites, we focused on the site found in ycbZ. The molecular function of the YcbZ protein remains uncharacterized, although its role in the suppression of stop codon readthrough has been suggested (Gagarinova et al. 2016). We found the remarkable presence of monosome and disome footprints at the exact same site (Pro585 at the P-site and Asn586 at the A-site, just before the stop codon) (Fig. 4A). The monosome and disome occupancy at this site was even stronger than that of well-identified Pro166 of secM (Fig. 2A,E). We validated ribosome stalling on this transcript by prominent polypeptidyl-tRNA accumulation in iNP (Supplemental Fig. 4A).
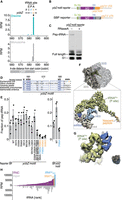
Ribosomes stall on ycbZ mRNA. (A) The footprint distribution along ycbZ in disome profiling (top) and monosome profiling (bottom). The A-site position (in the case of disome, A-site of leading ribosome) of the reads is shown. The identified pause site is indicated by an arrow. (B) Schematic representation of reporter mRNAs used in this study. (C) Western blot analysis of the translation product (probed by HA epitope) from the ycbZ motif reporter subjected to SDS-PAGE at neutral pH. RNase treatment verified the RNA conjugation. (Pep-tRNA) Polypeptidyl-tRNA. (D) Conservation of the ycbZ pause motif. The amino acid position in E. coli is shown. Mutated amino acids (tested in E) are indicated by arrowheads. (E) Mutational analysis of the ycbZ motif. The same experiments as in C were performed with ycbZ motif and SBP reporters. The quantification (mean and SD) from three replicates is shown. (F,G) Cryo-EM structure of the ycbZ-stalled ribosomes. Close-up view of the intersubunit cavity of this complex depicting the structural details of the nascent peptide-bound P-site tRNA (F). The structural model of tRNAProCGG is well fitted to the corresponding cryo-EM density. The details of the codon–anticodon recognition of P-site tRNA are shown in G. (H) Enrichment of tRNAs in the RNC formed on the ycbZ motif, as assessed by tRNA-seq. (RPM) Reads per million mapped reads.
To uncover the minimum region critical for the pause, we designed a reporter for in vitro translation. Given that the amino acid/RNA contexts around the pause sites have been reported to impede translation elongation (Nakatogawa and Ito 2002; Lu and Deutsch 2008; Yanagitani et al. 2011; Brandman et al. 2012; Dana and Tuller 2012; Charneski and Hurst 2013; Weinberg et al. 2016; Dao Duc and Song 2018), we placed 30 amino acids upstream from the pause site, which ranges from the A-site to the end of the nascent chain held within the ribosome exit tunnel, into a reporter (Fig. 4B). We also included the 3′ UTR of ycbZ in the reporter, assuming that the RNA element (e.g., the secondary structure) might perturb elongation. The translated products were detected by western blotting with a hemagglutinin (HA) tag inserted in front of the pause site. Indeed, the inserted segment of the ycbZ motif (with the 3′ UTR of ycbZ) was sufficient to drive RNase-sensitive polypeptidyl-tRNA from the reporter (Fig. 4C).
We further narrowed down the critical amino acid for ribosome pause. Considering the amino acid sequence conservation among species (e.g., Vibrio, Yersinia, Klebsiella, and Salmonella) (Fig. 4D), we performed alanine scanning mutagenesis. We found that Pro585 and Asn586, which are assumed to correspond to the P-site and A-site of the paused ribosome, respectively, are crucial for pausing translation (Fig. 4E; Supplemental Fig. 4B). Double mutations in conserved Trp579 and Leu580, which lie in a nascent peptide within the ribosome exit tunnel, also impacted ribosome stalling on this motif (Fig. 4E; Supplemental Fig. 4B). Since substitution of the 30 amino acid sequence with the unrelated tag sequence ([SBP] streptavidin-binding protein) (Fig. 4B) reduced the pause (Fig. 4E; Supplemental Fig. 4B), the 3′ UTR of ycbZ was not responsible for ribosome stalling.
Ribosomes pause at Asn586 of ycbZ
The poor conservation of critical residues for ycbZ stalling (Fig. 4D; Pro585 and Asn586) and dissimilarity of the motif to known pause sites in bacteria led us to structurally visualize the ribosomes with retarded movement on the mRNA. As the function of the YcbZ protein is unknown, the structural identification of the pause site on the mRNA should be valuable for understanding the molecular role of the protein. The ribosome-nascent chain complex (RNC) on the pause site was affinity purified using the His tag on the nascent peptide and a sucrose density gradient (Supplemental Fig. 5A–C); then, it was subjected to single-particle cryo-EM analysis (Supplemental Fig. 6A–D; Supplemental Table 4).
Direct visualization of the stalled ribosomes assigned the paused codon. The structural features of the cryo-EM density corresponding to P-site tRNA in the nonrotated 70S state were compatible with peptidyl-tRNAProCGG (Fig. 4F,G) but not peptidyl-tRNAAsnGUU; tRNAProCGG and the corresponding codon (CCG) showed higher Q-scores than a tRNAAsnGUU–AAC codon pair (Supplemental Fig. 7A), indicating that the P-site tRNA in our structure is most likely tRNAPro. Moreover, the amino acid connected to the CCA end of P-site tRNA showed good fitting to the model of Pro (Supplemental Fig. 7B). Because the CCA end was well fitted to the position of the pre-attack state (Supplemental Fig. 7C; Polikanov et al. 2014), the placement of the CCA end at the PTC may proceed normally in this pause site. Consistent with this observation, we found that the RNC complex formed on the reporter mRNA is sensitive to puromycin (Supplemental Fig. 7D), indicating that PTC per se is in an active conformation.
To gain further evidence of ribosome pause at the expected site, we investigated the tRNAs held in the stalled ribosome. Sequencing of the tRNAs within the RNC revealed that tRNAAsnGUU and tRNAProCGG, whose anticodons correspond to the A- and P-sites of codons of the pause site, were enriched in the RNC (Fig. 4H). Thus, taking the correspondence among ribosome profiling, biochemical analysis, cryo-EM analysis, and tRNA-seq, we concluded that the ribosomes translating ycbZ mRNA were stalled on Pro585–Asn586 at their P-A-sites. Given the proper peptidyl transfer suggested by the proper placement of the CCA end at PTC and puromycin reactivity (Supplemental Fig. 7C,D), the rate-limiting step on the elongation of this site should be the accommodation of A-site tRNAAsn. The inefficient/nonrigid process might explain the absence of this tRNA in the cryo-EM structure, possibly due to the drop-off during the analysis.
Our results showed that the surveys combined by monosome profiling, disome profiling, and iNP techniques provide a reliable list of ribosome stalling sites at codon resolution. The application of various cellular conditions (e.g., stresses and gene mutations) will further extend the landscape of translation elongation in bacteria.
MATERIALS AND METHODS
Ribosome profiling
Library preparation
Flash-freezing cell harvesting was conducted as previously described (Mohammad et al. 2019) with some modifications. A saturated culture of E. coli MG1655 cells, which were grown in LB media overnight at 37°C, was diluted at a 1:100 ratio into fresh LB media and grown at 37°C to an optical density at 600 nm (OD600) of 0.4–0.5. Ten milliliters of the culture was directly pipetted into liquid nitrogen. Along with ice grains of 5× modified lysis buffer (100 mM Tris-HCl pH 7.5, 750 mM NH4Cl, 50 mM MgCl2, 25 mM CaCl2, 5 mM DTT, 5% Triton X-100, 10,000 µg/mL capreomycin, and 500 µg/mL tigecycline) flash-frozen by liquid nitrogen, the frozen cell culture was pulverized using a Multibead Shocker (Yasui Kikai, MB2200[S]). After thawing at room temperature, the lysate was clarified by centrifugation at 9000g and 4°C for 10 min. The lysate was dispensed into four tubes of 13 × 56 mm polycarbonate ultracentrifuge tubes (Beckman Coulter). The 2.5 mL of lysate was layered on 900 µL of modified sucrose cushion buffer (20 mM Tris-HCl pH 7.5, 150 mM NH4Cl, 10 mM MgCl2, 1 mM DTT, 1% Triton X-100, 2000 µg/mL capreomycin, 100 µg/mL tigecycline, 20 U/mL SUPERase•In RNase Inhibitor [Thermo Fisher Scientific], and 1 M sucrose) and centrifuged at 100,000 rpm (543,000g at rmax) for 1 h with a TLA110 rotor (Beckman Coulter) at 4°C. The pellet was resuspended in modified lysis buffer (20 mM Tris-HCl pH 7.5, 150 mM NH4Cl, 10 mM MgCl2, 1 mM DTT, 1% Triton X-100, 2000 µg/mL capreomycin, and 100 µg/mL tigecycline), pooled, flash-frozen in liquid nitrogen, and stored at −80°C.
The subsequent library preparation was performed as previously described (Mito et al. 2020), with some modifications. The RNA concentration of the lysate was measured by a Qubit RNA BR Assay Kit (Thermo Fisher Scientific). Thirty-five micrograms of RNA per sample was treated with 150 U of Nuclease S7 Micrococcal nuclease from Staphylococcus aureus (Roche) for 45 min at 25°C. RNA fragments ranging from 17 to 50 nt for monosomes and 50 to 80 nt for disomes were gel-excised. Subsequent library generation was conducted as previously described (Mito et al. 2020). The Ribo-Zero rRNA Removal Kit (Bacteria, Illumina) was used to deplete rRNA contamination. The libraries were sequenced on a HiSeq 4000 (Illumina).
For high-salt wash ribosome profiling, cells were collected by filtration and then flash-frozen in liquid nitrogen. The ice grains of the cell pellet and lysis buffer (20 mM Tris-HCl pH 7.5, 150 mM NH4Cl, 10 mM MgCl2, 5 mM CaCl2, 1 mM DTT, 1% Triton X-100, and 100 µg/mL chloramphenicol) were pulverized using a Multibead Shocker (Yasui Kikai, MB2200[S]). After thawing at 4°C, the lysate was treated with Turbo DNase (Thermo Fisher Scientific) at 25 U/µL for 10 min on ice and then clarified by centrifugation at 20,000g and 4°C for 10 min. Three hundred microliters of MNase-treated lysate was mixed with 600 µL of 1.5× high-salt lysis wash buffer (20 mM Tris-HCl pH 7.5, 1.5 M KCl, 150 mM NH4Cl, 10 mM MgCl2, 1 mM DTT, 1% Triton X-100, and 100 µg/mL chloramphenicol) (final concentration of 1 M KCl) and incubated for 15 min at 4°C. The ribosome was isolated by sucrose cushion as follows. The reaction was dispensed into three 13 × 56 mm polycarbonate ultracentrifuge tubes (Beckman Coulter). Three hundred microliters of reaction in each tube was underlaid with 900 µL of sucrose cushion buffer (20 mM Tris-HCl pH 7.5, 1 M KCl, 150 mM NH4Cl, 10 mM MgCl2, 1 mM DTT, 1% Triton X-100, 100 µg/ml chloramphenicol, 20 U/mL SUPERase•In RNase Inhibitor [Thermo Fisher Scientific], and 1 M sucrose) and centrifuged at 100,000 rpm (543,000g at rmax) at 4°C for 1 h with a TLA110 rotor (Beckman Coulter) and Optima MAX-TL Ultracentrifuge (Beckman Coulter). As a control, 600 µL of lysis buffer without CaCl2 was used instead of 1.5× high-salt lysis wash buffer. The ribosome pellet was used for ribosome profiling library preparation.
Data analysis
After depleting the reads originating from noncoding RNAs, the remaining reads were mapped to the E. coli genome sequence (NC_000913.2). Empirically, we defined an A-site position, which is essentially the same as the 3′ assignment that was described previously (Woolstenhulme et al. 2015).
Ribosome occupancy was calculated as the ratio of reads at given codons to average reads per codon on the transcript. Pause sites were defined as codon positions with (i) the highest score in five codon windows, and (ii) ribosome occupancies larger than the mean + 1.5 SD. Amino acid sequences enriched around the pause sites were analyzed by kpLogo (Wu and Bartel 2017).
The predicted size of polypeptidyl-tRNA was calculated as the sum of the peptide molecular weight upstream of the identified pause site and tRNA moiety (18 kDa) and compared with the size in the systematic iNP, which was estimated by gel migration (Chadani et al. 2016).
All custom scripts are available upon request.
DNA construction
The ASKA library clones (Kitagawa et al. 2005) were kind gifts from the National Institute of Genetics (NIG), Japan. The plasmids used in this study are listed in Supplemental Table 5.
pCA24N-secM and ycbZ
DNA fragments encoding the full-length open reading frames (ORFs) of ycbZ were PCR-amplified from the MG1655 genome and inserted into pCN24A (Kitagawa et al. 2005) by In-Fusion HD (Takara). pCA24N-secM was published previously (Kitagawa et al. 2005).
pCA24N-ycbZ motif WT, I557A, E559A, R560A, I561A, W579A, L580A, W579A-L580A, E559A-R560A-I561A, I557A-E559A-R560A-I561A-W579A-L580A, I584A-P585A-N586A, P585A-N586A, P585A, and N586A
The construct was designed as described in an earlier report (Bischoff et al. 2014). DNA fragments encoding 85 amino acids of ftsQ, the human rhinovirus (HRV) 3C cleavage site, and the HA tag were inserted into pCA24N (Kitagawa et al. 2005) to be fused with the ycbZ motif followed by the 3′ UTR of ycbZ by In-Fusion HD (Takara). The mutations were introduced by site-directed mutagenesis.
pCA24N-SBP
The ycbZ motif in the pCA24N-ycbZ motif WT was substituted with the SBP sequence by In-Fusion HD (Takara).
pCA24N-ycbZ motif-triple stops
The 3′ UTR of ycbZ in pCA24N-ycbZ motif WT was replaced with the 3′ UTR sequence with tandem stop codons to generate triple stop codons.
Integrated nascent chain profiling (iNP)
In vitro transcription and translation were performed with PUREfrex 1.0 (GeneFrontier) at 37°C for 30 min following the manufacturer's instructions. The DNA fragment was amplified from pCA24N plasmids (see above and Supplemental Table 5) with primer 1 (5′-GGCCTAATACGACTCACTATAGGAGAAATCATAAAAAATTTATTTGCTTTGTGAGCGG-3′) and primer 3 (5′-AGTCAGTCACGATGAATTCCCCTAGCTTGG-3′) (Chadani et al. 2016) and used for the assay. Translated products were run on a Bolt 12% Bis-Tris Plus gel (Thermo Fisher Scientific) with Bolt MES SDS Running Buffer (Thermo Fisher Scientific). For western blotting, 35S-methionine was removed from the reaction. For puromycin treatment, the in vitro translation reaction was further incubated with 1 mg/mL puromycin (FUJIFILM Wako Chemicals) at 37°C for 5 min.
Western blot analysis
Anti-S1 (a kind gift from the Christian Spahn laboratory, 1:1000) (Duval et al. 2013) and anti-HA tag (MBL Science, M180-3, 1:1000) were used as primary antibodies. Infrared fluorescence western blotting was conducted as previously described (Iwasaki et al. 2019).
Cryo-EM single-particle analysis
Sample preparation
In vitro transcription and translation were performed as described above in “Integrated nascent chain profiling (iNP)” in 1.5-mL reaction volumes. The DNA fragment was amplified from pCA24N-ycbZ motif-triple stops. After the in vitro translation reaction, all the buffer included high Mg ions to stop translation elongation and avoid dissociation of ribosomes from the reporter mRNA. The reaction was dispensed into eight 13 × 56 mm polycarbonate ultracentrifuge tubes (Beckman Coulter). The 180 µL reaction was layered on 900 µL of modified sucrose cushion buffer (20 mM Tris-HCl pH 6.8, 150 mM NH4Cl, 50 mM MgCl2, 5 mM 2-mercaptoethanol, 0.1% [v/v] Nikkol, and 1 M sucrose) and ultracentrifuged at 100,000 rpm (543,000g at rmax) for 1 h with a TLA110 rotor (Beckman Coulter) at 4°C. The pellet was resuspended in resuspension buffer (20 mM Tris-HCl pH 6.8, 150 mM NH4Cl, 50 mM MgCl2, 5 mM 2-mercaptoethanol, and 0.1% [v/v] Nikkol) and pooled. To affinity purify the RNC, 1200 µl of TALON Metal Affinity Resin (Clontech) was equilibrated with resuspension buffer and transferred to Mini Bio-Spin Chromatography Columns (Bio-Rad). The resuspended RNC was incubated with the resin within the column for 20 min at 4°C. The column was centrifuged at 700g for 1 min and washed with a total of 5 mL resuspension buffer. The RNC complexes trapped on beads were eluted with 2.5 mL of elution buffer (20 mM Tris-HCl pH 6.8, 150 mM NH4Cl, 50 mM MgCl2, 5 mM 2-mercaptoethanol, 0.1% [v/v] Nikkol, and 250 mM imidazole pH 7.0) and further purified by sucrose cushion as mentioned above. The pellet was resuspended in resuspension buffer containing 10 mM DTT instead of 5 mM 2-mercaptoethanol. The solution was layered on top of a 10%–50% sucrose density gradient in 20 mM Tris-HCl pH 6.8, 150 mM NH4Cl, 50 mM MgCl2, 10 mM DTT, and 0.1% (v/v) Nikkol and centrifuged at 14,400 rpm (36,814g at rmax) and 4°C for 15 h with a P40ST rotor (Hitachi). The 70S fraction was pooled and concentrated by sucrose cushion as described above. Finally, the pellet was resuspended in grid buffer (20 mM Tris-HCl pH 6.8, 150 mM NH4Cl, 50 mM MgCl2, 2 mM DTT, and 0.1% [v/v] Nikkol), flash-frozen by liquid nitrogen, and stored at −80°C.
Cryo-EM grid preparation, image acquisition, and data processing
For cryo-EM grid preparation, the concentrations of ribosome specimens were adjusted to 50 nM. A 3 µL volume of ribosome specimen was applied onto Quantifoil R1.2/1.3 300 mesh Cu grids (Quantifoil) coated with a homemade thin amorphous carbon layer. Grids were glow discharged using a PIB-10 Plasma Ion Bombarder (Vacuum Device) at 5 mA for 10 sec before use. An excess amount of solution was removed by blotting with filter papers and then they were immediately plunged into liquid ethane for vitrification using Vitrobot Mark IV (Thermo Fisher Scientific). Ribosome specimens were imaged using a Tecnai Arctica Transmission Electron Microscope (Thermo Fisher Scientific) operated at 200 kV accelerating voltage and equipped with a K2 Summit direct electron detector (Gatan). Automated image acquisition was performed with the SerialEM program (Mastronarde 2005) at the nominal magnification of 23,500×, which corresponds to an objective pixel size at the specimen level of 1.47 Å. The total exposure of electrons at the specimen level was approximately 50e− Å−2 and dose fractionated into 40 frames (Supplemental Table 4). Images were recorded as movie micrographs. Image processing was performed using RELION-3 (Zivanov et al. 2018).
Details of image processing are described as follows. Motion correction was performed using the program implemented in RELION-3. Contrast transfer function (CTF) parameters were estimated by the CTFFIND4.1 program (Rohou and Grigorieff 2015). Particle picking was performed with the Gautomatch program (www2.mrc-lmb.cam.ac.uk/research/locally-developed-software/zhang-software/#gauto). The obtained 77k particles were subjected to 2D classification to discard 30S and junk particles. The remaining 63k particles were autorefined to the consensus reconstruction. The data set was subjected to 3D classification. Particles of 70S in the nonrotated state represented the major population (Supplemental Fig. 6A). This data set was further autorefined. CTF refinement, Bayesian polishing, and another autorefinement were subsequently performed. The obtained final reconstruction was performed at a resolution of 3.3 Å (Supplemental Fig. 6A,B). The local resolution distribution was calculated using the program implemented in RELION-3 (Supplemental Fig. 6D).
Model building and refinement
Initial model building was performed using University of California San Francisco (UCSF) Chimera (Pettersen et al. 2004) and Coot (Emsley and Cowtan 2004). Briefly, the 70S portion of the cryo-EM structure (PDB ID: 5AFI) (Fischer et al. 2015) was rigid-body fitted to obtain cryo-EM maps. Subsequently, tRNA (PDB ID: 5AFI) in antibiotics bonding 70S and tRNAPro (PDB ID: 6ENJ) (Huter et al. 2017) in ycbZ-stalled 70S were rigid-body fitted. These initial models were real-space refined by the phenix.real_ space_refine routine to cryo-EM maps (Adams et al. 2010). Refined final models were validated using MolProbity (Chen et al. 2010). The map versus model Fourier shell correlation (FSC) was calculated in Phenix (Supplemental Fig. 6C; Adams et al. 2010). Graphical figures were prepared by UCSF Chimera (Pettersen et al. 2004) and UCSF ChimeraX (Goddard et al. 2018). For the model-based analysis to reveal which tRNA species occupy the P-site, models of the anticodon stem–loop of tRNAAsn and the corresponding codon (AAC) were modeled. Q-scores of bases in two combinations of codon–anticodon pairs (Pro and Asn) against the obtained cryo-EM densities were calculated (Supplemental Fig. 7A; Pintilie et al. 2020).
tRNA-seq
tRNAs from in vitro translation reactions and RNCs (prepared as described above) were purified using the mirVana miRNA Isolation Kit (Thermo Fisher Scientific). The tRNA was deacylated by incubation in 100 mM Tris pH 9.0 at 37°C for 45 min. RNAs were linker-ligated, circularized, and PCR-amplified following the ribosome profiling library preparation protocol. The libraries were sequenced on a HiSeq 4000 (Illumina). Sequenced reads were mapped on the tRNA sequences provided by the genomic tRNA database (lowelab.ucsc.edu/GtRNAdb/Esch_coli_K12).
DATA DEPOSITION
The results of ribosome profiling and tRNA-seq (GEO: GSE180482 and GSE160623) obtained in this study have been deposited in the National Center for Biotechnology Information (NCBI) database. The structural coordinates (PDB: 7CPJ) and cryo-EM maps (EMDB: EMD-30431) of the ycbZ-stalled ribosome have been deposited in the Protein Data Bank (PDB) and Electron Microscopy Data Bank (EMDB), respectively.
SUPPLEMENTAL MATERIAL
Supplemental material is available for this article.
ACKNOWLEDGMENTS
We are grateful to all the members of the Iwasaki, Taguchi, and Ito laboratories for constructive discussions and technical help and critically reading the manuscript. We also thank Yuhei Chadani for technical advice on iNP, Christian Spahn and Hiroshi Yamamoto for the anti-S1 antibody, and the Support Unit for Bio-Material Analysis, RIKEN CBS Research Resources Division for technical help. ASKA library clones were obtained from the National Institute of Genetics, Japan. S.I. was supported by the Ministry of Education, Culture, Sports, Science and Technology (MEXT) (Grant-in-Aid for Scientific Research on Innovative Areas “Nascent Chain Biology,” JP17H05679; Grant-in-Aid for Transformative Research Areas [B] “Parametric Translation,” JP20H05784); the Japan Society for the Promotion of Science (JSPS) (Grant-in-Aid for Young Scientists [A], JP17H04998; Challenging Research [Exploratory], JP19K22406); the Japan Agency for Medical Research and Development (AMED) (AMED-CREST, JP21gm1410001); RIKEN (Pioneering Project “Biology of Intracellular Environments” and Aging Project); and the Takeda Science Foundation. H.T. was supported by MEXT (Grants-in-Aid for Scientific Research on Innovative Areas “Nascent Chain Biology,” JP26116002). T.I. was supported by MEXT (Grants-in-Aid for Scientific Research on Innovative Areas “Nascent Chain Biology,” JP15H01548 and JP17H05677), AMED (AMED-CREST, JP21gm1410001), and RIKEN (Pioneering Project “Dynamic Structural Biology”/“Biology of Intracellular Environments” and Aging Project). T.F. was supported by JSPS (Grant-in-Aid for JSPS Fellows, JP19J14480). This research was supported by the Platform Project for Supporting Drug Discovery and Life Science Research (Basis for Supporting Innovative Drug Discovery and Life Science Research [BINDS], JP20am0101082) from AMED. DNA libraries were sequenced by the Vincent J. Coates Genomics Sequencing Laboratory at UC Berkeley, which is supported by the National Institutes of Health (NIH) Instrumentation Grant (S10 OD018174). Computations were supported by the supercomputer HOKUSAI Sailing Ship in RIKEN. T.F. was a recipient of the RIKEN Junior Research Associate Program and a JSPS Research Fellow (DC2).
Author contributions: Conceptualization, T.F. and S.I.; methodology, T.F., T.Y., T.I., and S.I.; formal analysis, T.F., T.Y., T.I., and S.I.; investigation, T.F. and T.Y.; resources, H.T.; writing—original draft, T.F. and S.I.; writing—review and editing, T.F., T.Y., M.S., H.T., T.I., and S.I.; visualization, T.F., T.Y., T.I., and S.I.; supervision, M.S., H.T., T.I., and S.I.; funding acquisition, T.F., H.T., T.I., and S.I.
Footnotes
-
Article is online at http://www.rnajournal.org/cgi/doi/10.1261/rna.078188.120.
- Received November 17, 2020.
- Accepted November 24, 2021.
This article is distributed exclusively by the RNA Society for the first 12 months after the full-issue publication date (see http://rnajournal.cshlp.org/site/misc/terms.xhtml). After 12 months, it is available under a Creative Commons License (Attribution-NonCommercial 4.0 International), as described at http://creativecommons.org/licenses/by-nc/4.0/.
REFERENCES
MEET THE FIRST AUTHOR
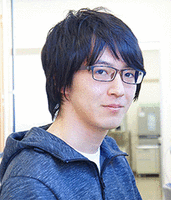
Meet the First Author(s) is a new editorial feature within RNA, in which the first author(s) of research-based papers in each issue have the opportunity to introduce themselves and their work to readers of RNA and the RNA research community. Tomoya Fujita is the first author of this paper, “The landscape of translational stall sites in bacteria revealed by monosome and disome profiling.” Tomoya did this work as a PhD student at Tokyo Institute of Technology under the supervision of Dr. Hideki Taguchi, co-mentored by Dr. Shintaro Iwasaki (RIKEN), focusing on the regulation of ribosomal traversal along mRNAs.
What are the major results described in your paper and how do they impact this branch of the field?
By applying monosome and disome profiling in bacteria, we obtained an overview of the ribosome pause sites in bacteria at a single codon resolution. This resource should be helpful for future research in the translation field.
What led you to study RNA or this aspect of RNA science?
I have been generally interested in the maturation/folding process of proteins. Learning that this process starts even before the completion of the synthesis, I was intrigued to study the translation dynamics.
During the course of these experiments, were there any surprising results or particular difficulties that altered your thinking and subsequent focus?
Techniques of bacterial ribosome profiling are still improving day-by-day. We needed to incorporate the latest methods and apply them to every experiment. This was really tough for us.
What are some of the landmark moments that provoked your interest in science or your development as a scientist?
The research environment in RIKEN, a leading research institute in Japan, really encouraged me to grow up as a scientist.
If you were able to give one piece of advice to your younger self, what would that be?
Time is always limited. We should prioritize the research plan to achieve good outcomes.
What are your subsequent near- or long-term career plans?
Since I have already changed my career path by moving to the life sciences industry, I may not directly contribute to science; however, I aspire to be a person who, in a different role, will support and help to accelerate the discovery of new and important findings.




