


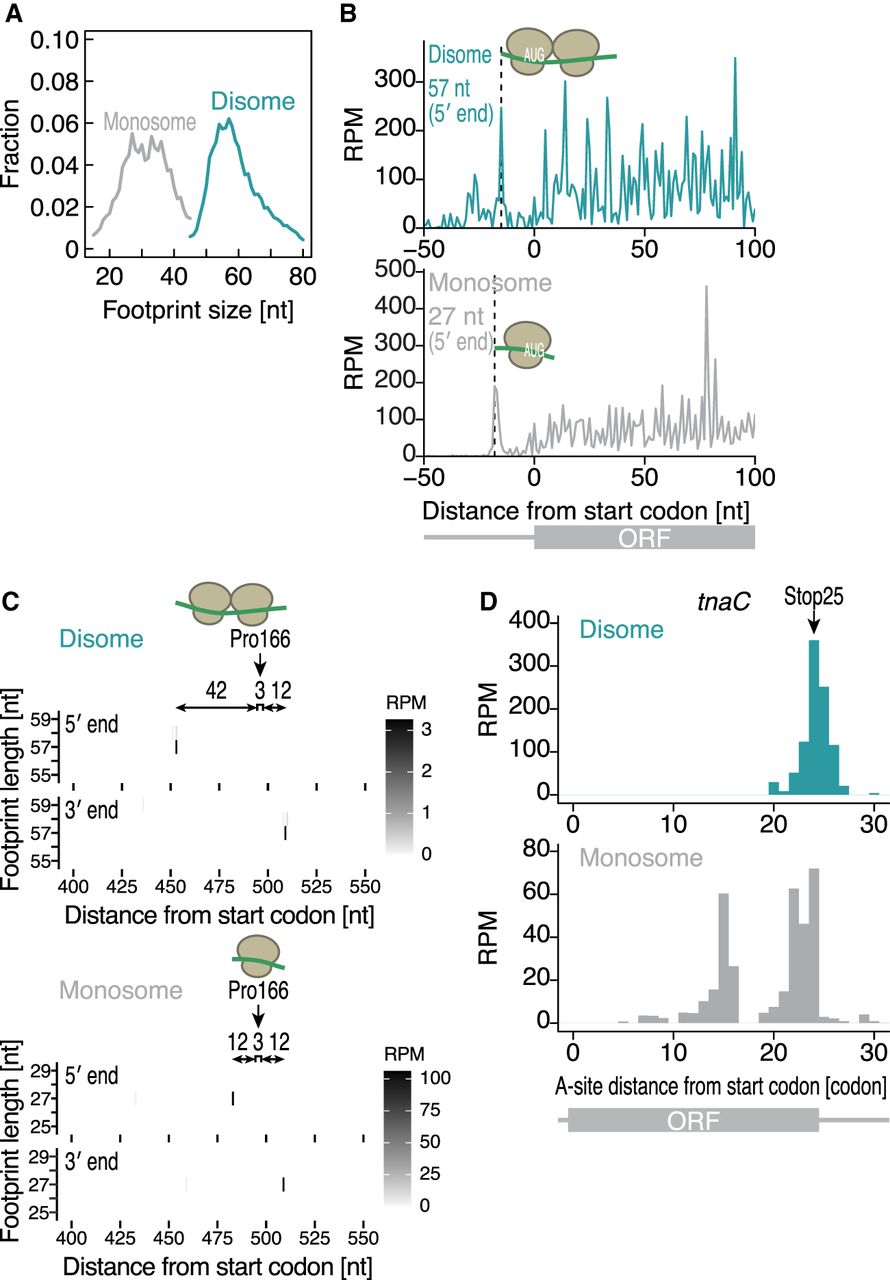
FIGURE 1.
Disome footprints generated from translational pauses in E. coli. (A) Distribution of ribosome footprints from monosome and disome profiling. (B) Metagene plots of 57-nt disome footprints (top) and 27-nt monosome footprints (bottom) around the start codon. The 5′ end position of reads is plotted. (C) Tile plots for disome footprints (top) and monosome footprints (bottom) around Pro166 of secM. Their 5′ and 3′ ends of the indicated length of reads are depicted. (D) The read distribution along tnaC in disome profiling (top) and monosome profiling (bottom). The A-site position (in the case of disome, A-site of leading ribosome) of the reads is shown. The identified pause sites are indicated by an arrow.




