


Elucidation of pathways of ribosomal RNA degradation: an essential role for RNase E
- Department of Biochemistry and Molecular Biology, Miller School of Medicine, University of Miami, Miami, Florida 33136, USA
- Corresponding author: mdeutsch{at}med.miami.edu
Abstract
Although normally stable in growing cells, ribosomal RNAs are degraded under conditions of stress, such as starvation, and in response to misassembled or otherwise defective ribosomes in a process termed RNA quality control. Previously, our laboratory found that large fragments of 16S and 23S rRNA accumulate in strains lacking the processive exoribonucleases RNase II, RNase R, and PNPase, implicating these enzymes in the later steps of rRNA breakdown. Here, we define the pathways of rRNA degradation in the quality control process and during starvation, and show that the essential endoribonuclease, RNase E, is required to make the initial cleavages in both degradative processes. We also present evidence that explains why the exoribonuclease, RNase PH, is required to initiate the degradation of rRNA during starvation. The data presented here provide the first detailed description of rRNA degradation in bacterial cells.
Keywords
INTRODUCTION
Ribosomes are generally stable in growing Escherichia coli cells. However, under conditions of starvation, the need for functional ribosomes decreases and they may become substrates for degradation (Okamura et al. 1973; Cohen and Kaplan 1977; Zundel et al. 2009). The trigger for this ribosomal degradation is an increase in free ribosome subunits generated as a consequence of reduced translation during starvation (Zundel et al. 2009). These subunits, with their exposed RNA interfaces, which otherwise would be buried inside the ribosome, now become substrates for ribonucleases. In addition, misfolded ribosomes or fully assembled ribosomes that are somehow defective also are eliminated by quality control processes in exponentially growing cells (Cheng and Deutscher 2003; Piir et al. 2011; Maivali et al. 2013).
According to the degradation pathway model originally proposed by Kaplan and Apirion (1975), rRNA is first fragmented by endoribonucleolytic cleavages, and the resulting fragments are further degraded to mononucleotides by exoribonucleases. Earlier findings from our laboratory showed that RNase II and RNase R are the main exoribonucleases that degrade the intermediate fragments produced during starvation, whereas RNase R and PNPase are most important in quality control of rRNA (Basturea et al. 2011). In the absence of these exoribonucleases, large amounts of rRNA fragments accumulate because they cannot be further degraded (Cheng and Deutscher 2003). Another major difference between the two pathways is that rRNA degradation during starvation is RNase PH-dependent, whereas this nuclease plays no role in rRNA degradation during quality control (Basturea et al. 2011). These findings suggest that the rRNA sites exposed and available for degradation may differ in the two processes. During starvation intact ribosome subunits are the substrates, whereas in the quality control process, the targets are immature or defective ribosome particles. Although the primary exoribonucleases involved in these pathways are known, the sites of the endoribonuclease cleavages and the enzymes responsible are still unknown (Deutscher 2009).
In E. coli, RNase E is an essential protein (Apirion 1978; Ono and Kuwano 1979). Its N-terminal domain contains the site-specific endonuclease activity that is sufficient for cell survival (Kido et al. 1996; McDowall and Cohen 1996), whereas its C-terminal domain is composed of an unstructured scaffold domain that serves as a platform for the degradosome complex (Callaghan et al. 2004). RNase E has multifunctional roles in many aspects of RNA metabolism including mRNA decay (Arraiano et al. 1988; Ow et al. 2000), sRNA processing and decay (Masse et al. 2003; Kim and Lee 2004), tRNA processing (Li and Deutscher 2002; Ow and Kushner 2002), and rRNA maturation (Ghora and Apirion 1978; Li et al. 1999). Thus, it plays a central role in many aspects of RNA processing and degradation; however, until now, a role in rRNA degradation had not been identified.
In this work, we examine in detail the pathways of rRNA degradation and identify RNase E as the endoribonuclease involved in initiating degradation both during starvation and in quality control. During starvation, RNase PH initiates removal of nucleotides from the 3′ end of 16S rRNA, and this process leads to endonucleolytic cleavages by RNase E. The resulting fragments are then degraded to mononucleotides by RNase R and RNase II. Likewise, RNase E cleavage is required for degradation of 23S RNA. In addition, our findings indicate that RNase E also makes the initial cut in the quality control process, but the cleavage site in 16S rRNA is different. These findings define the pathways of rRNA degradation, and show that RNase E is an important component of the degradation machinery. Based on these observations, we present a model that describes the sequence of events leading to the degradation of rRNA during starvation and as a consequence of quality control.
RESULTS AND DISCUSSION
Mapping the endoribonuclease cleavage sites in 16S rRNA during quality control
In an earlier study (Basturea et al. 2011), our laboratory found that the processive exoribonucleases, RNase R and PNPase, participate in rRNA degradation during the quality control process, whereas RNase R and RNase II are more important during starvation. In the absence of the three exoribonucleases, rRNA fragments initially generated by endoribonuclease action are not degraded further and, therefore, accumulate. To identify the sites of the endoribonuclease cleavages, we made use of a mutant strain that lacks all three processive exoribonucleases (RNase II, RNase R, PNPase) at 42°C. Accordingly, total RNA was isolated from wild-type and RNase-deficient cells that had been incubated for 4 h at 42°C in the presence (quality control) or absence (starvation) of glucose. The accumulated fragments were then analyzed by Northern blot analysis, 3′ RACE, and primer extension to identify their 3′ and 5′ termini to more accurately determine the endonuclease cleavage sites compared with our earlier work (Basturea et al. 2011).
Initially, oligonucleotide probes complementary to regions throughout 16S rRNA were used to localize the individual fragments generated by Northern analysis. During the quality control process, three fragments accumulated in the exoribonuclease mutant strain (Fig. 1A, +g lanes) that were 894, 540, and 484 nt in length. We did not observe significant accumulation of fragments in the wild-type (WT) strain nor did we detect any fragments shorter than 484 nt. The two larger fragments could be detected by probe a (complementary to residues 432–451) (left panel), whereas the smaller fragment was detected by probe f (complementary to residues 1361–1380) (right panel). The largest fragment (894 nt in length) has the mature 16S 5′ end and continues to residue 894 at its 3′ end (both mapped by RACE). This fragment most likely is generated by an endonucleolytic cleavage at residue 919, previously determined by primer extension on the downstream 484-nt product (Basturea et al. 2011), followed by trimming at the 3′ end until residue 894. The fragment 540 nt in length also has an intact 5′ end (determined with a 5′ end probe), but has residue 540 at its 3′ end (mapped by 3′ RACE). This fragment most likely arises by an additional endonucleolytic cleavage at or near residue 540. However, exonucleolytic trimming from residue 919 remains a possibility. This would require extensive 3′ shortening, and would be difficult since the major exoribonucleases are absent. It remains a possible scenario only because we found no evidence for accumulation of the downstream product that should be present if an endonucleolytic cut had occurred. The smallest fragment, 484 nt in length, results from the cleavage at position 919 since its 5′ end is residue 920, and it has been shortened from its mature 3′ end until residue 1403 (determined by 3′ RACE), a reaction previously attributed to RNase PH (Basturea et al. 2011) (see below).
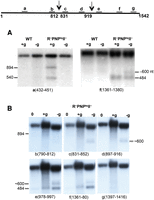
Northern blot analysis of 16S rRNA from WT and exoribonuclease-deficient cells. Total cellular RNA was extracted from cells first grown in M9/glucose at 31°C to early exponential phase (0 time) and then either starved for 4 h (−glucose) or grown for 4 h (+glucose) at 42°C. The RNA was resolved by 1% agarose gel electrophoresis, then transferred to a nylon membrane and hybridized to specific oligonucleotide probes against 16S rRNA, as indicated. (A) Oligonucleotide probes a and f were hybridized to the membrane. The probes are complementary to16S rRNA residues as indicated below each picture. (B) Probes b, c, d, e, f, and g were hybridized to the membrane. The diagram at the top (not to scale) shows the location of the probes used. Arrows represent the sites of endonuclease cleavages in 16S rRNA.
Mapping the endoribonuclease cleavage sites in 16S rRNA during starvation
During starvation at 42°C, in the absence of RNase II, RNase R, and PNPase, fragments generated by endonucleolytic cleavage accumulate and can be detected with probes from different regions of 16S rRNA (Fig. 1, −g lanes and Basturea et al. 2011). Interestingly, while the 894- and 540-nt fragments from the 5′ half of 16S rRNA were detected during the quality control process, no fragments from the 5′ half of the molecule were observed during starvation (Fig. 1A, −g lanes, left panel). These findings imply that during starvation these fragments must be very unstable and are rapidly degraded. However, two fragments from the 3′ half of 16S rRNA did accumulate (Fig. 1A, −g lanes, right panel), one fragment of ∼600 nt and the same 484-nt fragment observed in the quality control process (Fig. 1A, +g lane, right panel). The fragment ∼600 nt in length was detected with probes c, d, and e (Fig. 1B), and more detailed analysis indicated that it extends from the region between probes b and c (i.e., nucleotides 813–830) as it hybridized with probe c, but not probe b; it terminates with residue 1403 at its 3′ end (mapped by 3′ RACE). Thus, the 5′ end of this fragment apparently arises from a second endonucleolytic cut in the ∼820-nt region, whereas its 3′ end is the same as that in the 484-nt fragment, and has been shortened from the mature 3′ end.
Based on these data, it is apparent that there are significant differences in the degradation pathways of 16S rRNA between the quality control process and during starvation. The major cleavage site observed in 16S rRNA is between residues 919 and 920 in both starvation and quality control, but in starvation there is an additional cleavage in the 820-nt region. Furthermore, degradation of the resulting downstream and upstream fragments is different in each process. During starvation, the upstream fragment is rapidly degraded, whereas it accumulates in the quality control process and undergoes shortening at its 3′ end due to trimming or endonuclease cleavage. Additionally, each pathway uses a distinct subset of processive exoribonucleases to digest the downstream products.
RNase E, but not RNase G, cleaves 16S rRNA during quality control and starvation
While the exoribonucleases that participate in degradation of rRNA have already been identified, the endoribonuclease(s) responsible for initiating the process are still unknown (Cheng and Deutscher 2003). To examine this point, we first focused on strains devoid of the endoribonucleases, RNase E and/or RNase G, to determine whether either of these enzymes might be responsible for the endonucleolytic cut after residue 919 in 16S rRNA that initiates degradation in the quality control process. For this analysis, total RNA was isolated from several RNase-deficient strains after shifting to 42°C in order to inactivate the temperature-sensitive RNases, PNPase, and RNase E. The RNA was then subjected to Northern analysis using probes a and f. As shown in Figure 2A, using probe a, the 894- and 540-nt bands accumulated in all the exonuclease-deficient strains except those also carrying temperature-sensitive RNase E; in contrast, the bands were still present in the absence of RNase G. Likewise, the 484-nt band, detected by probe f, was missing in the +g lane (quality control) when RNase E, but not when RNase G, was absent (Fig. 2B). Based on these observations, we conclude that RNase E is necessary for producing the fragments generated in the quality control process, whereas RNase G is not involved.
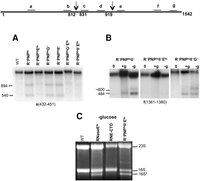
Analysis of 16S rRNA from WT and endoribonuclease-deficient cells. (A) Northern blot analysis of total cellular RNA extracted from cells first grown in M9/glucose at 31°C to early exponential phase and then for 4 h at 42°C. (B) Cells were grown at 31°C to early exponential phase (0 time) and then starved for 4 h (−glucose) or grown for 4 h (+glucose) at 42°C. Oligonucleotide probes specific to different 16S rRNA regions were used as indicated in each panel. The diagram at the top (not to scale) shows the location of the probes. (C) Total RNA was extracted from cells grown at 31°C to early exponential phase and then starved for 4 h (−glucose) at 42°C. RNA was resolved by 2% agarose gel electrophoresis and stained with ethidium bromide.
RNase E also is responsible for generating the two fragments, ∼600 and 484 nt in length, that are produced during starvation. As shown in Figure 2B, −g lanes, these fragments, detected with probe f, were absent in cells lacking RNase E, but were still observed when RNase G was absent. Thus, the two endonucleolytic cleavages that normally occur in R−PNPtsII− cells, one after residue 919, and one near residue 820, are not made when RNase E is absent. These findings support the conclusion that RNase E is responsible for both of these cleavages. Inasmuch as no cleavages were observed in either the quality control process or during starvation when RNase E was absent, it is unlikely that any other endoribonuclease participates in the initial cleavages of 16S rRNA during these degradative processes.
RNase E can act independently of the degradosome
It is known that RNase E associates with various other proteins and that these interactions may change in response to environmental conditions (Marcaida et al. 2006; Carabetta et al. 2010). For example, in stationary phase or in response to cold stress, other RNA helicases are recruited to the degradosome to replace RhlB (Khemici et al. 2004; Prud'homme-Généreux et al. 2004; Purusharth et al. 2005; Aït-Bara and Carpousis 2010). This raised the question whether the action of RNase E in 16S rRNA degradation requires only its catalytic domain or whether it needs to be assembled into the degradosome.
To address this question, we utilized a mutant strain in which the C-terminal domain of RNase E is missing (RNE-CTD). The CTD acts as the scaffold for assembly of the degradosome, but even in its absence free RNase E continues to support cell growth (McDowall and Cohen 1996). Total RNA was isolated from WT cells, from the RNase E temperature-sensitive mutant strain and from the RNE-CTD mutant strain after shifting to 42°C under starvation (−glucose) conditions. Samples were run on a 2% agarose gel and stained with ethidium bromide (Fig. 2C). In the RNase E temperature-sensitive mutant strain, we observed the accumulation of a 16S* band just under full-length 16S rRNA. Based on its migration and RNase H analysis, this band likely lacks ∼140 nt at its 3′ end and terminates near residue 1403. Removal of these residues initiates 16S rRNA degradation (Basturea et al. 2011). This band, which is generated by the initial action of RNase PH on the 3′ end of 16S rRNA, cannot be further acted upon because RNaseE is inactivated, and it therefore accumulates. Notably, the band does not accumulate in WT cells because RNase E is active. The fact that the band is also absent in the strain carrying the RNase E C-terminal domain deletion indicates that RNase E is still able to function despite the absence of its C-terminal domain. This finding strongly suggests that the action of RNase E on 16S RNA during starvation does not require its assembly into the degradosome.
RNase E also cleaves 23S rRNA during quality control and starvation
Earlier, we showed that a single endonucleolytic cleavage after residue 1942 initiated degradation of 23S rRNA (Basturea et al. 2011). While this cleavage resulted in apparently the same downstream ∼1000-nt fragment in each of the two degradative processes, the upstream fragments observed were different. In the quality control process, the upstream fragment was shortened at its 3′ end until about residue 1700, whereas during starvation the fragment was shortened only until about residue 1900 (Basturea et al. 2011). Thus, although the upstream fragment is shortened at its 3′ end in both pathways, it is much more extensive in the quality control pathway. The ∼1000-nt fragment also was degraded in a different manner in the two pathways. During starvation, only the full-length ∼1000-nt fragment was observed, whereas a number of smaller (∼100- to ∼500-nt) fragments also were detected in the quality control process (Fig. 3). These fragments all contained the 3′ end of 23S rRNA, but differed at their 5′ ends, since they all bound to the same 23S rRNA 3′ end probe h (Fig. 3A). Hence, it appears that the downstream 1000-nt region is subjected to multiple nearby endonucleolytic cleavages during quality control degradation, but not during starvation.
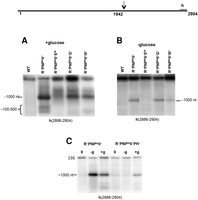
Northern blot analysis of 23S rRNA from various ribonuclease mutant strains. Total cellular RNA was extracted from cells grown in M9/glucose at 31°C to early exponential phase and then either starved for 4 h (−glucose) (B) or grown for 4 h (+glucose) (A) at 42°C. Northern analysis was carried out with probe h complementary to residues 2886–2904 of 23S rRNA. The diagram at the top shows the location of the probe. The arrow indicates the endonuclease cleavage site in 23S rRNA. Note that the WT lane in A was cut and rejoined to the other lanes in the gel. (C) Effect of RNase PH on degradation of 23S rRNA in vivo. Northern blot analysis of total RNA isolated from different strains after 4 h incubation in the presence (+g) or absence (−g) of glucose, as indicated.
To determine which endoribonuclease(s) might be responsible for the various cleavages of 23S rRNA, we analyzed RNase E, RNase G, and RNase III mutant strains, also lacking the processive exoribonucleases. Total RNA was isolated from each of these strains under +glucose or −glucose conditions at 42°C to inactivate temperature-sensitive mutants. The RNA was then subjected to Northern analysis with probe h complementary to residues 2886–2904 (Fig. 3). The cleavage at residue 1942 that generated the downstream fragment of ∼1000 nt continued to be produced in RNase III and RNase G mutant strains during quality control, but was largely absent from the strain lacking RNase E (Fig. 3A), strongly suggesting that RNase E is responsible for this cut. The small amount of material in the 1000-nt region that still remains in the RNase E-deficient strain (Fig. 3A) is likely due to product generated during the slow inactivation of RNase E at 42°C.
It is not yet clear which nuclease(s) generates the 100- to 500-nt fragments that arise from the 3′ region of 23S rRNA. Since these fragments are not observed when RNase E is absent, they likely are secondary products generated from the ∼1000-nt fragment rather than by direct cleavage of 23S rRNA. Thus, in the absence of RNase E, there is no ∼1000-nt fragment, and therefore, no substrate to generate the smaller fragments. However, it is not understood why these shorter fragments are also absent when either RNase G or RNase III is missing even though RNase E is present and the ∼1000-nt fragment accumulates.
The ∼1000-nt fragment is also generated during starvation, but Northern analysis revealed that this band is absent in a strain lacking RNase E (Fig. 3B). However, the band continues to be generated in the absence of either RNase G or RNase III (Fig. 3B). Based on these findings, we conclude that RNase E is responsible for the endonucleolytic cleavage at position 1942 in 23S rRNA in both the quality control process and during starvation. Thus, the initial step in the degradation of 23S rRNA is the same in both pathways. It is curious that the same enzyme, RNase E, that participates in rRNA maturation also is required in the rRNA degradative processes described here. This raises the interesting questions of how the assembling ribosome is protected against the degradative action of RNase E even though RNase E clearly has access to it when it serves as an rRNA processing enzyme, and secondly, what is different about ribosomes that are susceptible to degradation as a consequence of quality control when compared to those that are degraded during starvation?
The quality control process serves to remove misassembled ribosomes during the assembly process. Normally, ribosomes are stable, indicating that their RNAs are not usually exposed to the action of RNases, such as RNase E. On the other hand, by its very nature, a ribosome misassembled during the extensive biogenesis process would very rapidly become a substrate for degradation if any RNA surface were to be accessible to an endoribonuclease. In contrast, during starvation, the substrate is a fully assembled ribosome, and as we showed earlier (Zundel et al. 2009), it can become susceptible to degradation when diminished translation ultimately leads to an increase in ribosome subunits that have exposed RNA interfaces accessible to RNases. Thus, in each pathway of rRNA decay, susceptibility to RNase action is directly related to altered ribosome structure.
RNase PH initiates rRNA degradation during starvation
We previously identified an unexpected role for the exoribonuclease, RNase PH, in the degradation of rRNA during starvation (Basturea et al. 2011). When RNase PH is present, the 3′ end of 16S rRNA is shortened, and based on the 3′ RACE analysis described above, ∼140 residues are removed, stopping at nt 1403. In the absence of RNase PH, degradation of 16S and 23S rRNA is extremely limited (Fig. 3C; Basturea et al. 2011). To gain a better understanding of the role of RNase PH in the degradative process, and to determine whether RNase PH can act directly on the RNA substrate, we examined RNase PH action on ribosomes and rRNA in vitro.
Ribosomes were isolated from cells lacking RNase PH that had been starved at 42°C. They were treated with purified RNase PH at 0.5 mM Mg2+, a condition in which ribosomes would dissociate into subunits. Northern blot analysis (Fig. 4A) revealed that under these conditions RNase PH removed only ∼20 nt from the 3′ end of 16S rRNA. Trimming of the 3′ end also occurred at 1 mM Mg2+, but at 2 mM or 5 mM Mg2+, 3′ trimming did not proceed (Fig. 4B), suggesting that purified RNase PH can act only on 30S subunits, not intact 70S ribosomes, to remove ∼20 nt. In addition, since 3′ RACE indicated that both the ∼600-nt and 484-nt fragments that accumulate during starvation end at residue 1403, these findings indicate that either another RNase removes the residues between nucleotides 1403 and ∼1520 or that RNase PH digests further in vivo than it can in vitro. At present, the identity of such a putative RNase remains unknown, but since no 3′ end fragment of ∼120 nt was detected, it is more likely that the residues are removed by an exoribonuclease. However, as shown in Figure 2C, the fact that 16S* lacking the 120 nt accumulated even in the absence of RNase II, RNase R, and PNPase indicates that these exoribonucleases are not involved. It should be noted that only ∼20 nt were removed from 16S rRNA in vitro regardless of whether the source of ribosomes were cells growing in the presence of glucose at 30°C or 42°C or whether the cells were RNase PH+ or RNase PH−. Also of interest is that the 20-nt fragment removed by RNase PH includes the anti-Shine–Dalgarno sequence. Its removal would affect 30S ribosome subunit interactions with most mRNAs, thereby preventing reassociation into 70S ribosomes, which might hasten the ribosome degradation that ensues.
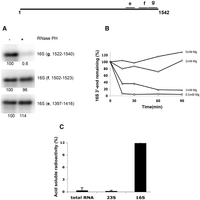
Action of RNase PH on ribosomes in vitro. Purified ribosomes were treated with RNase PH as described in Materials and Methods. (A) Ribosomes were incubated at 0.5 mM Mg2+ in the absence (lane 1) or in the presence (lane 2) of 2.5 µg of RNase PH, and Northern blot analysis was carried out with probes complementary to different regions near the 3′ end of 16S rRNA, as indicated. The number below each band indicates the percentage of intensity compared to the band in the absence of RNase PH, which was set at 100. (B) RNase PH was incubated with 70S ribosomes in the presence of varying concentrations of Mg2+. The action of RNase PH on the 3′ end of 16S rRNA was monitored by Northern analysis using probe g (complementary to nucleotides 1522–1540). The data indicate the change in band intensity compared to the intensity prior to incubation with RNase PH. One representative experiment from those repeated multiple times is shown. (C) In vitro degradation of isolated RNA by RNase PH as described in Materials and Methods. The presence of acid-soluble radioactivity released from [32P] RNA is presented. Radioactivity released in the absence of RNase PH has been subtracted.
Interestingly, degradation of 23S rRNA in vivo also is dependent on the presence of RNase PH (Fig. 3C, −g lanes), despite the fact that there is no shortening of its 3′ end as there is with 16S rRNA. Thus, as shown in Fig. 3C (−g lane), the ∼1000-nt fragment derived from 23S rRNA hybridizes to the 3′ end probe even when RNase PH is present, indicating that its 3′ end has not been removed. The resistance of 23S rRNA to the action of RNase PH extends even to free RNA in vitro (Fig. 4C). In contrast to 16S rRNA, which is quite sensitive to RNase PH, 23S rRNA is unaffected based on a sensitive acid-soluble assay of 32P-labeled RNAs. It should be noted that the low level of degradation of total RNA (Fig. 4C), even though the sample contains 16S rRNA, is due to trapping of RNase PH by its preferred substrate, tRNA, which constitutes the majority of RNA molecules in the total RNA sample due to its much smaller size. Based on these in vitro data, the involvement of RNase PH in ribosome degradation during starvation is limited to action on 16S rRNA, and any effect on 23S rRNA is indirect. Nevertheless, these data indicate that RNase PH has the ability to directly act on 16S rRNA in 30S subunits, and thereby lead to initiation of rRNA degradation during starvation.
What remains to be explained is how removal of ∼20 residues from the 3′ end of 16S RNA by RNase PH ultimately leads to endonucleolytic cleavages by RNase E that result in complete breakdown of both 16S and 23S rRNA. It is known that stacking and packing interactions between RNA helices in 16S RNA generate three domains and one 3′ minor domain in the 30S subunit (Wimberly et al. 2000). The long, extended 3′ minor domain consists of two helices encompassing residues 1397–1542 and occupies the major part of the 30S–50S subunit interface. We find that in the presence of RNase PH, essentially the complete minor domain (residues 1404–1542) is removed. As a consequence, RNA packing in the two ribosome subunits would be greatly altered, exposing residue 919 in 16S rRNA and residue 1942 in 23S rRNA to the action of RNase E leading to the endonucleolytic cleavages observed. If correct, this analysis would explain why initiation of the degradation pathway is RNase PH dependent and why 23S rRNA degradation is PH dependent even though the RNase does not directly act on this rRNA. This analysis also implies that in vivo RNase PH can act on 70S ribosomes, in contrast to what was observed in vitro. This may be due to factors present in vivo that facilitate its action or to the fact that starvation was carried out at 42°C, which might open the ribosome sufficiently to enable RNase PH to act on 70S particles.
Another question raised by these findings is how the removal of only ∼20 nt from the 3′ end of 16S rRNA, based on in vitro studies of RNase PH action, ultimately leads to removal of the complete minor domain. We do not believe that the reaction could be carried out by RNase PH itself since the minor domain is highly structured. However, it is known that RNase PH can digest small stretches of structured RNA (Jain 2012), and perhaps together with an RNA helicase, it could accomplish the task in vivo. Alternatively, the reaction could be carried out by an endoribonuclease that cleaves at residue 1403. If so, we would expect that the structured minor domain fragment would accumulate since the exoriboncleases that could act on such a fragment, RNase R and PNPase, are absent in the strains used. These considerations suggest either that some factor works together with RNase PH to help it digest the minor domain or that an endoribonculease cleaves at residue 1403 and the released fragment is digested by an as yet unknown mechanism. Further studies will be needed to resolve this point.
The studies presented here, and summarized in Scheme 1, provide a detailed description of the degradation pathways of rRNA in the quality control process and during starvation, and they identify RNase E as the endoribonuclease that carries out the cleavages that initiate both processes.
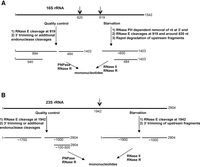
Summary of the pathways for rRNA degradation. (A) 16S rRNA; (B) 23S rRNA. Shown are the sequence of events and the enzymes involved in the degradation of rRNA due to the quality control process or due to starvation.
MATERIALS AND METHODS
Materials
Oligonucleotide primers were synthesized and purified by Sigma Genosys. Taq DNA Polymerase, T4 RNA ligase, and bacteriophage T4 polynucleotide kinases were purchased from New England Biolabs, Inc. M-MLV Reverse transcriptase was from Promega and [γ-32P] ATP was from PerkinElmer Life Sciences. All other reagent grade chemicals were from Sigma.
Bacterial strains
E. coli MG1655*(seq) I−, which is RNase PH+, was considered to be wild type for this study; MG1655 I− is the RNase PH− counterpart (Basturea et al. 2011). These were the recipient strains into which RNase R, RNase II, PNPase, and RNase E mutations were introduced by P1 transduction (Yancey and Kushner 1990; Basturea et al. 2011). The RNase E C-terminal domain deletion mutant strain was obtained from Dr. Chaitanya Jain (University of Miami).
In vivo assay for ribosome degradation
Cultures were grown in 50 mL of M9 minimal medium containing 0.4% glucose supplemented with 0.1 mM uridine. The cultures were initially grown at 31°C to an A600 of 0.2. Cells were collected by centrifugation for 15 min in a Sorvall SS34 rotor at 7000 rpm. The cell pellet was washed twice with M9 salts to remove glucose and resuspended in 50 mL of M9 salts. One 20 mL portion was taken and incubated with shaking at 42°C in the absence of any carbon source for 4 h (starvation sample). A second 20 mL portion supplemented with 0.4% glucose, was incubated for 4 h at 42°C (quality control sample). After 4 h, samples were harvested for total RNA isolation. The remaining 10 mL were retained as zero time controls. The experiments were carried out at 42°C to inactivate temperature-sensitive RNases (PNPase and RNase E), when necessary. Total RNA was extracted from equal volumes of culture by hot phenol/chloroform treatment and precipitated with ethanol (Huang and Deutscher 1992). Electrophoresis and Northern analysis is carried out as described in Basturea et al. (2011).
RACE analysis
Eighty picomols of oligo RCL1 (5′-GCTGCAAGGTGACGTACTGG-3′) was phosphorylated using T4 polynucleotide kinase and [γ-32P] ATP and ligated to 10 µg of total RNA using T4 RNA ligase as previously described (Liu and Gorovsky 1993). For RT-PCR, 2 µg of oligo RCL1-treated total RNA was used for first-strand cDNA synthesis by M-MLV in the presence of oligo RCL2 (5′-CCAGTACGTCACCTTGCAGC-3′). RCL2 and a 16S gene-specific forward primer (oligonucleotide from the 223–242 region of 16S rRNA to map the 540-nt end; from the 500–519 region to map the 894-nt end; from the 1130–1160 region to map the 1403-nt end) were used for 3′ end amplification and the PCR product was sequenced.
Preparation of substrates for RNase PH in vitro reactions
RNase PH−, II− cells were grown in M9 minimal medium with 0.4% glucose and harvested when the A600 was about 0.6. They were washed and placed in M9 without glucose for 4 h at 42°C and were pelleted at 6000 rpm for 10 min. Cell pellets were washed in 1× TBS buffer containing 10 mM Mg(OAc)2 and resuspended in 2 mL buffer A (20 mM HEPES pH 7.5, 60 mM NH4Cl, 10.5 mM Mg(OAc)2, 0.5 mM EDTA, 10 mM mercaptoethanol) per gram of wet cell pellet. The paste obtained was passed three times through a French press at 18,000 psi to lyse the cells. To remove the cellular debris, the lysate was centrifuged at 16,000 rpm for 30 min in a SS-34 Sorvall rotor. Two units of DNase I were added to the supernatant fraction to remove DNA. The sample was kept on ice for 15 min and then centrifuged in a Beckman 60 Ti rotor at 32,000 rpm for 4 h. The ribosome pellet was resuspended in buffer B (buffer A plus 1M NH4Cl) by gentle rocking, and then centrifuged through an 18% sucrose cushion in buffer B for 18 h at 44,000 rpm in a Beckmann 60 Ti rotor. The pellet was resuspended in either buffer B, quickly frozen in liquid nitrogen and stored at −80°C, or in buffer C [same as buffer A, but 2 mM Mg(OAc)2] to separate the ribosomal subunits. The 50S and 30S particles were obtained by centrifugation in a 10%–30% sucrose gradient in buffer C in a Beckman SW28 rotor at 21,000 rpm for 18 h. Subunits were collected, concentrated by centrifugation through an Amicon Ultra filter, quickly frozen in liquid nitrogen and stored at −80°C. RNA from the subunits was extracted by the phenol–chloroform procedure. 32P-labeled ribosomes were obtained from cells grown in media supplemented with 1 µCi/mL of [32P] phosphate as previously described (Zundel et al. 2009)
In vitro RNase PH reaction
In vitro RNase PH activity was measured according to the degradative assay described in Kelly and Deutscher (1992). Reaction mixtures contained 50 mM Tris–C1, pH 8.0, 50 mM KCl, 15 mM NaP04, and 2 µg of RNA substrate. Usually, 2.5 µg of purified enzyme was added and samples were incubated for 30 min at 37°C. Five mM MgCl2 was added to the reaction, unless otherwise indicated. Nucleic acid was then precipitated and separated on an agarose gel as described above, prior to Northern blot analysis with a probe specific for the 3′ end of the 16S rRNA.
To determine the action of RNase PH on [32P]-labeled RNA substrates, we measured the phosphate-dependent release of radioactivity into the trichloroacetic acid-soluble fraction. Following incubation, an equal volume of ice-cold 20% TCA was added to stop the reaction and precipitate RNA. After 15 min on ice, samples were centrifuged at 15,000 rpm for 15 min in a refrigerated tabletop Eppendorf centrifuge. Half of the supernatant fraction was removed and added to 10 mL of scintillation fluid. Samples were counted in a scintillation counter to determine the amount of released radioactivity. In all cases activity in the absence of Pi was subtracted so that only Pi-dependent activity was determined.
ACKNOWLEDGMENTS
We thank Dr. SK. Tofajjen Hossain for help with the Northern analysis in Figure 2B and members of the laboratory and Dr. Arun Malhotra for comments on the manuscript. This work was supported by Grant GM16317 from the National Institutes of Health.
Footnotes
-
Article published online ahead of print. Article and publication date are at http://www.rnajournal.org/cgi/doi/10.1261/rna.056275.116.
- Received February 9, 2016.
- Accepted May 12, 2016.
This article is distributed exclusively by the RNA Society for the first 12 months after the full-issue publication date (see http://rnajournal.cshlp.org/site/misc/terms.xhtml). After 12 months, it is available under a Creative Commons License (Attribution-NonCommercial 4.0 International), as described at http://creativecommons.org/licenses/by-nc/4.0/.




