


RNA secondary structure mediates alternative 3′ss selection in Saccharomyces cerevisiae
- Mireya Plass1,5,
- Carles Codony-Servat2,
- Pedro Gabriel Ferreira1,3,
- Josep Vilardell2,4 and
- Eduardo Eyras1,4,6
- 1Universitat Pompeu Fabra (UPF), 08003 Barcelona, Spain
- 2Molecular Biology Institute of Barcelona (IBMB), 08028 Barcelona, Spain
- 3Centre for Genomic Regulation (CRG), 08003 Barcelona, Spain
- 4Catalan Institution of Research and Advanced Studies (ICREA), 08010 Barcelona, Spain
Abstract
Alternative splicing is the mechanism by which different combinations of exons in the pre-mRNA give rise to distinct mature mRNAs. This process is mediated by splicing factors that bind the pre-mRNA and affect the recognition of its splicing signals. Saccharomyces species lack many of the regulatory factors present in metazoans. Accordingly, it is generally assumed that the amount of alternative splicing is limited. However, there is recent compelling evidence that yeast have functional alternative splicing, mainly in response to environmental conditions. We have previously shown that sequence and structure properties of the pre-mRNA could explain the selection of 3′ splice sites (ss) in Saccharomyces cerevisiae. In this work, we extend our previous observations to build a computational classifier that explains most of the annotated 3′ss in the CDS and 5′ UTR of this organism. Moreover, we show that the same rules can explain the selection of alternative 3′ss. Experimental validation of a number of predicted alternative 3′ss shows that their usage is low compared to annotated 3′ss. The majority of these alternative 3′ss introduce premature termination codons (PTCs), suggesting a role in expression regulation. Furthermore, a genome-wide analysis of the effect of temperature, followed by experimental validation, yields only a small number of changes, indicating that this type of regulation is not widespread. Our results are consistent with the presence of alternative 3′ss selection in yeast mediated by the pre-mRNA structure, which can be responsive to external cues, like temperature, and is possibly related to the control of gene expression.
Keywords
INTRODUCTION
Splicing is the mechanism by which introns are removed from pre-mRNA to create a mature transcript. In higher eukaryotes, this process involves, apart from the core machinery of the spliceosome, many auxiliary factors such as SR proteins or hnRNPs, which can enhance or block the recognition of splicing signals (Jurica and Moore 2003). These factors allow the modulation of the splicing reaction and thus, the existence of alternative splicing. In contrast to what happens in higher eukaryotes, yeast species do not have so many auxiliary factors (Plass et al. 2008; Schwartz et al. 2008). This reduces the number of possible regulatory mechanisms and makes splicing more dependent on the properties of the pre-mRNA sequence. In the case of the budding yeast Saccharomyces cerevisiae, the rules for 5′ splice site (5′ ss) and branch site (BS) recognition are well understood (for review, see Madhani and Guthrie 1994). In contrast, there is still controversy about the exact mechanisms implicated in 3′ splice site (3′ss) recognition. Budding yeast lacks the U2AF heterodimer, which is crucial for 3′ss recognition in higher eukaryotes (Wu et al. 1999); hence, in theory, any CAG, TAG, or AAG (HAGs) accessible to the spliceosome and at the right distance from the BS could function as a 3′ss. A scanning mechanism from the BS onward has been proposed for 3′ss selection (Smith et al. 1993), although not always the first AG downstream from the BS is used. On the other hand, several cis-acting factors have been found to influence 3′ss selection in yeast. For instance, a U-rich tract seems to promote the usage of more distant AGs (Patterson and Guthrie 1991), but still it is not clear whether this is subject to regulation.
In addition to splicing factors, regulation of 3′ss selection can be achieved by taking advantage of the flexibility of the nascent pre-mRNA. It has been shown that the structure adopted by pre-mRNAs could affect splice site recognition in humans (Hiller et al. 2007; Shepard and Hertel 2008; Warf et al. 2009). In yeast, RNA secondary structures have been shown to influence 5′ss recognition by shortening the 5′ss–BS distance in yeast (Rogic et al. 2008). More recently, a number of cases have been described for which pre-mRNA secondary structure is key for understanding 3′ss selection, since it can maintain the 3′ss at the right distance from the BS and modulate the accessibility of 3′ss to the spliceosome (Gahura et al. 2011; Meyer et al. 2011). These works have suggested the existence of general rules that would put into context previous findings about the role of RNA structures on 3′ss selection (Deshler and Rossi 1991; Goguel et al. 1993). In the present work, we have integrated these rules into a computational predictive model, which we have applied at the genome scale, and show that they can explain most of the known 3′ss in yeast. Moreover, we show that the same rules apply to the selection of alternative 3′ss, as we are able to predict and experimentally validate a number of them.
We have, thus, integrated sequence and secondary structure information of all intron-containing pre-mRNAs in yeast to generate a computational predictive model of 3′ss selection using a Machine Learning (ML) approach (Mitchell 1997). ML methods estimate relationships from the data, allowing integration of multiple features and the generation of testable predictions. These methods have been employed in a variety of biological problems (Larranaga et al. 2006) and more recently have been instrumental in the construction of a splicing code from a large number of sequence features (Barash et al. 2010). Our model is based on Support Vector Machines (SVMs), which are supervised learning algorithms that, given a set of features and a binary classification (e.g., positive and negative cases), find the combination of features that provides an optimal separation between the instances of the two classes (see, e.g., Ben-Hur et al. 2008). SVMs are widely used in computational biology and have been shown to achieve high accuracy in a variety of problems, including the prediction of splice sites (Sun et al. 2003; Yamamura and Gotoh 2003; Zhang et al. 2003; Sonnenburg et al. 2007) and alternative exons (Dror et al. 2005).
Our SVM classifier, which uses various properties recognized to be important for 3′ss selection, including the secondary structure of the pre-mRNA, can explain over 90% of the annotated canonical 3′ss. Furthermore, we have used it to identify new alternative splicing events in the S. cerevisiae genome in coding and 5′ untranslated regions and have validated experimentally a number of them. Additionally, by generating SVM classifiers at different temperatures, we are able to predict changes in 3′ss selection. Taken together, our results show that sequence and structural properties of the pre-mRNA in yeast are sufficient to explain the selection of the majority of constitutive 3′ss. Moreover, we also show that these properties allow uncovering of novel alternative 3′ss and characterizing the modulation of 3′ss selection by temperature.
RESULTS
Secondary structures help explain 3′ss selection
We built an SVM classifier using as a positive set all possible AAG, TAG, and CAG (HAGs) annotated as real 3′ss (282), and as negatives, all cryptic 3′ss, i.e., all nonannotated intronic (97) and exonic (11,527) HAGs (Materials and Methods). The sequence features considered for the classification were the splice site sequence, the pyrimidine content between the BS and the 3′ss, and the distance to the polypyrimidine tract (PPT). Additionally, we considered the accessibility of the candidate 3′ss, which is related to the secondary structure of the pre-mRNA. In order to simulate normal growth conditions, we considered the structural properties of the sequence at 22°C (Materials and Methods). The effective distance between the BS and the HAG, calculated by subtracting the number of base positions contained in the optimal secondary structure (Materials and Methods), was not used as a feature to build the classifier but as a filter, as we have shown in a recent work that there is a maximum effective distance beyond which the HAG is never used as a 3′ss (Meyer et al. 2011; see Supplemental Table S1).
The difference in the number of positive and negative cases represents a very unbalanced training set, which can have detrimental effects on the performance of the model. To avoid this, a total of 10,000 SVM models were created in which, for each model, we sampled randomly 200 positive and 200 negative cases for training. Each of these models was used to score all other HAGs not used for training (11,506) and to classify them as positive or negative, using zero as the score cut-off. Thus, each HAG was classified as positive or negative ∼10,000 times. Since the scores of the individual SVM models are not comparable, to make predictions, we defined a global score (score1) for each HAG as the proportion of SVM models in which the HAG was classified as positive. Applying this scoring scheme, the SVM classifier attains a high overall accuracy, with an area under the ROC curve (AUC) of 0.9809 (Fig. 1A). Moreover, using a threshold of 1, i.e., selecting only HAGs that were classified as positive by all SVM models, our method is able to predict correctly 92% of real 3′ss (261/282), with <3% of false positives (315/11,889). However, the precision of the method, i.e., the proportion of true positives among all the cases predicted as positive, is 0.45 (Fig. 1B); that is, we obtain more false positives than true positives. We show below that this is improved using a different scoring scheme.
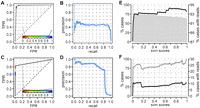
Evaluation of the classifier at 22°C. (A) Receiving Operating Characteristic (ROC) curve of the SVM classifier using scoring scheme score1 (see text). For each threshold of the score, the true positive rate (TPR) and false positive rate (FPR) values are represented in the x- and y-axes, respectively. The distribution of values for positive cases (dark gray) and negative cases (light gray) together with the color scale for the different thresholds used can be seen at the bottom of the graph. (B) Precision-recall curve of the SVM classifier using score1. In the precision-recall curve, the TPR (recall) is represented in the x-axis, whereas the y-axis shows the precision, i.e., number of true positive cases for a given threshold over the total amount of cases predicted as positive. (C) ROC curve and (D) precision-recall curve for the SVM classifier using scoring scheme score2 (see text). (E,F) Cumulative distributions of predicted 3′ss that are validated by RNA-Seq reads obtained at 22°C, for annotated (E) and cryptic (F) 3′ss. The left y-axis represents the percentage of 3′ss that have a score2 higher than or equal to that given on the x-axis (gray bars). The right y-axis scale represents the percentage of cases with a score2 higher than or equal to that given on the x-axis and that can be validated using RNA-Seq reads that also validate the annotated 5′ss (black line) or that may validate other 5′ss (gray line).
To understand the relative contribution of the different features used to build the SVM to distinguish between positive and negative cases, the information gain of each of the features in the 10,000 SVMs was measured (Materials and Methods). We found that the feature that contributes the most to the classification is the BS–3′ss distance followed by the polypyrimidine content, the distance to the PPT, and the 3′ss score. The accessibility, which measures how the RNA structure, on average, exposes or hides a 3′ss, appears the least informative of the features (Supplemental Fig. S1A). Nonetheless, the usage of the accessibility improves the performance of the SVM classifier as compared to using only the other features (see Supplemental Data; Supplemental Table S2). Additionally, building classifiers for each of the features, we observe that although the accessibility shows an accuracy lower than the other features, it still can explain by itself a number of real 3′ss (Supplemental Fig. S1B).
Alternative splicing prediction
One of the goals of this work is to use our computational classifier to identify new alternative 3′ss. We expect that a small number of cases in our negative set may, in fact, be alternative 3′ss. According to our SVM classification, these candidate alternative 3′ss should resemble real 3′ss; hence, they would appear as false positives. However, using score1, we obtain 2.6% false positives, which corresponds to 315 possible candidate alternative 3′ss. It is reasonable to expect that the number of candidates will be smaller; hence, we should select a smaller subset of the most likely ones. Accordingly, to predict alternative 3′ss, we changed the scoring scheme such that greater relevance is given to the false positive rate (FPR), rather than to the true positive rate (TPR). With this scoring scheme, the main goal is, therefore, not to recover as many annotated 3′ss as possible but to select potential new 3′ss with high specificity. We thus defined a new scoring scheme, score2, as the proportion of models in which a HAG was classified as positive, but fixing the FPR for each individual SVM at 0.5% (Materials and Methods). Using score2, the overall performance of the SVM classifier is lower than using score1 (AUC = 0.9105), but we get a better separation of positive and negative cases with high scores (Fig. 1C). We considered a threshold of 0.9936 for score2, i.e., only those HAGs that were classified as positive in 99.36% of the 10,000 SVM models and at a FPR of 0.5% were selected. With this threshold, we obtained a high precision (0.83), maintaining a reasonable amount of true positives (TPR = 0.59) (Fig. 1D) and predicting only a small fraction of cryptic HAGs as positives (34 cases; FPR = 0.0029). These HAGs represent the subset of negatives that are most similar to the annotated ones and, hence, were considered as alternative 3′ss candidates (Table 1).
Alternative 3′ss candidates
Validation of predicted alternative 3′ss
We used RNA-Seq reads obtained at 22°C (Yassour et al. 2009; Table 2) to validate the predicted alternative 3′ss (Materials and Methods). Interestingly, we found a direct relation between score2 and the proportion of cases validated by RNA-Seq reads (Fig. 1E,F). Moreover, the percentage of nonannotated HAGs that can be validated at any score cut-off is much lower than that of real 3′ss (Fig. 1E,F). On the other hand, considering the threshold of 0.9936 for score2, i.e., keeping only the candidate alternative 3′ss, 10 out of the 34 predicted cases (30%) are validated by RNA-Seq reads (Table1). This represents a fivefold enrichment over all HAGs predicted as negative (706 cases validated with RNA-Seq reads, i.e., 6% of all negative cases) (Supplemental Fig. S2). In contrast to the annotated 3′ss, we observed that several alternative 3′ss are validated by RNA-Seq reads that also validate an alternative 5′ss (Fig. 1F), suggesting a relation between 5′ and 3′ alternative splice site selection.
RNA-Seq data sets
We selected 13 of the predicted candidate alternative 3′ss for experimental validation by RT-PCR, indicated in Table 1. We used different yeast strains and conditions to ensure the detection of the possible splice site variants (Materials and Methods). From these cases, two of them did not show splicing activity in the conditions tested (BUD25 and YJR079W). From the other 11 cases, we validated two of them. One of them corresponds to an intronic alternative 3′ss in VPS75 (Fig. 2), which codes for a histone chaperone (Han et al. 2007; Selth and Svejstrup 2007). The other case is an exonic alternative 3′ss in the ribosomal protein gene RPL26B (Supplemental Fig. S3). To the best of our knowledge, these two cases of alternative splicing have not been reported before in previous analyses of splicing variation in yeast (Davis et al. 2000; Preker et al. 2002; Juneau et al. 2007, 2009; Pleiss et al. 2007; Yassour et al. 2009; Bergkessel et al. 2011; Hossain et al. 2011). Some of the negative cases were shown before to have splicing variation different from alternative 3′ss selection: HMF1 and REC102 were shown before to be specifically spliced during meiosis (Juneau et al. 2007); and PTC7, with two introns, has been shown to produce two mRNAs upon retention of the first intron (Juneau et al. 2009). For UBC13, we detected the annotated but not the alternative 3′ss (data not shown). Interestingly, the CAG predicted as an alternative 3′ss has been recently reported to be used upon disruption or weakening of a putative structure in the region covering the BS and the annotated 3′ss (Gahura et al. 2011).
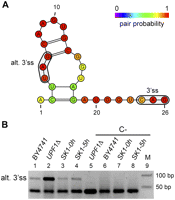
Experimental validation of a predicted alternative 3′ss in VPS75. (A) Predicted optimal secondary structure between the BS and the annotated 3′ss for the VPS75 gene, discarding the 8 nt after the BS A. The 3′ss and the alternative 3′ss (alt. 3′ss) tested are boxed in the picture. The color of the nucleotides represents the pair probability of the bases in the optimal secondary structure. For nucleotides outside the secondary structure, the color represents the accessibility of the nucleotide (one-pair probability) in the same scale. (B) RT-PCR validation of the alternative 3′ss of the VPS75 gene using specific primers in different yeast strains and conditions. Lanes 1–4 show the RT-PCR product of the alternative 3′ss using RNA from strains BY4741 (lane 1), UPF1Δ (lane 2), and SK1 at time zero of meiosis (lane 3) and after 5 h (lane 4) (Materials and Methods). Lanes 5–8 show the corresponding negative controls without AMV reverse transcriptase. Lane 9 contains the markers, with the corresponding lengths indicated on the right. Bands corresponding to the alternative and annotated 3′ss are indicated. The band for the alternative 3′ss appears in all the conditions tested, although it is more highly expressed in UPF1Δ.
Identification of constitutive and alternative 3′ss in 5′ UTR regions
We considered the predictions on an independent set by applying our method to yeast 5′ UTR introns, as these were not used for training. SGD only contains 24 5′ UTR annotations with introns (Supplemental Table S3). Applying our classifier using score1, we were able to predict correctly 87% of the real 3′ ss with only 2% false positives. In order to obtain candidate alternative 3′ss, we used score2 and the threshold defined above (0.9936) for predicting alternative 3′ss. In this case, we could recover 17 out of the 24 (71%) known 3′ss, and only three of the cryptic ones (0.3%) as positives, all of them having RNA-Seq reads supporting them (Table 3). Interestingly, a predicted alternative intronic 3′ss in the 5′ UTR of the ribosomal protein gene RPS22B has 43 reads validating it (Table 3). We experimentally validated this case (Supplemental Fig. S4), which was also reported in Yassour et al. (2009) based on RNA-Seq data. We also validated a predicted alternative 3′ss in the 5′ UTR of MTR2 (Fig. 3), which codes for a regulator of mRNA transport (Santos-Rosa et al. 1998). Interestingly, the validated site coincides with one of the alternative 3′ss reported before upstream of the open reading frame of MTR2 (Davis et al. 2000), which defines an intron that, upon mutation, produces lethality (Parenteau et al. 2008). These results confirm that our classifier is able to distinguish real from false 3′ss and that it can be used to predict new alternative 3′ss.
Alternative 3′ss candidates predicted in 5′ UTR regions
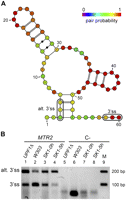
Experimental validation of a predicted alternative 3′ss in the 5′ UTR in MTR2. (A) Predicted optimal secondary structure between the BS and the annotated 3′ss, discarding the first 8 nt after the BS A, in the 5′ UTR of the MTR2 gene. The 3′ss and the alternative 3′ss (alt. 3′ss) tested are boxed in the picture. The color of the nucleotides represents the pair probability of the bases in the optimal secondary structure. For nucleotides outside the secondary structure, the color represents the accessibility of the nucleotide (one-pair probability) in the same scale. (B) RT-PCR validation of the splicing pattern of the MTR2 gene in different yeast strains. Lanes 1–4 show analyses of MTR2 using RNA from strains UPF1Δ (lane 1), W303 (lane 2), and SK1 at time zero of meiosis (lane 3) and after 5 h (lane 4) (Materials and Methods). Lanes 5–8 show the corresponding negative controls without AMV reverse transcriptase. Lane 9 contains the markers, with the corresponding lengths indicated on the right. Bands corresponding to the alternative and annotated 3′ss are indicated. The band for the alternative 3′ss appears in the strains UPF1Δ and W303 and during meiosis (SK1-0 h and SK1-5 h).
Effects of temperature on 3′ss selection
We have shown so far that the properties of the secondary structure of the pre-mRNA affect 3′ss selection and can be used to predict alternative 3′ss. Interestingly, the structures adopted by the pre-mRNA can be subject to modulation, as changes in RNA polymerase transcription rate or temperature, among others, can affect their formation and stability (Pan and Sosnick 2006; Bevilacqua and Blose 2008; Chen 2008; Mahen et al. 2010; Meyer et al. 2011) and consequently regulate 3′ss selection in yeast. In particular, we have recently described one case where the pre-mRNA secondary structure of one gene is modified by temperature changes, modulating 3′ss selection (Meyer et al. 2011). Accordingly, we analyzed the impact of temperature changes on 3′ss selection at genomic scale using our computational model by comparing 3′ss predictions obtained at 22°C with the predictions under heat-shock conditions (37°C).
We found that, for annotated 3′ss, the maximum effective distance is the same under both conditions even though the effective length distributions differ significantly (Wilcoxon signed rank test P-value < 0.001) (Fig. 4A; Materials and Methods). At 37°C, the accessibility of HAGs is significantly higher than at 22°C for real 3′ss and exonic HAGs (Wilcoxon signed rank test P-value = 4.086 × 10⁻⁵ and P-value < 2.2 × 10⁻¹⁶, respectively). However, no significant differences were found for intronic HAGs (Fig. 4B). The higher accessibility of real 3′ss at 37°C indicates that the ability of the spliceosome to recognize some 3′ss may, indeed, depend on temperature. To test this hypothesis, we rebuilt our classifier using the properties of HAGs at 37°C, simulating heat-shock conditions (see Supplemental Tables S5, S6).
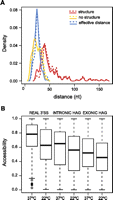
Effective distance and accessibility properties of 3′ splice sites. (A) Comparison of BS-3′ss length distribution at 22°C (continuous) and 37°C (dashed lines). The plot shows the length distribution of BS-3′ss regions with a secondary structure (red) and for those without a predicted secondary structure (yellow). In the cases in which a secondary structure is predicted, the distribution of the effective distances is also shown (blue). (B) Box plots representing the accessibility distributions at 22°C and 37°C for real 3′ss, intronic HAGs, and exonic HAGs. Accessibility values are shown on the y-axis, which can vary between 0 (always covered by a secondary structure) and 1 (never covered by a secondary structure).
Using the scoring scheme score1, the overall performance of the classifier at heat-shock conditions is similar to the one obtained at 22°C (AUC = 0.981) (Supplemental Fig. S5A). In this case, 93% of the real 3′ss are correctly classified by all SVM models, with 2.7% false positives, which is similar to the results obtained at 22°C. Moreover, the positive predictive value (PPV) is the same as obtained before (Supplemental Fig. S5B). In these conditions, the predictions on the 5′ UTR intron set were also very similar to those at 22°C, as we predicted correctly 91% of the known 3′ss in the 5′ UTR (22/24), with only 2.6% of false positives. The relative contribution of the features to the final classification is also similar to 22°C except for the accessibility, which shows a slightly more important contribution (Supplemental Fig. S1).
We then used scoring scheme score2 to predict alternative 3′ss, using a threshold of 0.9833, such that the FPR is the same as at 22°C (FPR = 0.0029). Using this threshold, we predicted a total of 34 alternative sites; 31 of them were already present at 22°C (Table 1) and three were specific of 37°C (Table 4). Moreover, we predicted four alternative sites in 5′ UTR regions, three of which are shared at the two temperature conditions (Tables 3, 4).
Alternative 3′ss candidates predicted only under heat-shock conditions
We used RNA-Seq reads obtained at heat-shock conditions from Yassour et al. (2009) (Table 2) to validate the predicted 3′ss (Materials and Methods). As before, we found a direct relation between the classifier score and the proportion of cases validated by RNA-Seq reads (Supplemental Fig. S5E,F). Moreover, two of the alternative 3′ss predicted only at 37°C are validated by RNA-Seq reads (Table 4). On the other hand, the proportion of cases validated by RNA-Seq reads at any given score is lower than at lower temperatures, probably due to the fact that there was only one RNA-Seq library available for heat-shock conditions (Supplemental Figs. S2, S5E,F).
Comparing the predictions at the two temperatures, we found four alternative 3′ss that are only predicted at 37°C (three in CDS regions and one in a 5′ UTR) (Table 4). These differences can only be related to changes in nucleotide accessibility, which is determined by the properties of the secondary structure of the pre-mRNA. Interestingly, one predicted case in the CDS of gene RPL23B has RNA-Seq reads and an EST supporting it (Table 4). We experimentally tested the three cases predicted in the coding region (Table 4). For MCM21, we detected the annotated 3′ss but found no usage of the candidate alternative 3′ss. In the case of YLR211C, which codes for a protein of unknown function (Davis et al. 2000), we validated an alternative 3′ss predicted in the exon downstream from the annotated 3′ss. This alternative 3′ss is predicted to be less available at 22°C (Fig. 5A) (average accessibility, 0.8981; relative accessibility, 0.8128) than at 37°C (average accessibility, 0.9493; relative accessibility, 0.9880). Experimental validation shows that the alternative 3′ss is used more than the annotated one (Fig. 5B). Moreover, the relative difference of usage of both sites decreases with temperature in strain BY4741 but not for UPF1Δ (Fig. 5B). This could indicate than the annotated site might not be the constitutive site, as it is less used than the predicted alternative 3′ss. Although the shape of the optimal structure predicted in the region between the annotated and the alternative 3′ss does not change, the stability of the structure and the probability of the pairings decreases with temperature (Fig. 5), hence, allowing other suboptimal conformations. We also validated the alternative 3′ss predicted in RPL23B. In this case, we see that the 3′ss is also present at all temperatures tested (Supplemental Fig. S6). The secondary structure predicted changes at high temperatures, increasing the accessibility of both the annotated and the alternative 3′ss (Supplemental Fig. S6A). Our results are, thus, in agreement with the usage of the 3′ss being modulated through the secondary structure of the RNA by temperature changes.
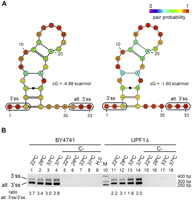
Experimental validation of an alternative 3′ss modulated by temperature in YLR211C. (A) Predicted optimal secondary structure between the BS and the alternative 3′ss predicted at 22°C (left) and at 37°C (right) for the YLR211C gene, discarding the first 7 nt after the BS A. The 3′ss and the alternative 3′ss tested (alt 3′ss) are boxed in the picture. The color of the nucleotides represents the pair probability of the bases in the secondary structure. For nucleotides outside the secondary structure, the color represents the accessibility of the nucleotide (one-pair probability) in the same scale. Even though the optimal secondary structure does not change, the stability of the optimal secondary structure decreases with temperature (ΔG 22°C = −4.98 kcal/mol; ΔG 37°C = −1.60 kcal/mol). Furthermore, a difference in the accessibility of the nucleotides from the alternative 3′ss can be observed, as calculated in Materials and Methods (see text) or as calculated from the optimal structure (average accessibility at 22°C, 0.948; accessibility at 37°C, 0.973). (B) RT-PCR validation of the splicing pattern in the YLR211C gene in two different yeast strains and at different temperature conditions. Cells were grown at the specified temperature for at least three duplications. The picture shows the RT-PCR analyses of YLR211C using RNA from strains BY4741 (lanes 1–9) and UPF1Δ (lanes 11–18). Lanes labeled with C− correspond to the negative controls with no AMV reverse transcriptase. Lane 10 contains the markers, with the corresponding lengths indicated on the right. Below, we include the rate per lane of the proportions of mRNA for the predicted alternative 3′ss over the annotated 3′ss.
DISCUSSION
In this work, we have integrated in a computational model a number of empirical rules for 3′ss selection in yeast based on the sequence and structural properties of the pre-mRNA. This model correctly recovers the majority of real 3′ss in CDS and 5′ UTR regions at a low false positive rate, indicating that these rules are, indeed, quite general. Moreover, these results indicate that a reduced number of sequence features may be sufficient to identify real 3′ss in yeast. If we analyze the contribution of the different features used for classifying the 3′ss, we observe that the most informative one is the distance between the BS and the 3′ss, followed by the pyrimidine content (Supplemental Fig. S1). Interestingly, previous experimental work has found these two features to be important for 3′ss selection (Cellini et al. 1986; Patterson and Guthrie 1991; Smith et al. 1993; Luukkonen and Seraphin 1997). Considering the results obtained, we conclude that, in the majority of yeast introns, 3′ss selection may not require the presence of extra cis regulation, which is consistent with the fact that regulatory splicing factors are effectively missing in yeast (Plass et al. 2008; Schwartz et al. 2008).
We have gone beyond canonical 3′ss selection and proposed that the same rules may describe selection of alternative sites. Accordingly, candidate alternative 3′ss were considered to be among the cryptic 3′ss sites that most resemble real sites. These candidate alternative sites are enriched for evidence by RNA-Seq reads compared to other cryptic sites. Interestingly, in several cases, the alternative 3′ss are validated by RNA-Seq reads that also support an alternative 5′ss (Fig. 1F). This suggests that these alternative 3′ss may be involved in more complex splicing patterns, which would entail the selection of two alternative intron boundaries. Additionally, some of our predictions were previously reported as alternative 3′ss (Davis et al. 2000; Yassour et al. 2009; Gahura et al. 2011), which adds support to our proposed model, where pre-mRNA secondary structure aids 3′ss selection. Nonetheless, most of the splicing variation reported so far in yeast (Davis et al. 2000; Preker et al. 2002; Juneau et al. 2007, 2009; Pleiss et al. 2007; Yassour et al. 2009; Bergkessel et al. 2011; Hossain et al. 2011) corresponds to intron retention events and not to alternative 3′ss selection and, hence, could not be recapitulated using our model. Using various yeast strains and conditions, we are able to experimentally validate a number of candidate alternative 3′ss, further supporting our predictive model and confirming the existence of alternative 3′ss selection in yeast.
Secondary structure has been shown before to play a role in the recognition of some introns by the spliceosome (Deshler and Rossi 1991; Charpentier and Rosbash 1996; Gahura et al. 2011; Meyer et al. 2011), and structural features have been shown previously to aid in the computational prediction of splice sites (Patterson et al. 2002; Marashi et al. 2006). However, these computational methods only included information from a predicted optimal structure and did not contemplate a mechanistic hypothesis in the predictive model or the possibility of alternative 3′ss selection. Our model uses the accessibility of the HAG, which summarizes the secondary structure properties of the pre-mRNA, and the effective distance to the BS, which is also determined by the structure. Moreover, our genome scale analysis and experimental validation of predicted sites is consistent with a mechanism of 3′ss selection whereby the secondary structure maintains the 3′ss at the right distance from the BS and modulates the accessibility of 3′ss to the spliceosome.
We have also explored the impact of temperature on 3′ss selection, as this can affect the structural properties of the sequence surrounding the 3′ss (Bevilacqua and Blose 2008; Chen 2008). Although BS–3′ss distance and pyrimidine content are the most informative features for 3′ss selection, accessibility is the only feature that can change with temperature; hence, it is essential to describe temperature-dependent splicing. We, indeed, observed that the accessibility of 3′ss is higher at heat-shock conditions (Fig. 4B). Therefore, we predicted that high temperatures will facilitate the usage of alternative 3′ss that may be less available at lower temperatures due to the secondary structure of the pre-mRNA, allowing the regulation of 3′ss in a temperature-dependent manner. Our genome-wide analysis of the predictions at heat-shock conditions shows a small number of differences, which agrees with the lower information gained by using accessibility as a predictor (Supplemental Fig. S1). This indicates that the effect of temperature in splicing is probably subtle and not widespread. As the formation of the RNA structure is a stochastic process, our model predicts that a temperature increase makes alternative conformations more probable, increasing the accessibility of HAG sites. Although we did not test experimentally the expected quantitative change, we validated the annotated and a predicted alternative 3′ss for the genes YLR211C (Fig. 5) and RPL23B (Supplemental Fig. S6), in agreement with a role of the secondary structure in the modulation of 3′ss selection.
It remains to be determined the functional consequences of our findings. The predicted alternative 3′ss selection is likely to occur at a low abundance, as we had a low rate of validation and three of the six validated cases can only be observed experimentally using specific primers. Furthermore, the validation of the alternative 3′ss by RNA-Seq reads shows that the usage is considerably lower than that of the corresponding annotated 3′ss. The possibility remains that our predictions are used at a frequency below our detection limits or become activated at conditions different from the ones used. Nonetheless, we found that most of the predicted alternative sites introduce a PTC that enlarges the 3′ UTR of the gene (Table 1). It is known that in yeast the mRNA levels of genes containing 3′ UTRs longer than average are regulated by nonsense-mediated decay (NMD) (Kebaara and Atkin 2009); hence, most of the predicted alternative sites will likely trigger the degradation of the resulting transcripts by NMD (Amrani et al. 2004). In the three cases in which no PTC is introduced, the alternative site produces a deletion that corresponds to a conserved region in all the homologous proteins found in database searches (see Supplemental Material), suggesting that the protein products resulting from the alternative 3′ss selection may be inactive. Additionally, motif analysis of the resulting mRNA sequences after the 3′ss variation predicted in 5′ UTRs did not indicate the disruption or creation of regulatory motifs (see Supplemental Material), suggesting that the variation at the 5′ UTR does not produce functional changes. All these pieces of evidence indicate that the majority of alternative 3′ss predicted will either be innocuous or produce nonfunctional mRNAs that will be degraded. Recent works have shown that NMD coupled to alternative splicing (AS) or unspliced mRNAs can regulate mRNA levels (Neu-Yilik et al. 2004; Lareau et al. 2007; Pan et al. 2008; Sayani et al. 2008; Hansen et al. 2009). Moreover, it has also been shown that, since many alternative splicing events trigger NMD, there is an underestimation of the extent of splicing variation (Baek and Green 2005). All this can partially explain the low number of reads found validating the alternative 3′ss predicted and the low validation rate obtained by RT-PCR. Thus, our findings suggest a possible role of the alternative 3′ss in the regulation of gene expression through NMD.
We conclude that sequence properties are sufficient to define the splicing outcome for the majority of 3′ss in yeast. Furthermore, our results are consistent with the existence of variation in 3′ss selection that is mediated by the pre-mRNA structure, which can be responsive to external cues, like temperature, and which is possibly related to the control of gene expression.
MATERIALS AND METHODS
Data sets
The annotation and genomic sequence for S. cerevisiae were downloaded from the Saccharomyces Genome Database (SGD July 2009; Engel et al. 2010). All introns from chromosomal genes (327) were extracted, and only those that had length > 0 nt, canonical splice sites (GT or GC at the 5′ss and AG at the 3′ss), and did not have any ambiguous nucleotide (N) in the sequence were kept, resulting in a final set of 282 introns.
To predict branch sites, every intron was scanned for NNNTRACNN motifs up to 200 nt upstream of the 3′ss. Those with the smallest Hamming distance to the TACTRACNN sequence were predicted as BS. When several motifs with identical Hamming distance were found, an additional selection based on potential base-pairing to U2 snRNA was applied using RNAcofold (Hofacker 2009), forcing the branch site A to be not paired. If several motifs had the same potential, the closer to the 3′ss was selected. All the considered introns thus contain a canonical 3′ss and a BS sequence within 200 nt upstream of the 3′ss. In this set, all HAGs (AAG, TAG, and CAG) were collected such that they were located between 10 nt downstream from the BS and the end of the downstream exon, and their effective distance was smaller than 52 nt (see below), as these are the minimum distance and maximum BS–3′ss effective distance, respectively, for a 3′ss to be recognized (Meyer et al. 2011). Additionally, using the SVM described below, we verified that using this effective distance cut-off improves the prediction accuracy (see Supplemental Material). These HAGs were then classified as real (282) if they were annotated 3′ss, intronic (97) if they were not annotated as 3′ss and were located between the BS and the annotated 3′ss, and exonic (11,527) if they were located in the downstream exon.
To build the 5′ UTR intron test set, the 24 annotated 5′ UTR exons from SGD were extracted. 5′ UTR introns are annotated in SGD only as a pair of coordinates, corresponding to the 5′ss and 3′ss coordinates, with no indication of the exact coordinates for the flanking exons. For these introns, we considered the downstream exon to start after the annotated 3′ss of the UTR and to end at the next downstream 5′ss annotated. All these introns thus contain a canonical 3′ss and a branch site sequence predicted as described above. From this set, all HAGs were collected such that they were located between 10 nt downstream from the BS and the end of the downstream exon, having an effective distance < 52 nt, resulting in 24 annotated 3′ss, nine intronic HAGs, and 1075 exonic HAGs. 5′ UTR introns were not included in the set used to build the SVM.
Effective distance
The effective BS–3′ss distance was defined as the linear distance (in nt) between the BS and the 3′ss after removing the optimal secondary structure. More specifically, all the bases that were part of a structured region were removed, leaving only the two bases corresponding to the beginning and the end of the structured region. For each intron, the sequence between the BS and the 3′ss was recovered, discarding both signals. From this region, the first 8 nt after the BS A were further removed, as previous work shows that these nucleotides cannot belong to a secondary structure (Meyer et al. 2011). In the selected region, an optimal secondary structure was predicted using the program RNAfold from the Vienna package (Hofacker 2009) with default parameters and setting the temperature at 22°C or 37°C. Effective distances calculated from optimal structures represent the most frequent value of the distribution of effective distances obtained when suboptimal structures are considered (Meyer et al. 2011).
Support Vector Machine classifier
In order to model annotated 3′ss and to predict candidate alternative 3′ss, a SVM was built using a linear kernel with the program Gist2.3 (Pavlidis et al. 2004; http://svm.sdsc.edu). A binary classification of HAGs into positive (functional 3′ss) and negatives (nonfunctional 3′ss) was considered. All real 3′ss (282) were taken to be the positive set, whereas all HAGs labeled as intronic (97) or exonic (11,527) were taken to be the negative set. We used the intronic and exonic HAGs as a negative set, as we expect that the majority of them would be true negatives as there is no evidence available of their usage. In order to avoid a biased training due to the unbalanced size of the training data sets, a total of 10,000 SVM models was calculated. For each SVM, 200 positive and 200 negative cases were sampled randomly for training. Each of the SVM models was then used to score all other HAGs not used for training (11,506) and to classify them as functional or nonfunctional 3′ss according to their score, using zero as a cut-off value. Since the scores of the individual SVM models are not comparable, a score (score1) was defined for each HAG as the proportion from the 10,000 SVM models for which the HAG was classified as positive using a cut-off value of zero for each of the 10,000 SVMs.
For the prediction of alternative 3′ss, a second score (score2) was proposed, which was defined as the proportion of models in which HAG was classified as positive but fixing the FPR at 0.5%. That is, for each of the 10,000 SVMs, we used the individual SVM cut-off value to be such that only 0.5% of the nonannotated HAGs were classified as functional 3′ss; i.e., only 0.5% of false positives were allowed per SVM model. The score2 scheme ensures that the classification was made at a fixed FPR = 0.5%.
The features selected to build the Support Vectors of each of the 3′ss analyzed were the following:
-
Splice site sequence: Each HAG (AAG, CAG, and UAG) is scored using the log2-rate of their frequency in the set of annotated 3′ss relative to their frequency in the negative set.
-
Distance to the BS: For each HAG, the distance to the predicted BS is measured. This is defined as the number of nucleotides between the A of the BS and the HAG, including the last position. Using this definition, TACTAACACNNNNTAG would represent a distance of 10 nt.
-
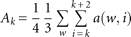
Accessibility: Accessibility is defined as the probability of a nucleotide not being paired with any other nucleotide, i.e., one minus the pair probability. Pair probabilities were calculated using the program RNAfold (Hofacker 2009). The accessibility Ak of a HAG is calculated as the average of the accessibilities of each of the nucleotides in the HAG, a(w,i), i=k,k+1,k+2, in four different windows w of lengths d, d+5, d+10, d+15, where d is the BS-HAG distance discarding the first 8 nt after the BS A (see above):
 Then for each HAG, the relative accessibility Ak(R) was calculated by normalizing the accessibility to the power of two to the maximum accessibility in the intronic and exonic
region around the same annotated 3′ splice site:
Then for each HAG, the relative accessibility Ak(R) was calculated by normalizing the accessibility to the power of two to the maximum accessibility in the intronic and exonic
region around the same annotated 3′ splice site:
-
Polypyrimidine content: The polypyrimidine content was measured as the proportion of pyrimidines in the region between 7 nt downstream from the A of the BS to the nucleotide upstream of the analyzed 3′ss.
-
Distance to the PPT: Polypyrimidine tracts between the BS and each HAG were predicted using the heuristic method defined in Clark and Thanaraj (2002). In the case that more than one PPT was predicted for a given HAG, the closest one was kept. The distance to the PPT was defined as the number of nucleotides between the end of the PPT and the HAG, without including them. The score for this feature was defined as the log10 of this distance. When no PPT could be identified by the method, the maximum distance possible (the distance between the BS and the 3′ss minus 6) was considered.
Information Gain measurement
For each of the 10,000 SVMs generated (at 22°C and at 37°C), the Information Gain  was calculated for each of the attributes used for classification using the WEKA software (Hall et al. 2009). For each of the attributes
  , the corresponding values were discretized using a minimum description length (MDL) method (Grünwald 2007). The information gain of each of the attributes
  with respect to the set of labeled elements
  is calculated as follows:
 where
where  is the subset of
  that have a particular value
  for attribute A, and
  is Shannon's entropy:
 where
where  is the proportion of cases from the set
  that are classified with the i-th value; in this case,
  .
.
Analysis of S. cerevisiae RNA-Seq reads
The RNA-Seq data from Yassour et al. (2009) at 22°C and 37°C (Table 2) were used to validate our predictions. Reads were mapped against the S. cerevisiae genome (SGD July 2009) (Engel et al. 2010) using GEM-mapper (http://gemlibrary.sourceforge.net), allowing two mismatches and with default parameters. Reads that did not map to the genome were then used to find candidate splice-junctions using GEM split-mapper (http://gemlibrary.sourceforge.net). This tool splits the reads into two parts and tests all possible mapping combinations. In this case, for reads of length 36, the split-point ranges between 10 and 27, and, at most, one mismatch was allowed in each part of the read. Moreover, the consensus motifs GT-AG and GC-AG for the splice site dinucleotides were provided to GEM split-mapper to narrow down the search space of the mapping. Additionally, the split-mapping was done using a maximum of one mismatch position in the read sequence, and only reads with one split-mapping were selected. Reads were then clustered into putative splice-junctions, and the total number of reads supporting each junction was reported.
Experimental validation of predicted alternative 3′ss sites
Various yeast strains were used to test splicing: two normal strains with different genetic background:
-
W303: MATa ade2-1 can1-100 his3-11,15 leu2-3,112 trp1-1 ura3-1
-
BY4742: MATα his3Δ1 leu2Δ0 met15Δ0 ura3Δ0
a mutant strain for the gene UPF1, which would allow detection of those products that would be degraded by the nonsense-mediated decay pathway:
-
UPF1Δ: MATa, his3Δ1, leu2Δ0, met15Δ0, ura3Δ0, ymr080cΔ::KAN+; (Openbiosystems YSC1053, #6214)
and the strain SK1, to detect splicing during meiosis:
-
SK1: MATa/α lys2 ho::LYS2 ura3 arg4 leu2 trp1
SK1 was used as two of the tested genes, REC102 and HFM1, are only processed during meiosis. Moreover, there have been earlier reports of splicing changes during meiosis (Juneau et al. 2007; Munding et al. 2010).
UPF1Δ, BY4742, and W303 yeast strains were exponentially grown in YPD (yeast extract, peptone, and dextrose). The SK1 strain was inoculated in 50 mL of YPA (yeast extract, peptone, and acetate) and grown for 13–14 h with vigorous shaking. Cells were harvested, washed with H2O, and resuspended in the same volume (50 mL) of 2% KAc to induce meiosis (t = 0). Aliquots were removed at 0 and 5 h.
To measure the effects of the temperature on 3′ss selection, yeast strains BY4742 and UPF1Δ were grown overnight at 22°C, 28°C, 33°C, and 37°C. A sample of the cells was then kept in cold methanol. The quantification of the PCR products was done using Image-Quant 5.2 software.
For the reverse-transcriptase polymerase chain reaction (RT-PCR), total RNA was extracted using the hot phenol method. RNA was DNAsed using RQ1 DNAse (Promega). Five micrograms of total RNA were retrotranscribed following the manufacturer's directions. PCR primers are listed in Supplemental Table S6. All RT-PCR products were sequenced to validate the usage of the alternative 3′ss.
The RNA structures included in the figures were calculated with the program RNAfold (Hofacker 2009), and graphics were created with VARNA (Darty et al. 2009). Other line art figures and statistical calculations have been done using R (R Development Core Team 2008).
SUPPLEMENTAL MATERIAL
Supplemental material is available for this article.
ACKNOWLEDGMENTS
The authors thank Karla Neugebauer and Jean Beggs for useful discussions. The authors also thank Nicolás Bellora and Amadís Pagès for their help with some of the data analysis. E.E. and M.P. were supported by the Spanish Ministry of Science (MICINN) with grants BIO2008-01091, BIO2011-23920, and CSD2009-00080. The work from M.P. was also partly funded by Spanish National Health Institute Carlos III. J.V. and C.C.S. were supported by BIO2008-363 (MICINN) and by CSIC-200920I195. P.G.F. was supported by SFRH/BPD/42003/2007 (FCT-PORTUGAL) and by CSD2007-1500005 (MICINN).
Footnotes
-
↵6 Corresponding author.
E-mail eduardo.eyras{at}upf.edu.
-
Article published online ahead of print. Article and publication date are at http://www.rnajournal.org/cgi/doi/10.1261/rna.030767.111.
- Received October 5, 2011.
- Accepted March 8, 2012.
- Copyright © 2012 RNA Society




