


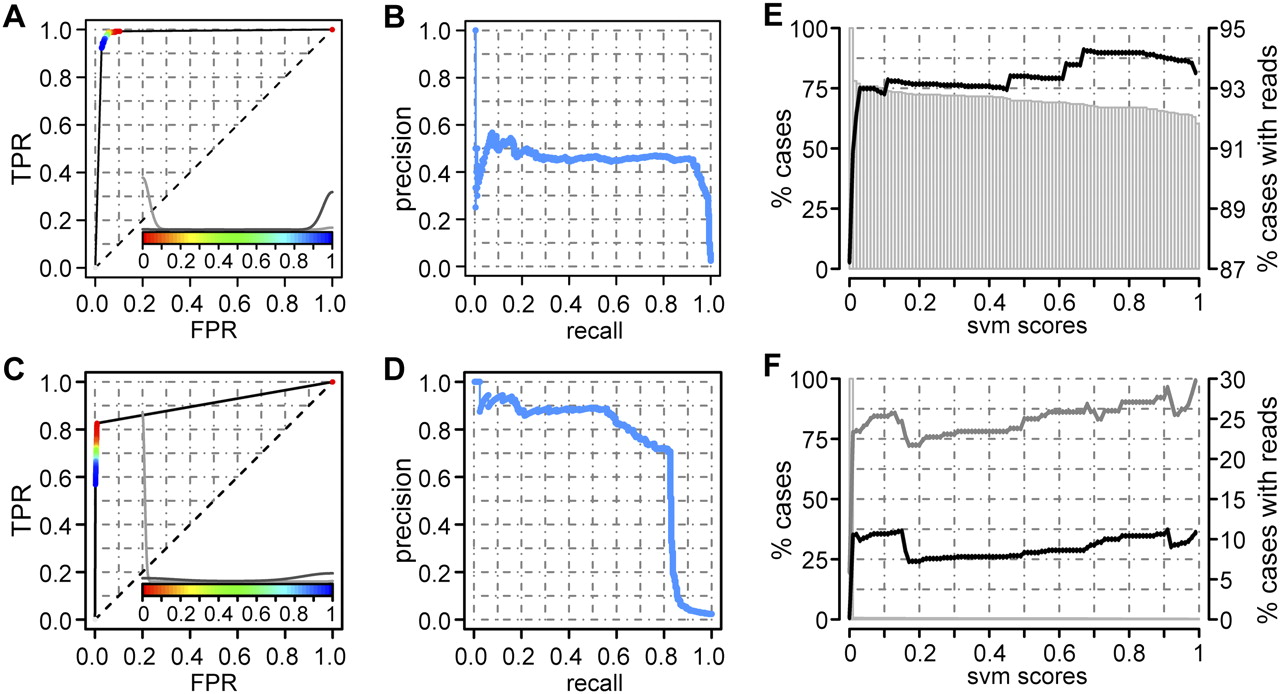
Evaluation of the classifier at 22°C. (A) Receiving Operating Characteristic (ROC) curve of the SVM classifier using scoring scheme score1 (see text). For each threshold of the score, the true positive rate (TPR) and false positive rate (FPR) values are represented in the x- and y-axes, respectively. The distribution of values for positive cases (dark gray) and negative cases (light gray) together with the color scale for the different thresholds used can be seen at the bottom of the graph. (B) Precision-recall curve of the SVM classifier using score1. In the precision-recall curve, the TPR (recall) is represented in the x-axis, whereas the y-axis shows the precision, i.e., number of true positive cases for a given threshold over the total amount of cases predicted as positive. (C) ROC curve and (D) precision-recall curve for the SVM classifier using scoring scheme score2 (see text). (E,F) Cumulative distributions of predicted 3′ss that are validated by RNA-Seq reads obtained at 22°C, for annotated (E) and cryptic (F) 3′ss. The left y-axis represents the percentage of 3′ss that have a score2 higher than or equal to that given on the x-axis (gray bars). The right y-axis scale represents the percentage of cases with a score2 higher than or equal to that given on the x-axis and that can be validated using RNA-Seq reads that also validate the annotated 5′ss (black line) or that may validate other 5′ss (gray line).




