


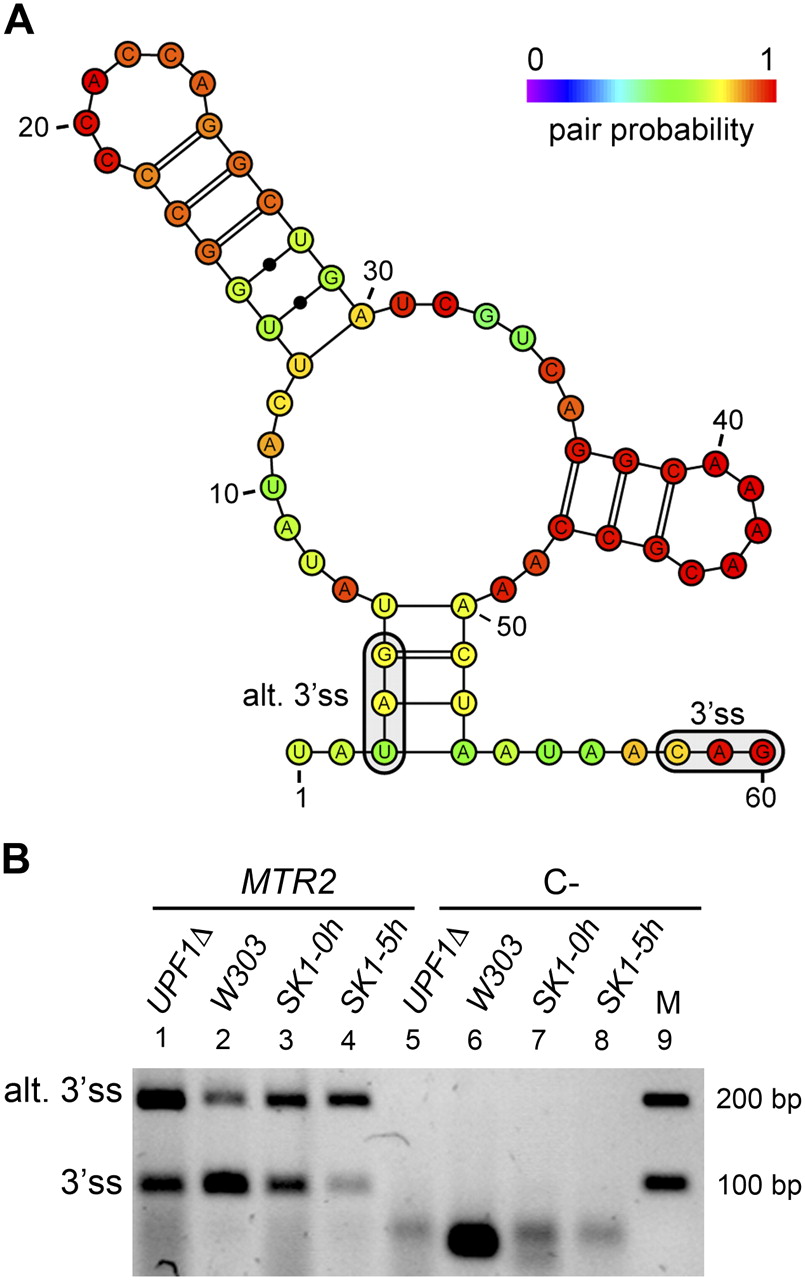
Experimental validation of a predicted alternative 3′ss in the 5′ UTR in MTR2. (A) Predicted optimal secondary structure between the BS and the annotated 3′ss, discarding the first 8 nt after the BS A, in the 5′ UTR of the MTR2 gene. The 3′ss and the alternative 3′ss (alt. 3′ss) tested are boxed in the picture. The color of the nucleotides represents the pair probability of the bases in the optimal secondary structure. For nucleotides outside the secondary structure, the color represents the accessibility of the nucleotide (one-pair probability) in the same scale. (B) RT-PCR validation of the splicing pattern of the MTR2 gene in different yeast strains. Lanes 1–4 show analyses of MTR2 using RNA from strains UPF1Δ (lane 1), W303 (lane 2), and SK1 at time zero of meiosis (lane 3) and after 5 h (lane 4) (Materials and Methods). Lanes 5–8 show the corresponding negative controls without AMV reverse transcriptase. Lane 9 contains the markers, with the corresponding lengths indicated on the right. Bands corresponding to the alternative and annotated 3′ss are indicated. The band for the alternative 3′ss appears in the strains UPF1Δ and W303 and during meiosis (SK1-0 h and SK1-5 h).




