


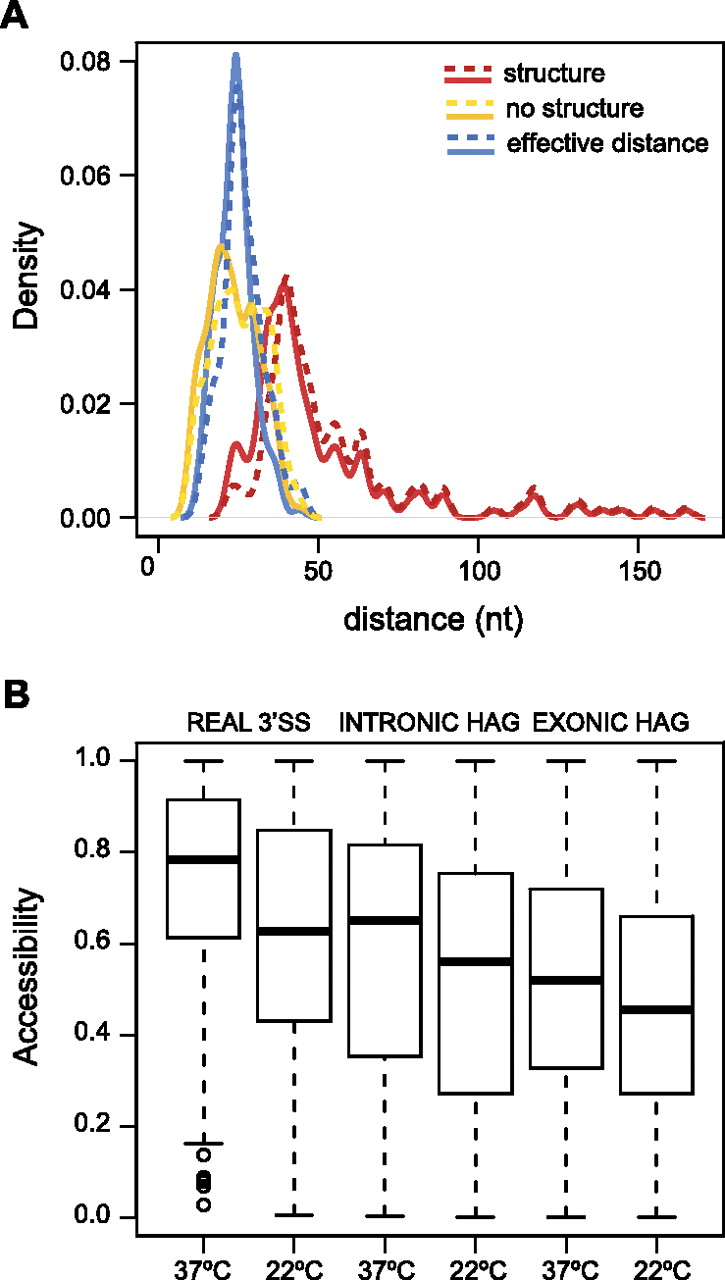
Effective distance and accessibility properties of 3′ splice sites. (A) Comparison of BS-3′ss length distribution at 22°C (continuous) and 37°C (dashed lines). The plot shows the length distribution of BS-3′ss regions with a secondary structure (red) and for those without a predicted secondary structure (yellow). In the cases in which a secondary structure is predicted, the distribution of the effective distances is also shown (blue). (B) Box plots representing the accessibility distributions at 22°C and 37°C for real 3′ss, intronic HAGs, and exonic HAGs. Accessibility values are shown on the y-axis, which can vary between 0 (always covered by a secondary structure) and 1 (never covered by a secondary structure).




