


Kinetics of tRNA folding monitored by aminoacylation
- 1Department of Chemistry and Biochemistry
- 2Interdepartmental Program in Biomolecular Science and Engineering, University of California, Santa Barbara, California 93106-9510, USA
Abstract
We describe a strategy for tracking Mg2+-initiated folding of 32P-labeled tRNA molecules to their native structures based on the capacity for aminoacylation by the cognate aminoacyl-tRNA synthetase enzyme. The approach directly links folding to function, paralleling a common strategy used to study the folding of catalytic RNAs. Incubation of unfolded tRNA with magnesium ions, followed by the addition of aminoacyl-tRNA synthetase and further incubation, yields a rapid burst of aminoacyl-tRNA formation corresponding to the prefolded tRNA fraction. A subsequent slower increase in product formation monitors continued folding in the presence of the enzyme. Further analysis reveals the presence of a parallel fraction of tRNA that folds more rapidly than the majority of the population. The application of the approach to study the influence of post-transcriptional modifications in folding of Escherichia coli tRNA1Gln reveals that the modified bases increase the folding rate but do not affect either the equilibrium between properly folded and misfolded states or the folding pathway. This assay allows the use of 32P-labeled tRNA in integrated studies combining folding, post-transcriptional processing, and aminoacylation reactions.
Keywords
INTRODUCTION
Folding of tRNA molecules to the canonical L-shaped tertiary structure is essential to translation, where specific interactions with aminoacyl-tRNA synthetases (aaRSs), initiation and elongation factors, and ribosomes are required (Agirrezabala and Frank 2009; Demeshkina et al. 2010; Kolitz and Lorsch 2010). Proper tRNA folding is likely to also be important for its noncanonical roles, such as participation in the cell wall, heme, and antibiotic biosynthesis (Banerjee et al. 2010; Francklyn and Minajigi 2010); tumorigenesis (Mei et al. 2010); and viral replication (Kleiman et al. 2010).
A wealth of knowledge has been gained from almost five decades of biophysical investigation on the folding properties of tRNAs. Early studies of tRNA folding by thermal melting analysis and temperature-jump kinetics showed that formation of the native structure is highly dependent on temperature and ionic strength (Cole and Crothers 1972; Cole et al. 1972; Yang and Crothers 1972). Relaxation kinetics and nuclear magnetic resonance suggested that heat-denatured, inactive tRNAs possess an altered tertiary conformation that is not aminoacylable by aaRS (Yang and Crothers 1972; Crothers et al. 1974; Bina-Stein et al. 1976; Hilbers et al. 1976). Temperature-dependent unfolding occurs through distinct, sequence-dependent ensembles in different tRNA species: The order of melting of the tertiary core and four helical arms of the cloverleaf is not fully conserved (Hilbers et al. 1973; Coutts et al. 1975).
Magnesium ions play a key role in tRNA folding. The addition of Mg2+ cations at an elevated temperature converted inactive preparations of yeast tRNA3Leu to an aminoacylable form (Lindahl et al. 1966; Adams et al. 1967), and later work employing oligonucleotide binding revealed that the dihydrouracil (D) arm unravels in the denatured state (Uhlenbeck et al. 1974). In another example, nuclear magnetic resonance and relaxation kinetics were used to demonstrate that the native and denatured forms of Escherichia coli tRNA2Glu, prepared by incubation at a moderate temperature in the presence and absence of Mg2+ ions, respectively, also possess distinct structures in the D-arm and tertiary core (Eisinger and Gross 1975; Bina-Stein et al. 1976). Further experiments using chemical and enzymatic probes confirmed that the denatured and native forms of E. coli tRNA2Glu possess the same conformations in the acceptor and anticodon arms, but differ markedly in the central core region (Madore et al. 1999).
Multiple delocalized Mg2+ ions appear to influence tRNA folding; there are few examples of well-defined sites in X-ray structures. A study of Mg2+-induced tRNAPhe folding kinetics using attached fluorophores revealed four conformational transitions, with two Mg2+ ions binding at micromolar affinities and two more at millimolar affinities (Serebrov et al. 2001). These and other studies by single molecule (Sorin et al. 2004) and computational approaches (Ding et al. 2008) suggest that tRNA folding features a dynamic landscape with multiple energy minima, as has been proposed for the folding of larger RNAs (Zhuang et al. 2000; Russell et al. 2002a). Like larger RNAs, tRNAs appear to also fold via parallel pathways with discrete intermediates, some acting as long-lived kinetic traps (Treiber and Williamson 1999; Kent et al. 2000; Brooks and Hampel 2009).
tRNAs also serve as substrates for a wide variety of processing and modification enzymes (Phizicky and Hopper 2010): Over 100 distinct modifications of varying complexity are known (Jackman et al. 2003; Grosjean 2009). Modified tRNAs extracted from cells are more stable than their unmodified counterparts obtained by in vitro transcription, as judged by thermal melting analysis and chemical and enzymatic probing (Sampson and Uhlenbeck 1988). Indeed, rapid tRNA decay has been demonstrated in vivo in yeast when the molecule is incompletely modified (Alexandrov et al. 2006). Unmodified tRNAs also exhibit a greater requirement for Mg2+ ions to maintain the active conformation (Hall et al. 1989; Yue et al. 1994; Maglott et al. 1998). Many unmodified tRNAs can be efficiently aminoacylated, however, leading to the general view that the modifications contribute more subtly to structure-function relationships. An extraordinary exception to this principle exists for human mitochondrial tRNALys: The unmodified form folds not into a cloverleaf but instead into an extended bulged hairpin, and the key determinant of native folding has been identified as a single post-transcriptionally added methyl group at the m1A9 position in the tertiary core (Helm et al. 1999b).
Studies of tRNA folding and stability have benefited from the development of a variety of techniques, including high-resolution footprinting and single-molecule FRET (fluorescence resonance energy transfer) to study equilibrium structures (Chakshusmathi et al. 2003; Rangan et al. 2004; Wang et al. 2008; Messmer et al. 2009; Dammertz et al. 2011), nuclear magnetic resonance to provide short-range dynamics information (Vermeulen et al. 2005; Farjon et al. 2009), and birefringence decay and phased τ ratio analysis to address long-range flexibility (Friederich et al. 1998). The folding kinetics of fluorescently labeled tRNA has been followed directly (Serebrov et al. 2001). Time-resolved footprinting and small-angle X-ray scattering methods, although not yet applied directly to tRNA folding, have been used to follow the folding kinetics of large RNAs on a millisecond time scale (Sclavi et al. 1998; Russell et al. 2002b; Das et al. 2003).
Although these methods can quantify the energetics of interconversion among different conformational states and can measure the degree of structure formation in tRNAs, they do not provide a direct link to function. Because the canonical function of tRNA in translation begins with aminoacylation, the aaRS enzyme is the key cellular factor that interrogates the tRNA to determine whether native structure is present or not. In the field of ribozyme catalysis, folding studies have been greatly facilitated by the robust enzymatic activity of the molecule, which allows straightforward distinction of native from non-native conformations (Wan et al. 2009). Here, we offer a parallel approach by demonstrating a facile kinetic folding assay that utilizes the potent activities of aaRSs to monitor tRNA folding. This method is highly complementary to the aforementioned approaches and provides a generally applicable tool to integrate studies of tRNA stability, folding, modification, and aminoacylation.
RESULTS
To monitor tRNA folding kinetics, we took advantage of the approach to measuring aminoacylation developed by Uhlenbeck and colleagues, which relies on the preparation of tRNA substrates that are selectively [32P]-labeled at the 3′ internucleotide linkage using tRNA nucleotidyltransferase (Wolfson et al. 1998; Wolfson and Uhlenbeck 2002; Ledoux and Uhlenbeck 2008). This assay possesses significant advantages over the conventional method that relies instead on radiolabeled amino acid: (1) The fraction of aminoacylable tRNA (plateau level) can be directly monitored by the ratio of substrate and product intensities on a thin-layer chromatography (TLC) plate; (2) the sensitivity of the assay is much higher, enabling the detection of even very weak aminoacylation levels; and (3) the use of unlabeled amino acid allows high and saturating concentrations of this substrate to be used. This assay is generally applicable to many and perhaps all aaRSs, including those that utilize nonstandard amino acid substrates, and yields precise measurements of steady-state and elementary rate constants for both cognate and misacylation reactions (Uter and Perona 2004; Hauenstein et al. 2008; Ledoux and Uhlenbeck 2008; Dulic et al. 2010). We describe now the further use of this assay to monitor precatalytic folding of the tRNA substrate, including the influence of post-transcriptional modifications on this process.
Previously, we determined kcat, Km(tRNAGln(CUG)), Km(Glu), and Km(ATP) for Glu-tRNAGln synthesis by the nondiscriminating glutamyl-tRNA synthetase (GluRSND) from Methanothermobacter thermautotrophicus (MT) (Rodriguez-Hernandez et al. 2010). Maximal plateau levels for aminoacylation were obtained by folding the unmodified 32P-labeled tRNAGln transcript by heating to 80°C, adding MgCl2 to a final concentration of 10 mM, and slow-cooling to the ambient temperature of 21°C (Fig. 1). Under conditions of enzyme molar excess such that single turnovers are monitored and at saturating levels of ATP and glutamate, the plateau aminoacylation level in reactions performed at 21°C, 37°C, or 45°C following this prefolding procedure is 60%–65% (Fig. 1B,C). This plateau level is insensitive to the concentration of Mg2+ ions and ATP-Mg2+ in the 2- to 10-mM range and to pH in the range from 6–8 (data not shown). Because the lability of the aminoacyl ester bond increases significantly at higher pH values, the insensitivity of the plateau level to this parameter suggests that deacylation is not a major factor preventing higher levels of aminoacylation. Thus, 35%–40% of the tRNA likely represents a portion of the substrate pool that is not aminoacylable because of 5′- or 3′-end heterogeneity from the transcription or 3′-labeling reactions (Helm et al. 1999a; Sherlin et al. 2001), although a formal alternative possibility is that this fraction adopts a misfolded conformation that cannot be renatured under any refolding protocol attempted (Johnson et al. 2005). The concentration of aminoacylated tRNA was normalized to 65% levels to more accurately reflect the true fraction of glutamylated tRNAGln in single turnover reactions. Gel electrophoresis confirmed that there is no degradation of the tRNAs (data not shown).
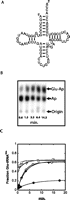
(A) Proposed secondary structure of the M. thermautotrophicus (MT) tRNAGln(CUG) transcript. (B) Representative time-course for formation of Glu-tRNAGln by MT GluRSND. Ap indicates the position where the nonaminoacylated 3′-terminal monophosphorylated A76 nucleotide migrates. Glu-Ap indicates the position of migration for the glutamylated A76 nucleotide. (C) Glutamylation of MT tRNAGln(CUG). Open symbols represent reactions in which the tRNA substrate was prefolded by heating to 80°C, followed by addition of Mg2+ to 10 mM final concentration and slow cooling to 21°C. These glutamylation reactions were performed at 21°C (open circles), 37°C (open inverted triangles), or 45°C (open squares). The solid circles represent a reaction in which the tRNA substrate was heated to 80°C, followed by addition of Mg2+ to a 10 mM final concentration, rapid cooling to 0°C, and subsequent glutamylation performed at 21°C. The curve depicted by solid diamonds represents the aminoacylation time-course at 21°C for a tRNA sample that was subjected to the rapid-cooling protocol and then subsequently incubated for 300 min at 37°C.
To use the 32P-labeled tRNAGln in folding assays, we trapped a conformation of the molecule that could not be aminoacylated to high levels by altering the refolding protocol: After heating to 80°C, the tRNA sample was rapidly chilled in an ice-water bath at 0°C with the addition of 10 mM Mg2+. Under these conditions, the plateau level for aminoacylation is reduced to 20% (Fig. 1C). To confirm that this treatment does not irreversibly inactivate the tRNA, after chilling at 0°C we removed and incubated a portion of the material at 37°C for several hours before performing the aminoacylation reaction at 21°C. The aminoacylation level of 60% was recovered, demonstrating that the low level of aminoacylation after rapid chilling is due to the formation of kinetic traps and does not represent an irreversible inactivation of tRNAGln (Fig. 1C).
Monitoring the folding of MT tRNAGln to the functional native state
We next set up a folding reaction to track Mg2+-induced formation of the functional tRNAGln(CUG) beginning from the trapped, inactive conformation (Fig. 2). A low concentration of 32P-labeled MT tRNAGln (<1 nM) in a buffer consisting of 10 mM Tris-HCl (pH 8.0), 1 mM Na2EDTA was first heat-denatured for 3 min at 80°C and then immediately transferred to a folding reaction mixture preincubated at 0°C. The preincubated mixture consists of 100 mM Na-Hepes (pH 7.0), 10 mM ATP-Mg2+, 50 mM glutamate, and 5 mM DTT. After further incubation for 5 min at 0°C, half of the reaction mixture was transferred to 21°C. Then, at different folding times t1 (Fig. 2A), 18 μL aliquots from the folding reactions at 0°C and 21°C were transferred to fresh microcentrifuge tubes at 21°C, and aminoacylation reactions were initiated within 15 sec by addition of GluRSND to final concentrations of 100 nM–1 μM. After various aminoacylation times t2 (Fig. 2A), aliquots (2 μL) were removed and quenched in 5 μL of a solution containing 400 mM sodium acetate (pH 5.2) and 0.1 mg/mL P1 nuclease, which both stops the reaction and digests the tRNA to 5′-monophosphorylated nucleotides. 32P-labeled Glu-AMP was then separated from 32P-AMP by TLC (Rodriguez-Hernandez et al. 2010).
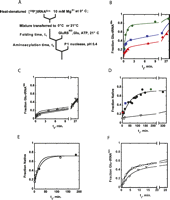
Folding of the MT tRNAGln in vitro transcript. (A) Experimental design for the coupled folding and aminoacylation assay. See text for details. (B) Reaction progress curves for aminoacylation at 21°C, using tRNA substrate taken from a folding reaction performed at 21°C. Reactions were initiated by addition of GluRSND to a final concentration of 100 nM, after folding incubation times (t1) of 2.75 min (triangles), 20.5 min (squares), and 185.2 min (diamonds). The ordinate here and in panels C through F is normalized such that the 65% aminoacylation plateau represents the maximum fraction of Glu-tRNAGln that can be synthesized. (C) Reaction progress curves for aminoacylation at 21°C, using tRNA substrate taken from a folding reaction performed at 0°C. Reactions were initiated by addition of GluRSND to a final concentration of 1 μM, after folding incubation times (t1) of 0.58 min (triangles), 11.12 min (squares), 16.37 min (diamonds), and 120 min (inverted triangles). (D) Replots of aminoacylation burst amplitude with folding time t1. Solid-colored symbols are derived from the burst amplitude data in panel B for folding at 21°C, and open symbols are derived from the burst amplitude data in panel C for folding at 0°C. Solid black circles represent additional data points not shown in panel B. (E) Replots of aminoacylation burst amplitude with folding time t1 for folding reactions performed at 21°C at GluRSND concentrations of 100 nM (filled symbols; these data are the same as shown in panel D) and 1 μM (open circles). (F) Reaction progress curves at 21°C showing effects of tRNAGln preincubation for 10 min in the presence of 100 nM GluRSND (open circles), and preincubation without GluRSND (open squares). Inverted triangles depict the reaction progress curve at 21°C for an experiment in which pyrophosphatase was added together with GluRSND when initiating the reaction.
In all reaction time-courses, we observed a burst of Glu-tRNAGln formation followed by a slower accumulation (Fig. 2B,C). For folding reactions carried out at 21°C, the rate constants for the fast and slow phases of aminoacylation derived from a biexponential fit are 2.2 ± 0.7 min−1 and 0.027 ± 0.006 min−1, respectively, and these constants are identical within the experimental error for reactions initiated from tRNA substrate that was incubated for different folding times t1 (Fig. 2B). The rate constant for the burst phase is about threefold lower than the kmax previously measured for single-turnover aminoacylation reactions (6 min−1) (Rodriguez-Hernandez et al. 2010). This is attributable to the lower temperature of the reaction (21°C instead of 37°C) and the subsaturating concentration of GluRSND (100 nM). While the values of the derived rate constants do not vary with folding preincubation time t1, the amplitudes of the aminoacylation time-courses do increase sharply with the time of preincubation (Fig. 2B). A plot of amplitude versus folding time t1 fits well to a single exponential function with a rate constant of 0.039 min−1, a value very similar to the rate constant for the slow phase of the aminoacylation time-course (Fig. 2D, filled symbols). Increasing the concentration of GluRSND in the aminoacylation reaction from 100 nM to 1 μM or preincubating GluRSND with tRNA, each do not significantly affect either the burst amplitudes or the rate constant for the slow phase of the time-course (Fig. 2E,F). Further, inclusion of pyrophosphatase does not produce a significant increase in the burst fraction or plateau level, demonstrating that the pyrophosphate product does not inhibit the reaction (Fig. 2F).
These results demonstrate that a rate-limiting unimolecular GluRSND-independent transformation from a nonfunctional to aminoacylable form of the tRNA occurs during the 21°C folding preincubation. The slow phase in the aminoacylation time-course then represents continued folding of tRNA to its native conformation in the presence of the enzyme, while the rapid burst phase represents tRNA that has folded in the preincubation step for the time t1, in the absence of enzyme (the magnitude of the rate constant for the rapid burst phase does depend on enzyme concentration; data not shown). Thus, the aminoacylation readout captures the time-course of the folding and provides a new approach to follow tRNA folding kinetics that is directly linked to function.
When the folding preincubation reactions t1 were carried out at 0°C, the rate constants for the fast and slow phases of aminoacylation at 21°C are 1.5 ± 0.5 min−1 and 0.017 ± 0.0025 min−1, respectively (Fig. 2C), similar to the values obtained for folding at 21°C. However, for the 0°C folding reactions, the amplitude of the fast phase now increases by only ∼12% with folding preincubation time (Fig. 2D, open symbols). Thus, at a very low temperature, the tRNA remains trapped in the non-native conformation, and slow folding occurs only after the tRNA is transferred to the aminoacylation reaction vessel at 21°C (Fig. 2B–D).
We also carried out the folding and aminoacylation reactions at 37°C. In this case, the rate constants for both the initial burst phase and slower phase increase sharply (Fig. 3A). The rate constant for the burst phase is too fast to measure in these hand-sampled reactions, while the rate constant for the slow phase is 0.3–0.55 min−1, about 10- to 20-fold higher than at 21°C. Again, a replot of the burst amplitude with the folding preincubation time t1 yields a folding rate constant (0.6 min−1) that matches the slow phase of the aminoacylation reaction (Fig. 3B). These data demonstrate the existence of a thermal activation barrier for folding and demonstrate that the assay is robust across a range of temperatures and folding rate constants—even though, at the higher temperature for this particular tRNA, the burst is not explicitly observed. The rate constant at 37°C is comparable to the unimolecular transition of a slow folding species in the small HDV ribozyme (0.1–0.2 min−1) (Chadalavada et al. 2002).
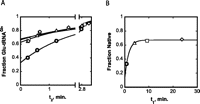
Coupled folding and aminoacylation reactions of MT tRNAGln(CUG) at 37°C. (A) Normalized reaction progress curves using tRNA substrate taken from a folding reaction performed at 37°C. Reactions were initiated by addition of GluRSND to a final concentration of 100 nM, after folding incubation times (t1) of 0.75 min (circles), 4 min (triangles), 9.25 min (squares), and 23.66 min (diamonds). (B) Replots of aminoacylation burst amplitudes from panel A with folding time t1. The burst phase amplitudes are obtained by extrapolation to the ordinate.
Extrapolation of the burst phases of the aminoacylation time-courses to the ordinate reveals a nonzero intercept for aminoacylation reactions at 21°C, for folding at both 21°C and 0°C. (Fig. 2B,C), and this is also evident in the replots of aminoacylation burst amplitude with the folding time t1 (Fig. 2D). About 10%–15% of the tRNA appears to fold extremely rapidly. Such a fast folding fraction was also observed in studies of the Tetrahymena group I ribozyme folding pathway (Russell et al. 2002a). Thus, similar to large RNAs, parallel folding pathways may also be present in tRNA molecules (Dammertz et al. 2011).
Structural evidence for misfolding
To examine the structural differences between native and misfolded MT tRNAGln, we employed a nuclease footprinting assay. Footprinting reactions also employed tRNA that is 32P-labeled at the 3′-internucleotide linkage. Folded and misfolded tRNA was prepared as described above, and each sample was subjected to digestion with RNase A, which cleaves 3′ to single-stranded nucleotides (Ehresmann et al. 1987; Savochkina et al. 2008; Mertz et al. 2009). tRNA fragments for use as a size-standard ladder were prepared by digestion of the unfolded tRNA with nuclease T1, which cleaves 3′ to single-stranded guanosines. Digests were separated on a 15% denaturing polyacrylamide sequencing gel and analyzed as described in the Materials and Methods (Fig. 4A). The data show that the D-arm nucleotides are enhanced in cleavage, whereas the T-arm and variable loop nucleotides are strongly protected from RNase A digestion in the native folded tRNA compared with the misfolded tRNA. Similar results were obtained when nuclease S1 was used to digest the tRNAs (Fig. 4B). Thus, the native and misfolded forms of MT tRNAGln adopt distinct structures, consistent with the notion that the misfolded tRNA possesses an altered conformation (or set of conformations) that requires surmounting of a significant free energy barrier to reach the functional state.
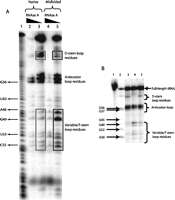
(A) RNase A footprinting of native and non-native forms of MT tRNAGln(CUG). Lane 1 corresponds to an alkaline hydrolysis ladder. MT tRNAGln(CUG) was either heat-denatured and slow cooled following Mg2+ addition to generate native species (lanes 2,3) or heat-denatured and flash-cooled to 0°C with Mg2+ addition to generate non-native species (lanes 4,5). Lanes 2 and 4 represent native and non-native forms of tRNAs, respectively, that were subjected to RNase A digestion under conditions (1 ng/mL enzyme) allowing for complete digestion. In contrast, lanes 3 and 5 represent native and non-native forms of tRNAs, respectively, that were subjected to RNase A digestion under conditions (0.1 ng/mL enzyme) allowing for partial digestion. Differences in the intensities of RNase A digestion patterns, observed in the T- and D-arms, are boxed. (B) RNase S1 footprinting of native and non-native forms of MT tRNAGln(CUG). (Lane 1) Full-length tRNA; (lane 2) T1 nuclease ladder; (lane 3) native tRNA formed by heating to 80°C followed by slow-cooling in the presence of MgCl2; (lane 4) non-native tRNA generated by heating to 80°C and flash-cooling to 0°C in the presence of MgCl2; and (lane 5) native tRNA generated by heating to 80°C, flash cooling in the presence of MgCl2 at 0°C for 5 min, and subsequent refolding at 21°C for 2 h. The concentration of S1 nuclease used in the experiments shown in lanes 3 through 5 is 3 units per milliliter, calibrated to provide partial digestion of the substrate (data not shown).
Application to the study of tRNA modification
The overall importance of post-transcriptional modifications for structural stability of tRNAs is well established (Motorin and Helm 2010). However, much less is known about the precise roles played by modified nucleotides in promoting thermodynamic stability, influencing the nature of the folding pathways, or altering the kinetics of the folding transition. To begin to investigate the role of post-transcriptional modifications in tRNA folding in more detail using the approaches described above, we examined the E. coli glutamine aminoacylation system, for which there are two tRNA isoacceptors. While modifications are not important for aminoacylation of tRNA2Gln(CUG) by E. coli glutaminyl-tRNA synthetase (GlnRS) (Ibba et al. 1996), efficient aminoacylation of tRNA1Gln(UUG) requires modification at wobble position 34 in the anticodon (Rogers and Soll 1993; Rogers et al. 1995). Eight other positions in this tRNA are also modified, including a number of nucleotides in the tertiary core (Fig. 5A; Juhling et al. 2009). Both the modified and unmodified species were prepared for comparative folding studies. Unmodified tRNA1Gln(UUG) was obtained by in vitro transcription, and modified (native) tRNA1Gln(UUG) was purified by affinity chromatography from E. coli cells without overproduction (see Materials and Methods).
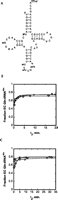
(A) Secondary structure of E. coli tRNA1Gln(UUG) indicating the positions of post-transcriptional modifications. The base modification at position U34 includes the 2-thio group as depicted, but its full identity is unknown. (B) Glutaminylation of native, fully modified E. coli tRNA1Gln. Diamonds indicate the time-course of aminoacylation after optimized folding at 21°C, circles indicate the time-course after flash-cooling at 0°C, and inverted triangles represent tRNA that was flash-cooled at 0°C and renatured at 21°C for 30 min prior to addition of enzyme. See text for details. (C) Glutaminylation of unmodified E. coli tRNA1Gln. Symbols are to be interpreted as in panel B.
3′-[32P]-labeled native and unmodified tRNA1Gln(UUG) were denatured at 80°C, and the tRNAs were subjected to the protocols described above: Folding was optimized by slow-cooling to 21°C, and flash-cooling at 0°C was employed to generate misfolded species. Both native and unmodified tRNAs are aminoacylable to a ∼70%–80% plateau level under the optimized folding protocol. Aminoacylation reactions were conducted in 100 mM Na-Hepes (pH 7.0), 10 mM MgCl2, 10 mM ATP-Mg2+, 5 mM DTT, and 20 mM glutamine, with 5 μM E. coli GlnRS and <1 nM tRNA (Fig. 5B,C). Under these conditions, kobs for aminoacylation of the native and unmodified tRNAs is 3.0 sec−1 and 2.7 sec−1, respectively (data not shown).
Unlike the MT tRNAGln transcript (Fig. 2), both unmodified and native E. coli tRNA1Gln(UUG) were rapidly aminoacylated at 21°C regardless of how the sample was folded (Fig. 5B,C). However, for the unmodified transcript, the lower aminoacylation levels at early time-points do indicate that ∼25% of the tRNA remains misfolded at the 15-sec aminoacylation time-point (Fig. 5C), suggesting a possible role for the modifications in folding. As observed for the unmodified MT tRNAGln at 37°C (Fig. 3A), the early bursts of both native and unmodified E. coli tRNA1Gln are too rapid to permit fitting to a biexponential function. The substantially greater fraction of MT tRNAGln that can be kinetically trapped in an inactive conformation (Fig. 2) must arise from sequence differences compared to the E. coli tRNAGln and provides another example demonstrating that the detailed folding properties of individual tRNA species are highly distinct (Hilbers et al. 1973; Coutts et al. 1975).
To better assess the importance of the modifications, we repeated the folding reaction for the unmodified transcript at 0°C but conducted the aminoacylation reaction at 8°C. In contrast to the aminoacylation reactions conducted at 21°C (Fig. 5), these conditions allowed a reliable estimation of burst amplitudes, which in turn indicated the fraction of functional unmodified tRNA in the folding mixture at 0°C (Fig. 6A). Even at 8°C, the rate constants for the burst phase are too fast to be accurately measured, but the amplitudes of the bursts, represented by the intercepts of single exponential fits at the y-axis, increase progressively with folding time t1. The rate constants for the individual time-courses are similar to each other (the range of values is from 1–2 min−1). Replot of the burst fraction versus folding time t1 yields a rate constant for folding of 0.15 min−1 (Fig. 6C). In contrast, the folding of in vivo, fully modified tRNA1Gln is so fast that the time-courses for aminoacylation are essentially identical at 8°C: No distinction in the amplitude of the (unobserved) burst is detected at folding preincubation times t1 as short as 15 sec (Fig. 6B,C).
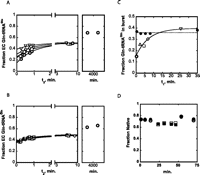
Role of modifications in folding. (A) Reaction progress curves at 8°C using unmodified E. coli tRNA1Gln(UUG) substrate taken from a folding reaction performed at 0°C. Reactions were initiated by addition of GlnRS to a final concentration of 5 μM, after folding incubation times (t1) of 0.25 min (circles), 2.25 min (triangles), 4.5 min (squares), 6.75 min (diamonds), and 25.5 min (inverted triangles). (B) Reaction progress curves at 8°C using fully modified E. coli tRNA1Gln(UUG) substrate taken from a folding reaction performed at 0°C. Reactions were initiated by addition of 500 nM GlnRS after folding incubation times (t1) of 0.4 min (circles), 2.7 min (triangles), 5.3 min (squares), 8.1 min (diamonds), and 35 min (inverted triangles). The right panels in A and B represent maximal aminoacylation levels of tRNA transcript and in vivo tRNA that were folded for several days at 8°C. (C) Replots of aminoacylation burst amplitude with folding time t1. Reactions for in vivo tRNA1Gln(UUG) are shown in filled circles (data taken from panel B), and reactions of the unmodified transcript are shown as open symbols (data taken from panel A). (D) Maximum aminoacylation levels of prefolded (heat-denatured and slow cooled) E. coli tRNAGln transcript (open symbols) and in vivo tRNAGln (closed symbols). Both incubation of pre-folded tRNA and aminoacylation are performed at 21°C (circles) and 8°C (squares).
For both modified and unmodified tRNAs, the maximal plateau aminoacylation values at 8°C are 40%–50%, substantially lower than the 80% levels that are achieved when aminoacylation reactions are conducted at 21°C (Fig. 6A–C). One explanation for this observation is that the conformational equilibrium between misfolded and functional structures is influenced by temperature, such that the misfolded form is favored when the temperature is lower. An alternative explanation is that different populations of misfolded species exist, a fraction of which fold extremely slowly on the observed 10-min time-scale. To differentiate the two models, we allowed the RNA to fold at 8°C for several days and then performed aminoacylation at 8°C on aliquots from this folding reaction. If equilibrium truly favors only 40%–50% native tRNA, then we would expect the fraction of properly folded tRNA to remain at this level even upon extended incubation at 8°C. Instead, however, the proportion of aminoacylable tRNA significantly increases upon prolonged incubation times for both the unmodified and native tRNAGln species (Fig. 6A,B, right-hand panels). This demonstrates the presence of additional, distinct classes of misfolded species that fold extremely slowly at 8°C.
To further confirm that the 40%–50% aminoacylable fraction indeed does not represent the equilibrium distribution, we performed a temperature-jump experiment (Fig. 6D). Prefolded native and unmodified tRNA with aminoacylation levels in the 70%–80% range were first incubated for 16 min at 21°C (represented by the first three data points in Fig. 6D). Aliquots were taken from this mixture, and the maximum fraction of native tRNA was determined by aminoacylation using 5 μM GlnRS. The temperature was then shifted to 8°C, and aliquots from this mixture were aminoacylated at 8°C. The 60%–65% levels achieved are equivalent to those after extended incubation at 8°C (Fig. 6, cf. A,B, right-hand panels, and D). Shifting the temperature back to 21°C regenerated aminoacylation at the 70%–80% level (Fig. 6D). The 10%–15% lower aminoacylation levels at 8°C may be attributable to either true changes in the equilibrium position or to inefficient aminoacylation at 8°C. These findings are consistent with expectations for a tRNA possessing a conformational equilibrium that favors the native state. From these data, we also infer the existence of at least two misfolded species (intermediates) during folding of both transcript and in vivo tRNAGln. This is deducible based on an observable rapid folding fraction as also found for the MT tRNAGln (cf. Figs. 2D and 6C), a subsequent slower attainment of a 45%–50% aminoacylation level, (Fig. 6A,B), and, lastly, slower folding to 65%–70% levels (Fig. 6A,B, right-hand panels). The identical plateau levels achieved in the reactions of native and unmodified tRNA for both the two slower-folding fractions suggest that the modifications do not affect either the folding pathway or the apparent equilibrium of folded and misfolded tRNA. Instead, it appears that the role of the modifications is to increase the rate of folding and thus to exert a kinetic rather than a thermodynamic effect.
DISCUSSION
We have described a new assay for tRNA folding in which attainment of the native conformation is signaled by the capacity of the RNA to serve as substrate for its cognate aaRS. While other approaches to characterize the kinetics and thermodynamics of tRNA folding rely solely on detecting structural differences between unfolded and native conformers, this assay instead provides a direct link to function. Provided that folding is rate limiting, the folding and aminoacylation kinetics are separable, and the aminoacylation readout is initiated simply by the direct addition of enzyme into the folding reaction. tRNA folding intermediates that adopt similar structures to the native form but that are nonetheless inactive can be distinguished by this approach. The assay is generally applicable to characterize structural intermediates or kinetic trap(s) in any tRNA for which the cognate aaRS is available, and to monitor the refolding events that occur during their conversion to native structures. Although the folding pathways will likely differ for tRNAs with different sequences (Uhlenbeck 1995), general properties such as stepwise folding and formation of intermediates are likely to be common to most or all tRNAs.
The assay extends the advantages of using highly sensitive [32P]-tRNA labeling beyond the aminoacylation and subsequent tRNA-dependent amino acid modification reactions (Ledoux and Uhlenbeck 2008), to encompass as well the earlier modification and folding steps. The use of low concentrations of labeled tRNA, as we have described, is particularly beneficial because obtaining large quantities of purified fully modified isoacceptors will often be challenging depending on the biological source. tRNA overexpression in vivo is problematic as a solution to this problem, because the modifying enzymes may not keep up with the increased tRNA synthesis, potentially producing a mixture of differently modified species (Perona et al. 1988; Arnez and Steitz 1994).
Development of the assay was inspired by the well-developed use of catalytic activity as a probe of ribozyme folding (Wan et al. 2009). However, because the tRNA substrate is the active molecule whose capacity for aminoacylation by a protein enzyme directly reflects the fraction of properly folded species, the ambiguities associated with possible multiple turnover behavior by ribozymes are avoided. In both cases, a prerequisite for employing this assay is that the folding step be rate-limiting. In our method, because the amino acid substrate is unlabeled, high and saturating concentrations can easily be used, thus increasing the possibility that catalysis will indeed be faster. Variation in assay conditions, including pH, temperature, and magnesium ion concentration, may also be used to maximize the difference between folding and aminoacylation rate constants. The use of single turnover conditions is necessary to avoid more complex outcomes that may arise because the rate-limiting step for many aaRS is the release of aminoacylated product (Zhang et al. 2006). Use of single-turnover conditions, in the assay linked to folding, allows fits of the data to a biexponential function, where fast aminoacylation of prefolded tRNA is observed as an initial burst, and the slower continued folding is fit to the second phase.
The folding of the archaeal and bacterial tRNAGln species studied here exhibit two other features that may be of value to explore for other tRNAs. First, a small fraction of each tRNA folds very rapidly, much faster than the majority of the population, as revealed by the nonzero y-intercepts obtained from extrapolation of the burst phase kinetics (Figs. 2B–D, 6A,C). Thus, parallel folding pathways appear to be present. Second, while the rate of tRNA folding in the preincubation reaction is approximately the same as the rate at which the tRNA continues to fold after enzyme is added, there is also a fraction of tRNA that remain nonaminoacylable in the folding reaction. Regardless of the length of the preincubation time t1, the initial product burst for MT tRNAGln only reaches 70%. However, in the second, slow phase of the reaction, aminoacylation continues to slowly increase with the rate constant equivalent to that of folding (Fig. 2B,D). Thus, the equilibrium for the native tRNA appears to be ∼2.5 such that the fraction of native species is 0.7. The continued slow increase likely represents transient formation of native species that is immediately aminoacylated by the aaRS.
The assay should also be highly useful in characterizing the effects of sequence alterations or post-transcriptional modification to tRNA folding, particularly in species such as the mitochondrial tRNAs in which mutations correlate with a variety of pathologies in humans (Taylor and Turnbull 2005). Distinguishing the effects of such mutations on folding versus aminoacylation should be facilitated substantially with this approach (Sohm et al. 2004). In addition, the assay also opens the possibility of studying the coupling of tRNA folding, modification, and aminoacylation: It should be possible to directly include a modifying enzyme or enzymes in the combined folding and aminoacylation reaction described here. The detailed roles of individual modifications in promoting tRNA folding might then be examined by using unmodified transcript as the substrate in a coupled reaction (Helm 2006; Motorin and Helm 2010).
For E. coli tRNA1Gln(UUG), the ensemble of nine modified bases has a significant effect on the kinetics of folding but apparently does not influence the equilibrium between properly folded and nonfunctional forms (Fig. 6). This contrasts with human mitochondrial tRNALys, where the m1A modification alone controls the equilibrium between the functional and misfolded forms (Helm et al. 1999b). In this case and others in which a post-transcriptional modification affects folding or stability (Messmer et al. 2009), effects on the kinetics of folding have generally not been addressed, although rates of interconversion of the extended hairpin and cloverleaf forms of human mitochondrial tRNALys have been measured by single-molecule fluorescence resonance energy transfer (Voigts-Hoffmann et al. 2007). In contrast, the assay described here does not require sophisticated instrumentation, allows insights into both the thermodynamics (through equilibrium plateau level) and kinetics of the folding reaction, and directly monitors formation of a functional species.
MATERIALS AND METHODS
Preparation of enzymes
MT GluRSND and E. coli GlnRS were expressed and purified as previously described (Rodriguez-Hernandez and Perona 2011). The Del(172-173) variant of T7 RNA polymerase was used to generate in vitro tRNA transcripts (Lyakhov et al. 1997) and was purified by the approach described for the wild-type enzyme (Grodberg and Dunn 1988). E. coli tRNA nucleotidyltransferase was overexpressed in MM294-4 cells from the vector pSJW1 (Sherlin et al. 2001; Bullock et al. 2003). Two liters of cells were grown at 21°C in LB medium, induced with 1 mM IPTG at A600 of 0.65, and grown for a further 5 h. Cells were recovered by centrifugation; suspended in a buffer containing 0.1 M sodium phosphate (pH 7.5), 25% sucrose, 2 mM β-mercaptoethanol, 1 mg/mL lysozyme, and 1 mM PMSF; and lysed by sonication. DNA was hydrolyzed by addition of DNase to a final concentration of 5 μg/mL, incubation with stirring for 30 min at 4°C for 30 min, and recentrifugation. The clarified lysate was dialyzed into a buffer solution containing 15 mM sodium phosphate (pH 6.5), 1 mM MgCl2, and 2 mM β-mercaptoethanol, applied to a 50 mL DEAE column equilibrated in the same buffer and was eluted with a gradient of sodium phosphate from 40–100 mM. Fractions containing the purified enzyme were dialyzed for storage at −80°C in a solution containing 18 mM Tris-HCl (pH 7.4), 36 mM NaCl, 1.8 mM DTT, and 20% v/v glycerol. Ninety milligrams of tRNA nucleotidyltransferase was recovered. The purity of the enzyme was estimated at >98% based on SDS gel electrophoresis.
Preparation of tRNA transcripts
The E. coli tRNA2Gln transcript containing a catalytically silent U1G mutation was synthesized as described previously (Sherlin et al. 2001) and was purified and stored for use in assays as described (Rodriguez-Hernandez and Perona 2011). Oligonucleotide design and duplex DNA template synthesis for the MT tRNAGln(CUG) were performed as described (Rodriguez-Hernandez et al. 2010). To synthesize the MT tRNA, 5 μg/mL duplex DNA template in a solution containing 40 mM Tris-HCl (pH 8.0), 25 mM MgCl2, 2 μM spermidine, 0.01% Triton-x, 40 mM DTT, and 1 mM each of ATP, GTP, CTP, and UTP was incubated with 120 μg/mL T7 RNA polymerase in a 5 mL reaction for 4 h at 37°C. The reaction was stopped by addition of 0.5 mL of 0.5 M Na2EDTA (pH 8.0) and the RNA product recovered by ethanol precipitation and resuspended in 1.25 mL of pure water. DNA present in the preparation was removed by addition of 40 μL of RQ1 DNAse and incubation for 1 h at 37°C, followed by phenol-chloroform extraction. The tRNA was recovered from the aqueous fraction and loaded at a flow rate of 0.5 mL/min on a Whatman DEAE resin equilibrated in 125 mM Na-Hepes (pH 7.5), 15 mM Mg2+. The column was washed with buffer containing 125 mM Na-Hepes (pH 7.5), 15 mM Mg2+, and 200 mM NaCl, and tRNAGln was eluted in a solution containing 1 M NaCl, 125 mM Na-Hepes (pH 7.5), and 15 mM Mg2+. Integrity of the purified tRNAGln was confirmed by denaturing gel electrophoresis. The tRNA was then repurified by ethanol precipitation and stored at −20°C in 10 mM Tris-HCl (pH 8.0), 1 mM Na2EDTA (TE).
Purification of E. coli tRNA1Gln from cells
One liter of E. coli K12 (MM294-4) cells was grown to saturation in LB media. Cells were centrifuged at 6000 rpm for 10 min, and pellets were resuspended in 20 mL of extraction buffer containing 20 mM Tris-HCl (pH 7.5) and 20 mM magnesium acetate. Cells were phenol:chloroform extracted by gently shaking for 20 min at 21°C and were centrifuged at 14,000 rpm for 5 min. The top soluble layer was recovered and re-extracted. Recovered top layers were concentrated to 1 mL using an 0.22 μm Ultrafree-MC spin column (Millipore) and were ethanol precipitated. RNA pellets were recovered by centrifugation at 14,000 rpm for 30 min, dried, resuspended in 2 mL of 0.2 M Tris-HCl (pH 9.0), and incubated at 37°C for 30 min to deacylate the tRNA. The RNA was again ethanol precipitated, resuspended in 1 M NaCl, and incubated for 48 h at 4°C to precipitate high-molecular-weight RNA. The reaction mixture was then centrifuged at 14000 rpm for 10 min, the pellets were discarded, and the soluble fraction was concentrated and exchanged into TE buffer using Millipore centrifugal devices. The bulk tRNA recovered from these procedures was then loaded onto a denaturing 12% acrylamide gel (dimensions 38 ×32 × 0.2 cm) run at 50 W for 4–5 h. The tRNA band was visualized by ultraviolet shadowing, sliced from the gel, and extracted in TE buffer overnight. Extracted transcripts were concentrated in TE buffer and stored at −20°C until required. About 6 mg of gel-extracted bulk E. coli tRNA was obtained from 2.8 g of cells.
To isolate tRNA1Gln from the unfractionated tRNA, a DNA–RNA hybridization method was used (Yokogawa et al. 2010). To first prepare the affinity column, 600 μL of Streptavidin Sepharose High-Performance slurry (GE Healthcare) was equilibrated in 10 mM Tris-HCl (pH 7.5) using a 0.22 μm Ultrafree-MC spin column (Millipore). After equilibration, the buffer was removed and the resin resuspended in 400 μL TE (pH 7.5) containing 7.5 μM 3′ biotinylated oligodeoxynucleotide of the following sequence: 5′-GGTACCTGGATTCGAACCAGGGAATGCCGGTATCAAAAACC[BioTEG∼Q]-3′.
After incubation for 10 min at 21°C, the buffer was removed by centrifugation at 10,000 rpm for 10 sec, and the coupled resin was washed three times with 10 mM Tris-HCl (pH 7.5). The final concentration of oligodeoxynucleotide bound to the resin was estimated by subtracting the DNA concentration in the flow-through and washes. The oligodeoxynucleotide probe is designed to exclude copurification of tRNA2Gln to the maximum extent possible. The two isoacceptors differ at seven positions; all are included within the sequence of the 41-nucleotide (nt) probe.
Unfractionated tRNA was brought to a concentration of 237 μM in 800 μL of a solution containing 0.9 M tetraethylammonium chloride and 0.1 mM Na2EDTA (hybridization buffer). The material was divided into four Ultrafree-MC spin columns and incubated for 10 min at 42°C in a heat block to allow denaturation of the tRNA. The heat block was then allowed to cool to 21°C. Unbound tRNA was removed by centrifugation, and the resin was washed with 10 mM Tris-HCl (pH 7.5) until A260 reached background. tRNA1Gln was eluted from the resin by addition of 200 μL Tris-HCl (pH 7.5) at 65°C for 5 min, followed by quick centrifugation to avoid cooling down the solution. One percent of the bulk tRNA that was passed through the spin columns was recovered as tRNA1GlnUUG, consistent with the codon usage in E. coli cells (Maloy et al. 1996).
Aminoacylation reactions
Preparation of 3′-32P-labeled tRNAs via the exchange reaction of tRNA nucleotidyltransferase was performed as described (Ledoux and Uhlenbeck 2008; Rodriguez-Hernandez et al. 2010; Rodriguez-Hernandez and Perona 2011). All aminoacylation reactions were performed at 100 mM Na-Hepes (pH 7.0), 10 mM MgCl22+, and 5 mM DTT unless otherwise noted. All reactions were quenched either in 400 mM sodium acetate (pH 5.2) containing 0.01 mg/mL P1 nuclease (Fluka) or in 400 mM sodium acetate (pH 5.2) with 0.1% SDS, followed by addition of P1 nuclease to 0.1 mg/mL. Control reactions confirmed that each approach to quenching is effective (data not shown). Aliquots were spotted on prewashed polyethyleneimine-cellulose TLC plates (Sigma) and developed in 100 mM ammonium acetate, 5% (v/v) acetic acid. The plates were dried and subjected to phosphorimaging: Spots corresponding to [32P]-labeled AMP, Gln-AMP and Glu-AMP were quantitated with ImageQuant (version 5.2), and the data were plotted in Kaleidagraph (version 4.03).
Footprinting analysis of MT tRNAGln
3′-[32P]-tRNAGln(CUG) in the folded and misfolded conformations was digested with 0.1 ng/mL RNase A (Ambion) or 3 units/mL S1 nuclease for 12 min at 20°C. Each reaction also contained 5 μg/μL yeast bulk tRNA to facilitate precipitation of nuclease-digested tRNAGln products. To perform nuclease T1 digestions, a mixture of labeled [32P]-tRNAGln and 2.2 μg/μL yeast bulk tRNA was heated for 5 min to 50°C and then cooled to room temperature. Then 50 ng/mL RNAse T1 was added and the reaction incubated for 12 min at ambient temperature (21°C). All nuclease digestions were quenched by addition of 20 μL inactivation/precipitation buffer (Ambion). The tubes were incubated and left at −20°C for >2 h. The digested tRNAs were precipitated by centrifugation at 14,000 rpm for 30 min, pellets washed with 70% ethanol and dried, and the tRNA samples loaded on a 15% 8M urea denaturing polyacrylamide sequencing gel that was prerun for >3 h at 50 W. The samples were run at 55 W for 7–8 h. The gel was then exposed to a phosphorimager screen overnight and analyzed with ImageQuant (version 5.2). Bands were assigned based on the T1 nuclease digestion ladder.
ACKNOWLEDGMENTS
We thank Benjamin Rauch and Jeremie Lever for providing purified E. coli tRNA nucleotidyltransferase, and Rick Russell for critical reading and comments on the manuscript. This work was supported by a grant from the National Institutes of Health (GM63713) to J.J.P.
Footnotes
-
↵4 Corresponding author.
E-mail perona{at}pdx.edu.
-
Article published online ahead of print. Article and publication date are at http://www.rnajournal.org/cgi/doi/10.1261/rna.030080.111.
- Received August 25, 2011.
- Accepted November 23, 2011.
- Copyright © 2012 RNA Society




