


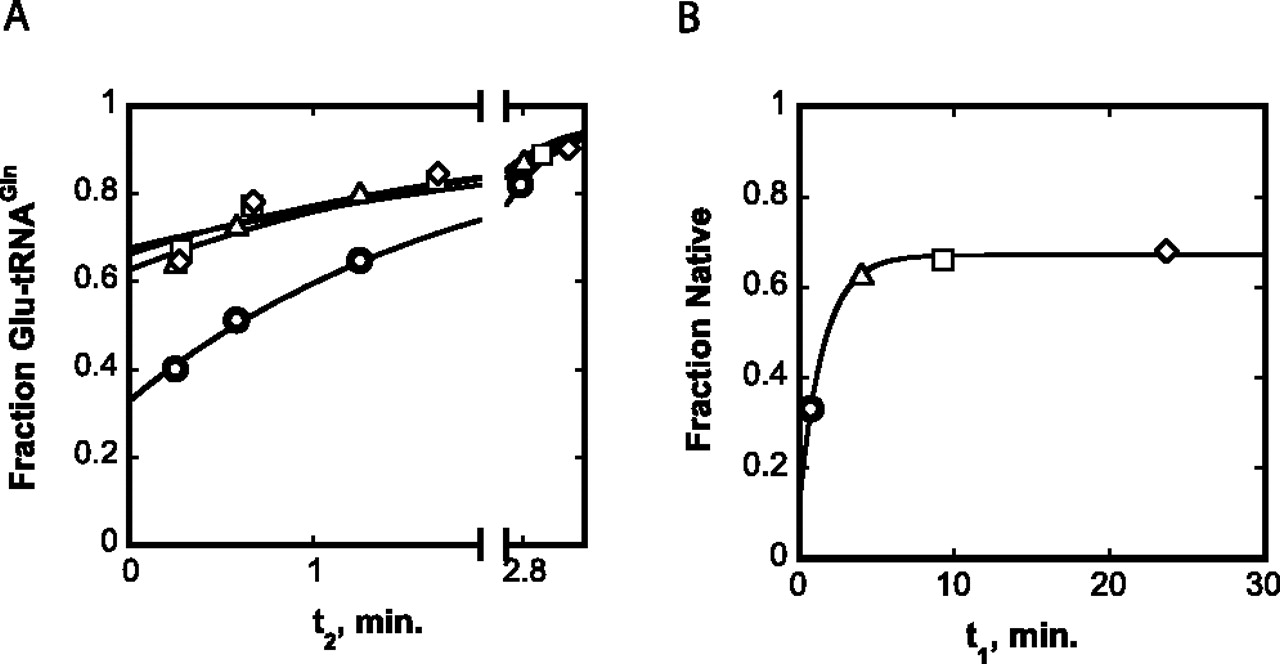
FIGURE 3.
Coupled folding and aminoacylation reactions of MT tRNAGln(CUG) at 37°C. (A) Normalized reaction progress curves using tRNA substrate taken from a folding reaction performed at 37°C. Reactions were initiated by addition of GluRSND to a final concentration of 100 nM, after folding incubation times (t1) of 0.75 min (circles), 4 min (triangles), 9.25 min (squares), and 23.66 min (diamonds). (B) Replots of aminoacylation burst amplitudes from panel A with folding time t1. The burst phase amplitudes are obtained by extrapolation to the ordinate.




