


The influence of the local sequence environment on RNA loop structures
- 1Bioinformatics Group, Max Planck Institute of Molecular Plant Physiology, 14476 Potsdam-Golm, Germany
- 2Bioinformatics Group, Institute for Biochemistry and Biology, University of Potsdam, 14476 Potsdam-Golm, Germany
Abstract
RNA folding is assumed to be a hierarchical process. The secondary structure of an RNA molecule, signified by base-pairing and stacking interactions between the paired bases, is formed first. Subsequently, the RNA molecule adopts an energetically favorable three-dimensional conformation in the structural space determined mainly by the rotational degrees of freedom associated with the backbone of regions of unpaired nucleotides (loops). To what extent the backbone conformation of RNA loops also results from interactions within the local sequence context or rather follows global optimization constraints alone has not been addressed yet. Because the majority of base stacking interactions are exerted locally, a critical influence of local sequence on local structure appears plausible. Thus, local loop structure ought to be predictable, at least in part, from the local sequence context alone. To test this hypothesis, we used Random Forests on a nonredundant data set of unpaired nucleotides extracted from 97 X-ray structures from the Protein Data Bank (PDB) to predict discrete backbone angle conformations given by the discretized η/θ-pseudo-torsional space. Predictions on balanced sets with four to six conformational classes using local sequence information yielded average accuracies of up to 55%, thus significantly better than expected by chance (17%–25%). Bases close to the central nucleotide appear to be most tightly linked to its conformation. Our results suggest that RNA loop structure does not only depend on long-range base-pairing interactions; instead, it appears that local sequence context exerts a significant influence on the formation of the local loop structure.
Keywords
INTRODUCTION
Elucidating the relationship between the primary sequence of biopolymers and their three-dimensional (3D) structure has been a central research theme throughout the history of molecular structural biology (Anfinsen and Haber 1961; Eisenhaber et al. 1995; Shapiro et al. 2007). The basic assumption that the one-dimensional sequence holds all of the information necessary to dictate the resulting 3D structure of the folding processes of proteins as well as those of RNA was proven true. The extent to which the local sequence influences local structure, however, has been answered differently for both of these macromolecular classes. Early on in protein science, it was understood that physical interactions between amino acid residues in close sequence proximity also lead to the formation of defined local structural elements such as α-helices and other secondary structural elements. Because of the validity of this principle—local sequence determines local structure—it was possible to develop structure prediction algorithms that correctly predict local structure based on local sequence information alone (Chou and Fasman 1978; Garnier et al. 1978; Rost 2001), even in the case of β-strands, where nonlocal interactions are also involved. However, it was also shown that long-range sequence context information can influence local structures as well as in the case of “chameleon” sequences—sequences that adopted different structures depending on the larger sequence context (Kabsch and Sander 1984; Sudarsanam 1998). Nonetheless, the general principle that “local sequence influences local structure” is undisputed for proteins.
In contrast, the folding of RNA molecules has been viewed primarily as a process of optimizing long-range (along the sequence) interactions via hydrogen bonding–mediated canonical base-pairing, leading to the formation of RNA-helices, and these long-range interactions dominate over any local structural propensities. The nucleotides that are not involved in these helical (secondary structural) elements serve as connectors between helical segments and provide the degrees of freedom in which the RNA molecule adopts an energetically minimal structure or an ensemble of equally favorable conformations. They also contribute to the overall folding of the RNA molecule via sequence long-range interactions involving noncanonical base pairs, single base stackings, base-phosphate, or base-ribose contacts. Thus, by and large, the process of RNA appears to be governed by nonlocal sequence complementarity leading to helix formation with subsequent global energy optimization within the conformational degrees of freedom provided by unpaired regions (loops). This view is further supported by the high physicochemical similarity of the four different bases making up RNA molecules as opposed to the 20 amino acid types that are very different with regard to size, polarity, charge, and structural flexibility. Thus, the capacity to encode structural specificity seemed limited for RNA molecules. However, even in RNA helices, differences in stability have been reported for permutations of particular sequences, indicating that the order of bases; i.e., the actual sequence, does have an effect on local structure (Freier et al. 1985). Furthermore, the influence of the specific sequence context on the formation of certain structural base-pairings and other intramolecular contacts (e.g., base-phosphate contacts) has been discussed (Leontis et al. 2002; Stombaugh et al. 2009; Zirbel et al. 2009).
In a recent study, we showed that for RNA loops and segments a detectable preference for defined loop structures for particular local sequences (Schudoma et al. 2010) appears to exist. Below a level of sequence divergence of ∼25%, loop sequences were observed to adopt very similar local structures. Above this level of sequence dissimilarity, the respective local structures differ significantly, suggesting that local sequence does influence local structure. The observation of differing nucleotide frequency distributions among different secondary structure elements is another indication of the relevance of sequence context on structure (Smit et al. 2006, 2007, 2009). These varying distributions imply that an RNA sequence might locally fold into a secondary structure element specified by the local sequence context. Additionally, local sequence plays an important role in the formation of certain RNA structural motifs, such as Kink-turns, which depend on consecutive G/A, A/G base pairs and will in general not form when these base pairs are absent (e.g., due to modifications in vitro). An exception to that is the Thermus thermophilus Kink-turn Kt-23, where the local sequence environment seemingly permits the formation of the motif despite an A/U pair replacing the G/A pair (Schroeder and Lilley 2009). Furthermore, despite being similar, the individual bases A, C, G, and U, nonetheless, have different physicochemical properties (ring size, functional groups, number of hydrogen acceptors/donors, electronic properties), reflected, e.g., in the different IUPAC nucleic acid redundancy codes (Cornish-Bowden 1985). Thus, even this—in comparison to proteins—small sequence alphabet allows a broad sequence-encoded diversity and specificity that might play a role in structure formation. If the mechanism of “local sequence determines local structure” indeed exists for RNA molecules, then the prediction of local structure based on sequence information alone ought to be possible, constituting the focus of this study.
The 3D conformation of a biopolymer is largely describable by the conformation of its backbone. While evidently amino acid side-chains or nucleotide bases, respectively, are critically responsible for the folding itself, their geometric detail is not needed to describe the conformation of the molecule. The conformational space of the protein backbone is defined by two torsion angles (ϕ and ψ) as rotational degrees of freedom per amino acid residue. The third dihedral angle along the peptide backbone, ω, is constrained to 180°, or 0° in few cases. In contrast, the RNA backbone conformation is composed of six torsion angles (α, β, γ, δ, ε, and ζ) per nucleotide. Although recent studies have established the rotameric character of the RNA backbone (Murray et al. 2003) and found discrete conformations based on subsets of the backbone torsions between dinucleotide “suite” units (Richardson et al. 2008), the six-dimensional nature of the RNA backbone conformational space renders the conformational search space high-dimensional and impedes ab initio RNA 3D structure prediction attempts. Therefore, a simplified backbone model, preferably one with fewer dimensions while maintaining the descriptive character of the original backbone, is desirable. One such approach is the pseudo-torsional η/θ-space (Duarte and Pyle 1998), which yields a two-dimensional description of RNA backbone conformation using the two torsion angles η (C4′n-1, Pn, C4′n, Pn+1) and θ (Pn, C4′n, Pn+1, C4′n+1) between the C4′- and P-atoms of consecutive nucleotides n−1, n, and n+1 (Fig. 1). A discretization of the η/θ-space was proposed (Wadley et al. 2007), and the corresponding map is shown in Figure 2. The discretized η/θ-space consists of six conformational clusters representing nucleotides of nonhelical conformation with C3′-endo ribose-pucker (Fig. 2, left panel) and four conformational clusters with C2′-endo ribose pucker (Fig. 2, right panel). Clusters in η/θ-space are shown as contour plot, with individual contours representing different frequency density levels. The η/θ-space has since been used for the detection and classification of conformational features (Duarte et al. 2003) and for nucleotide conformer and sugar pucker prediction in RNA crystallography model building (Keating and Pyle 2010).
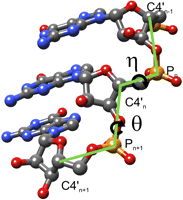
η/θ pseudo-torsion angle definitions of an RNA backbone conformation. η of a nucleotide n is a dihedral angle defined by the C4′-atom of the preceding nucleotide n-1, the C4′- and P-atoms of n and the P-atom of the succeeding nucleotide n+1. θ of n is the dihedral angle between the C4′- and P-atoms of n and n+1. Figure produced with UCSF Chimera (Pettersen et al. 2004).
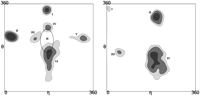
η/θ density maps. Maps of η/θ backbone conformations for nucleotides with C3′-endo pucker (left) and C2′-endo pucker (right). In each map, conformational clusters (I–VI [C3′-endo] and I–IV [C2′-endo]) are shown as contours according to their standard deviation levels (dark gray indicates s4; medium gray, s2; and light gray, s1). The ellipse labeled H shows the conformational subspace for nucleotides with helical conformation. Figure data adapted from Wadley et al. (2007).
In this article, we further explore and characterize the sequence–structure relationships for RNA loops. By applying sequence analysis and machine learning techniques, we assess the potential of the information contained in the local sequence context for RNA structure prediction. Following similar protein-directed approaches based on Support Vector Machines (SVM) (Kuang et al. 2004; Zhang et al. 2005; Zimmermann and Hansmann 2006; Wu and Zhang 2008; Kountouris and Hirst 2009), we employed Random Forests (RF) and demonstrate that a correct η/θ structural state classification of a central nucleotide from its surrounding sequence context is possible. Our results support the notion that the local sequence indeed has a significant effect on local RNA loop structure.
RESULTS
Generation of a data set integrating sequence context and backbone conformational information in RNA loops
We generated a nonredundant (<60% pairwise sequence identity) data set from all RNA structures at 4.0 Å resolution or better that were contained in the Protein Data Bank (PDB) in January 2011. The data set consisted of 97 individual RNA chains (cf. Supplementary File S1) with 12,286 nucleotides (nt). Of these, 5888 nt were involved in the secondary structure and therefore ignored. Two thousand seven hundred six nucleotides could be assigned to an η/θ conformational cluster, making up the s1 data set (all conformational clusters). The s2 data set contains 2180 nt from the helical cluster, all six C3′-endo clusters, and C2′-endo clusters II–IV, and the s4 data set consists of 1730 nt from the helical cluster; C3′-endo clusters I, II, VI; and C2′-endo clusters II and IV. Using these data sets, we generated sequence windows of lengths 3 (1464 unique windows) to 23 (1589 unique windows).
Sequence fragments map specifically to regions in the conformational space
Evidently, an approach that aims to predict structural states based on sequence would be invalidated if it was observed that a large portion of sequences exists in multiple structural states, or put differently, we wanted to determine the critical sequence window length at which the structural state becomes unique, if at all. Therefore, we determined how many and which sequences are shared between the η/θ conformational clusters by examining whether identical sequences occur as a sequence context for nucleotides belonging to different η/θ clusters. Testing sequence windows of length 3–23, we found that uniqueness of structural state associated with particular sequence is quickly achieved as the length of the sequence window increases. Sequence windows of lengths 9 and longer essentially map uniquely to only one η/θ cluster, with only 0.7% of the sequences of length 9 mapping to more than one cluster (Table 1). As expected, shorter sequences are structurally more ambiguous. At length 3, no sequence is associated with only one η/θ cluster. Evidently, the theoretically possible sequence space grows exponentially with sequence length. Thus, sampling from this vast space is increasingly unlikely to yield identical sequence sets as the length increases.
Observed sequence and structural-state strings
Thus, we were able to establish a lower threshold for the sequence window length surrounding a central nucleotide as a reasonable choice for sequence-based prediction attempts. Considering at least 4 nt on either side of a central nucleotide (window size 9) (Table 1) already appears to guarantee uniqueness of structural state given the data set under study. This, however, is not equivalent to concluding that structure prediction will be successful, as there may not be a criterion by which similar sequences map to identical η/θ clusters or that “rules” can be extracted that associate sequence differences with differences in structural state. In comparison, when representing a fragment not by its actual sequence, but by a string of five secondary structural states (see Materials and Methods), the uniqueness of the structural state associated with particular structure strings is achieved significantly slower. In fact, only after examining additional windows of lengths 25 and 27, can uniqueness comparable to that of 9mer sequences be observed (0.86% shared structures at window length 27) (cf. Table 1 and Fig. 3). Thus, the structural state of a central nucleotide is more influenced by the actual sequence rather than being determined by the structural states of its neighbors. (Note that since even more different [five] structural states were defined than the four different bases associated with sequence string, the uniqueness of the structure-string should actually be achieved faster as the associated space is larger and, thus, actual data occupancy is sparser.)
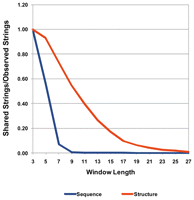
Sequence and secondary structural-state strings occurring as environments of multiple conformational clusters. For different window sizes, sequence environments (blue) were compared with secondary structural (orange) environments in string representation (cf. Materials and Methods). x-axis indicates window size; y-axis, fraction of (sequence resp. structural) environments shared between two or more conformational clusters over all observed environments.
Sequence motif analysis reveals sequence motifs related to η/θ conformation
Having established that above a certain sequence length (9 or more) (Table 1), nucleotide sequences were observed to map uniquely to specific η/θ clusters and thus adopt defined backbone conformations, we next investigated whether the different sequences mapping to the same cluster exhibit common sequence motifs. Successfully identifying motifs would indicate the existence of specific attractors in sequences space associated with every η/θ-cluster such that similar sequences would map to similar structures. For the majority of consensus sequences, we were not able to find any conformation-specific sequence signal since these sequences mainly consist of the quadruple-degenerate symbol N. However, we were still able to discover subsequences with possible descriptive power for the backbone conformation of the central nucleotide. There is only one sequence (UAAGCACAACCUG) representing the C2′-endo I contained in the data set. Therefore we ignore this cluster, since we cannot compute a proper sequence motif in such a case. Clusters with a characteristic sequence pattern are C3′-endo I (position relative to central nucleotide: +1, consensus: ANNA), C3′-endo II (−4, GNNKARA), C3′-endo IV (−3, G), C2′-endo II (0, U), and C2′-endo III (−6, SNBCNNAGWA). Interestingly, the single-position motifs of C3′-endo IV and C2′-endo II are maintained in the noise resulting from increasing the sequence length when examining longer window sizes. Table 2 provides an overview over all found sequence motifs, and the corresponding positional information of the central nucleotides within the respective 3D structure can be found in Supplementary File S2. Taking only the s4 clusters (i.e., C3′-endo I, II, and VI and C2′-endo II and IV; cf. Materials and Methods) into consideration, we additionally find consensus pattern for C3′-endo cluster VI (+1, A, 84 sequences) and C2′-endo cluster IV (+1, WMMGSN, 43 sequences). Furthermore, we can refine the consensus sequences for C3′-endo cluster I (−3, SNGBAGNAM, 21 sequences), C3′-endo II (−4, GNBKAAA, 114 sequences), and C2′-endo II (−6, UKNGANKNNYNSC, 14 sequences). Thus, we found evidence for the existence of sequence motifs to be associated with specific clusters, suggesting that a sequence-based prediction of backbone conformation defined here as η/θ clusters could be successful as similar sequences can be expected to fall into the same η/θ cluster. A sequence motif captures a specific sequential arrangement of nucleotides. It could also be possible that other features such as dependencies between different sequence positions would be informative for cluster assignment. Such differences would not immediately be apparent as distinguishable motifs. In order to fully exploit all of the information contained in the sequences, we applied RF as an advanced machine learning technique to the problem of predicting η/θ clusters.
Consensus sequences in 13mer windows
Backbone conformation can be predicted from sequence context
We used RF to predict the η/θ-cluster membership (four to six clusters; cf. Materials and Methods) of individual nucleotides based on its surrounding sequence context. The accuracies of the predictions for size-balanced sets were determined in a cross-validation setting (Out Of Bag [OOB]; cf. Materials and Methods) and are listed in Table 3 for various tested fragment lengths. Using sequence information alone, the best average accuracy (∼55%) was achieved for fragment length 13 when merging the helical cluster with the C3′-endo VI and C2′-endo IV clusters (due to their spatial proximity in η/θ-space; cf. Materials and Methods). The results are better than 12 percentage points compared with the accuracies from predictions treating C3′-endo VI and C2′-endo IV as separate clusters and excluding the helical cluster (∼43%) or are better than 17 percentage points to those predictions including it (∼38%). Prediction accuracies were observed to be relatively constant across all tested fragment lengths with only a slight performance gain noticeable for lengths 9 or more relative to length = 7 (Table 3) and with almost no further improvement for longer fragments. Aiming to assess the information contents already contained in the purine/pyrimidine chemical classification of the four bases, we reduced the sequence alphabet to the R/Y ambiguity scheme. For the R/Y predictions, an average accuracy of 43% was achieved for the merged-cluster case. Note that the input sequence space was inevitably reduced because of high redundancy caused by the limited alphabet.
Fraction of correct Random Forest predictions of η/θ-cluster memberships
Since most RNA secondary structure prediction attempts have obtained increasingly reliable results (Tinoco et al. 1971, 1973; Gutell et al. 2002; Hofacker et al. 2002; Mathews 2006) and experimental techniques make it possible to relatively quickly determine the paired bases across an RNA molecule (Weeks 2010), we tested whether the knowledge of the secondary structural state of the sequence window further boosts prediction accuracy. In order to assess the maximal gain (i.e., the best case scenario) from including this type of structural information, we took the secondary structural state assignments from the actual RNA structure as annotated by MC-Annotate (Gendron et al. 2001). Note that the central nucleotide is by definition not part of any canonical base pair and is therefore always located in an unpaired region. Using only the secondary structure information for all nucleotides in the sequence fragments derived from the actual structure as input data yielded a predictive accuracy of 38% at best (with merged helical, C3′-endo VI, and C2′-endo IV clusters) and 25% when attempting to predict membership to the helical; C3′-endo I, II, and VI; and C2′-endo II, IV clusters. Predictions based purely on secondary structure were also only possible for window sizes of at least 15, due to input data sparsity resulting from the higher level of redundancy on the secondary structure level compared with the sequence level.
When combining sequence and secondary structural information, the accuracies improve only marginally, if at all, compared with sequence input alone. We achieved up to 57% accuracy for predictions including structural information with merged clusters (a two percentage point increase), up to 48% when excluding the helical cluster, and up to 42% when including it. Combining sequence input from the R/Y alphabet and secondary structure yielded up to 51% accuracy (with merged clusters).
The random chance of correctly guessing a cluster is ∼17% for all five s4-clusters and the helical cluster and is 25% when merging it with clusters C3′-endo VI and C2′-endo IV. (Note that we tested our prediction approach on same-size clusters in order to avoid any abundance bias. Thus, the chance prediction has been estimated for equal cluster sizes as well. In terms of successful predictions, equal cluster sizes represented the most challenging situation.) Thus, by chance, the prediction accuracy can only be expected to be between 17% and 25% assuming equal cluster sizes. This is confirmed by testing the prediction approach on randomized data (Fig. 4). The actual prediction results are significantly better than expected by chance (P = 1.60 × 10−06 for sequence-only data, P = 6.61 × 10−06 when additionally using structural data, respectively).
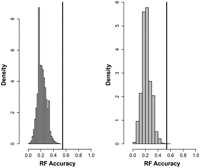
Comparison of actual prediction accuracy versus predictions using randomized input data. (Left) Sequence-only (window size 13). (Right) Sequence + structural information. The histogram represents the probability density obtained from 150,000 randomized predictions; the actual accuracy using the true input associated with its assigned η/θ cluster is indicated by a vertical line.
In addition to using RF as the classification engine, we also applied SVMs to the prediction task at hand and obtained similar prediction performance results (data not shown).
Mutual information reveals importance of the central 5mer
We next investigated which positions within a sequence fragment are most informative with regard to the structural state of the central nucleotide. For all positions within a sequence window of a given length (3, 5, …, 23), we computed the mutual information of the nucleotide column vector (the vector of all nucleotides at a particular positions across all sequences of a given length) and the associated vector of η/θ-cluster assignments for the respective central nucleotides. We tested all different cluster definitions based on standard deviation levels (s1, s2, s4) both with and without fragments in which the central nucleotide is in helical conformation. We compared our results to a 1000-fold randomization of either the sequences or the assigned clusters (both with and without keeping the original distribution of clusters). The results are shown exemplarily for fragments of window size 13 from the s4 clusters (C3′-endo I, II, and VI; C2′-endo II and IV) in Figure 5.
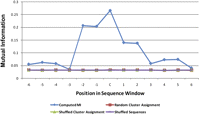
Mutual information between the position-specific sequence composition and conformational class of the central nucleotide in a segment. The plot shows the mutual information for 13mer sequences occurring in clusters at the s4 standard deviation level (C3′-endo I, II, and VI and C2′-endo II and IV). On the x-axis, each position is labeled with an index relative to the central nucleotide (C). The blue line shows the computed mutual information computed for actually observed segments; the other overlapping lines represent the mutual information for random data (red indicates randomly assigned cluster; green, randomly assigned cluster while preserving the distribution of clusters; and purple, shuffled sequences), respectively.
Despite the overall rather low mutual information content (MIC), we can observe an approximate sixfold increase of MIC within the 5-mer around the central nucleotide relative to random levels and terminal fragment regions. This result was obtained similarly for all other fragment sizes. Thus, the central positions were found to be most informative. Of course, the low MIC is also explained by the range of variables (4 nt) being smaller than the number of states (η/θ clusters); i.e., it is impossible or unlikely that nucleotide-cluster pairings are unique. It should be noted that the significantly increased MIC values in the actual sequences compared with randomized ones also allows us to conclude that the obtained MIC values are not a result of data sparsity, as then the MICs for randomized sequences would have been equally high. Thus, despite the small alphabet size of only four, there is a tendency for particular bases to occur in particular η/θ clusters.
Relationships between backbone conformation and local sequence context
Following our previous analyses on sequence–structure relationships in RNA loops (Schudoma et al. 2010), we examined the influence of the divergence of local sequence context on the η/θ conformation of a nucleotide. The boxplot in Figure 6 shows the results of systematic pairwise comparisons of angular and sequence similarity over all sequence fragments between 3 and 23 bases. The y-axis depicts angular dissimilarity as a fraction of maximum possible angular Euclidean distance (180° × √2), whereas the x-axis measures sequence divergence as the normalized Hamming distance between two fragments. The boxplots show two distinctive regions along the x-axis. The first region ranges from 0% to ∼37% sequence dissimilarity. This region is characterized by the lower quartiles ranging between ∼3% (∼7.6°) and ∼8% (∼20.4°) angular dissimilarity and the upper quartiles being generally <40% (∼101.8°) angular dissimilarity. The second region exhibits almost completely homogenous lower-to-upper quartile ranges from ∼8% to ∼10% (∼20.4° to ∼25.5°, lower quartile) to ∼43% (∼109.5°, higher quartile). The median angular distance ranges between ∼5% (∼12.7°), found between 0% and 25% sequence dissimilarity, and ∼20% (∼51°), found between 50% and 100% sequence dissimilarity. Between 25% and 50% sequence dissimilarity, a relatively steep transition in median angular distance occurs. Overall, the graph shows sigmoidal behavior. We fitted a logistic curve lc = C/(1 + (exp(−(A + BδH))))—with δH being the normalized Hamming distance and A, B, and C being the fitted parameters of the curve—to the median data points to qualitatively and quantitatively capture the overall association. Qualitatively, the more sigmoidal the curve, the sharper is the transition from similar to dissimilar η/θ conformations as a function of increasing sequence divergence. Quantitatively, the inflection point of the logistic curve (lc ∼ 0.1 at ∼25% sequence dissimilarity) may operationally mark the point of conformational transition from similar to different. The median structural dissimilarity converges at ∼20% of the maximally possible Euclidean angular distance. This relatively low level can be explained by the low probability of a pairwise 180° × √2 distance for both pseudo-torsional angles simultaneously given the discretized conformational space (Fig. 2). Since very many observations (pairs) entered the median calculations, the convergence level appears relatively sharp.
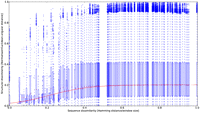
Relationship between nucleotide backbone conformation and local sequence context. The graph shows boxplots angular Euclidean distance (normalized by maximum distance 180 × √2°) between pairs of segments as a function of their respective sequence dissimilarity given as a fraction of maximal Hamming distance. Each boxplot displays all pairwise angular comparisons (with the box capturing the median and the 75% and 25% percentiles) for a given level of sequence dissimilarity. A logistic function (red curve) has been fitted to the median data points to reveal the sigmoidal behavior and to identify the inflection point.
DISCUSSION
In this report, we presented evidence that the RNA 3D structure, as given by its sugar-phosphate backbone conformation, at least partially is determined by the local sequence context. We identified the central 5mer of a sequence context as the most important source of information for the backbone conformation of a nucleotide. Using machine learning techniques, we were able to predict the conformational class of individual nucleotides significantly above random levels using only sequence information. The prediction results were further improved upon using additional structural information as input. It should be noted that we performed predictions for size-balanced sets in order to eliminate any potential frequency bias (cf. Fig. 2). Thus, the obtained better-than-random prediction performance is attributable to local sequence context alone. Running predictions without balancing cluster sizes returned ∼80% of correct predictions even in a cross-validation setting (data not shown). However, frequency bias may have been the dominant factor contributing to these high prediction accuracies without informing on the significance of local sequence context.
Furthermore, we identified groups of sequences that appear to influence the backbone conformation of a nucleotide to adopt a certain backbone conformation. In identifying the informative positions within a nucleotide fragment using Mutual Information, we investigated what essentially could be called zero-order MIC; i.e., one nucleotide position in isolation. It would be interesting to study higher-order effects, such as combinations of nucleotides even between noncontiguous sequences positions.
The central result, local sequence determines local structure, provokes the question as to what the underlying physical interactions are that relate sequence variations to different structural states. Even though the four different bases occurring in RNA molecules are very similar, they do differ. First, they can be subdivided into two main classes: purines and pyrimidines. A corresponding prediction experiment using a two-letter code with respect to the purine/pyrimidine classification yielded an average accuracy of ∼43% (∼49% including secondary structure information), thus still above random levels. Furthermore, the four bases differ, albeit slightly, with regard to their physico-chemical properties (e.g., electronic structure, hydrogen-bonding potential, details of hydration). Thus, it appears that the specific nucleotide sequence causes differences in the local physical interactions, leading the formation of distinct backbone structures in a sequence-dependent manner. This concept has long been established for protein sequences. Here we show that it also applies to RNA molecules.
Alternatively, our findings could also be explained by an overall sequence homology across the entire RNA molecule, leading to a globally similar folding of the whole molecule. Recently, it was established that above a certain level of sequence similarity (60% or more), two different molecules adopt similar structures (Capriotti and Marti-Renom 2010). The short fragments used in this study could in effect function to identify globally similar sequences, and thus, the local structural similarity may still be a consequence of global sequence–structure relationships and not a local effect. However, there are two arguments against this alternative explanation. First, the data set of RNA structures was chosen to be nonredundant with regard to sequence similarity, according to the 60% sequence identity cutoff established by Capriotti and Marti-Renom (2010). Thus, the risk of globally similar structures based on high global sequence identity was reduced. Evidently, there is a trade-off between more stringent data set criteria and data set size. Second, we found that optimal prediction results were obtained already for relatively short sequence fragments, and more importantly, prediction accuracy did not improve further as longer fragments were used in the prediction (Table 3). If the successful prediction results were a result of global homology, prediction performance would be expected to rise with longer fragment length as the detection of global homology would be more faithful. Evidently, our findings would be confirmed most convincingly by experimental means. Similar to studies in peptides that related sequence to formation of helical structures (Muñoz and Serrano 1994), measuring short nucleotides in solution and detecting the preferred conformations would provide the strongest evidence for our findings.
With this study, we contribute to the growing effort of RNA structure prediction, in particular to the structures of RNA loops. In order to develop a predictor for a more detailed η/θ conformational space, more structural data are required. This applies especially for those clusters that we could not include in our predictions due to their small sample set size. Sharper cluster boundaries and a better definition for cluster membership, especially for the helical cluster, are necessary improvements to continue working on the conformational prediction of nucleotide sequences. In conclusion, our study sheds new light on the sequence–structure relationships in RNA loops revealing the presence of a “local sequence determines local structure” rule. Thus, the findings of this study may prompt new experimental approaches to interrogate the folding of RNA and may prove useful for RNA structure design.
MATERIALS AND METHODS
Data set generation
As per January 18, 2011, the PDB (Berman et al. 2000) held 1325 RNA-containing structures determined by X-ray crystallography with 4 Å resolution or better. We used ModeRNA (Rother et al. 2011) to examine each structure for possible problems, such as interrupted backbones, missing atoms, etc. For each structure, we computed base pair annotations using the software MC-Annotate (Gendron et al. 2001). We only considered RNA chains without canonical base-pairings to other RNA chains (e.g., as seen in crystals of RNA duplexes and RNA/DNA hybrids). We then grouped together structures with identical sequences and, if necessary, chose the least problematic structure as representative. From this set, we built a nonredundant, representative RNA data set with <60% pairwise sequence identity between structures (percentage of identical bases over the alignment length) following a selection procedure introduced by Hobohm et al. (1992: algorithm 2). This sequence identity cutoff was chosen according to results reported by Capriotti and Marti-Renom (2010). It represents an effective global sequence identity threshold above which any two RNA sequences can be considered structurally similar.
Structural parameters
Secondary structure was assigned as the subset of canonical base pairs according to the MC-Annotate base pair annotation. As descriptors of local RNA backbone conformation, we chose the η- and θ-pseudo-torsion angles using the conformational clustering as proposed in (Wadley et al. 2007). In brief, based on a grid cast on the η/θ-map containing all individual bases, density (counts per grid cell) thresholds were introduced below which η/θ-grid cells were ignored. With increasing density thresholds, discontinuous clusters emerge. As the density threshold is further increased, fewer clusters containing fewer bases remain. We generated three sets of nucleotides: s1, s2, and s4. The s1 set refers to the lowest density threshold, where s1 refers to 1 standard deviation (SD) above the average grid cell density. Likewise, s2 and s4 refer to 2 and 4 SDs, respectively. Accordingly, the number of clusters decreases from s1 to s4, so does the number of bases. When additionally taking their sugar pucker configuration into consideration, nucleotides can be assigned to one of 10 known nonhelical clusters in η/θ-space (Fig. 2). Of these 10 clusters, six (C3′-I–C3′-VI) are associated with nucleotides with a C3′-endo sugar pucker configuration (0° ≤ P ≤ 36°), whereas the remaining four (C2′-I–C2′-IV) are associated with C2′-endo-puckered nucleotides (144° ≤ P ≤ 180°). Furthermore, nucleotides can be classified as helical if they display structural similarity (RMSD ≤ 0.85Å) to a reference nucleotide (1XMQ, nucleotide 1207:A) (K Keating, pers. comm.) in helical conformation. Nucleotides in helical conformation form an additional conformational cluster (∼150° ≤ η ≤ ∼195°, ∼190° ≤ θ ≤ ∼260°). Due to sparse population, most clusters (C3′-endo clusters III, IV, and V and C2′-endo clusters I and III) are only visible as individual conformational attractors when taking areas with densities threshold levels into consideration (Wadley et al. 2007; K. Keating, pers. comm.). The s4 set includes C3′-endo clusters I, II, and VI and C2′-endo clusters II and IV. Set s2 additionally includes C3′-endo clusters III, IV, and V and C2′-endo cluster III. Finally, the C2′endo-cluster I is only contained in set s1. If cluster membership could not be established (e.g., for the first and last nucleotides of a structure, due to the definition of η and θ, or in case of a nonstandard sugar pucker), we marked the nucleotide as unclassified.
We then filtered the set of nucleotides according to the following criteria:
-
A nucleotide must have a sugar pucker conformation of either C3′-endo (0° ≤ P ≤ 36°) or C2′-endo (144° ≤ P ≤ 180°).
-
A nucleotide must either be assigned to one of the 10 nonhelical clusters (according to its coordinates in η/θ-space) or have helical conformation (according to structural similarity). In case of meeting both criteria, the nucleotide will be ignored in order to avoid overlaps between clusters.
-
A nucleotide must not be part of any canonical (cis W/C A/U, U/A, C/G, G/C or wobble G/U, U/G) base pair, since such nucleotides generally adopt helical conformation.
To obtain the local sequence/structural context for a nucleotide, we extracted structural fragments of varying sizes (w = 3, 5, …, 23; i.e., a central nucleotide is flanked by ⌊w/2⌋ nucleotides on either side) by sliding a window along each structure. Pseudo-torsion angles (η, θ), and sugar pucker phase angles, P, were computed using the software DANGLE (Chen et al. 2010).
Application of the RF machine learning method for the prediction of η/θ-cluster memberships
RF is a nonparametric ensemble machine learning method. The method generates several decision trees (a “forest”) and aggregates their results (Breiman 2001). Each individual tree is fitted to a bootstrap sample of the data, and each node in the tree is split using the best of a randomly selected subset of the input features (in our case the base or secondary structure classification at a given nucleotide position). Using bootstrap sampling, the left-out samples, called the OOB (Out Of Bag) data, allow performing cross-validation as the RF is built. The majority of votes of the used classification trees provide an unbiased estimate of the overall prediction of the forest. For the practical advantages of the RF method, the reader is referred to Grömping (2009) and Lee et al. (2005). Our computations were carried out using the R package randomForest (Liaw and Wiener 2002) with the default setting, apart from an increased number of classification trees (the parameter n-tree was set to 1000). To create a clean input data set, we applied a filtering routine on the original data sets to remove redundant and ambiguous instances as explained above. Due to large discrepancies in cluster sizes, we performed 100 prediction runs, randomly drawing samples from the larger clusters in order to match the size of the smallest cluster and thus balancing the set sizes, thereby eliminating any frequency bias. Each such input data set was then split into a training set (2/3) and a test set (1/3) and submitted to 15 RFs of 1000 decision trees each. As the final result, we took the mean of all 15 RFs results. The significance of the results was evaluated by permuting the data set 10,000 times and performing the same predictions on each permutation.
As input data, we used the actual sequence information of window sizes w ranging from {7, 9, …, 17}. Each window represents the local sequence context of the central nucleotide nc = ⌈w/2⌉ with 5′- and 3′-sequence flanks of length ⌊w/2⌋. We only considered nucleotides with η/θ-conformations associated with the helical cluster and clusters from the s4-data set (C3′-endo clusters I, II, and VI and C2′-endo clusters II and IV), since it is the one with the most robust and well-defined clusters. In two separate predictions, we (1) ignored the helical cluster and (2) merged the C3′-endo VI and C2′-endo IV clusters since they coincide in η/θ-space and merely differ in their sugar pucker and additionally merged them with the helical cluster due to the spatial proximity of all three clusters in η/θ-space.
Aside from only using sequence information, the secondary structural state of the window was also used as input in order to assess by how much the predictive power can be increased, when the secondary structure is used in addition to sequence information. The secondary structure state information used an alphabet similar to protein secondary structure, indicating the type of secondary structure motif a nucleotide is part of (H indicates helix [paired]; E, hairpin loop; N, internal loop/bulge; M, multiloop; D, dangling end). The total input vectors are therefore of size w (sequence-only) and 2w (sequence + secondary structure).
Structural analysis
We examined the influence of the local sequence context on the η/θ conformation of a nucleotide by comparing the relation of angular (i.e., structural) distance and sequence similarity over all sequence windows of lengths 3–23 for all conformational clusters.
For all pairs of sequence windows Wi, Wj of length L with central nucleotides ci, cj, we computed the respective angular and sequence distance δH,η,θ(i,j) = [δH(i,j), δη,θ(i,j)], where δH(i,j) is the Hamming distance between sequences Wi, Wj and δη,θ(i,j) is the Euclidean distance between the η/θ angles associated with ci and cj. We then computed all δmedη,θ(k), i.e., the median δη,θ for all δH,η,θ with δH = k (i.e., the median over all sequence windows with equal sequence dissimilarity) and normalized by dividing by the maximum possible angular distance between any two sequence windows (180° × √2). Finally, we plotted all δmedη,θ(k) against the sequence dissimilarity as given by the percentage of the maximum possible Hamming distance, i.e., the window length L itself.
Sequence analysis
Sequence profile computation
For each set of sequences belonging to a cluster in the η/θ-space, we computed a sequence profile and consensus sequence according to a modified version of the rules by Cavener (1987).
-
A single base is shown if its frequency is >50% and at least twice as high as the second most frequent base.
-
A double-degenerate code indicates that the corresponding two bases occur in >75% of the sequences and the second highest base frequency is at least twice as high as the third.
-
A triple-degenerate code indicates that the remaining base occurs in at most 5% of all sequences.
-
All other frequency distributions are represented by the letter “N.”
Mutual information content
We used the concept of mutual information to assess the relevance of specific sequence positions for the η/θ-conformation
of the central nucleotide. For each data set s1, s2, s4 with and without the helical cluster, we aligned all sequence fragments
associated with a particular window length L and computed the mutual information, I, between the sequence vector, X, at a particular position across all aligned sequence fragments and the vector, Y, of η/θ-cluster assignments associated with the respective central nucleotide as follows: Mutual information of random variables X and Y.
SUPPLEMENTAL MATERIAL
Supplemental material is available for this article.
ACKNOWLEDGMENTS
C.S. thanks Swati Jain (Duke) for technical assistance with the Dangle program and Kevin Keating (Yale) for providing the data underlying Figure 2 and for help with determining the η/θ-cluster memberships. The work of A.L. was supported by the German Ministry for Education and Research (GABI-ENERGY 0315045).
Footnotes
-
↵3 Corresponding author.
E-mail schudoma{at}mpimp-golm.mpg.de.
-
Article published online ahead of print. Article and publication date are at http://www.rnajournal.org/cgi/doi/10.1261/rna.2550211.
- Received November 19, 2010.
- Accepted April 15, 2011.
- Copyright © 2011 RNA Society




