


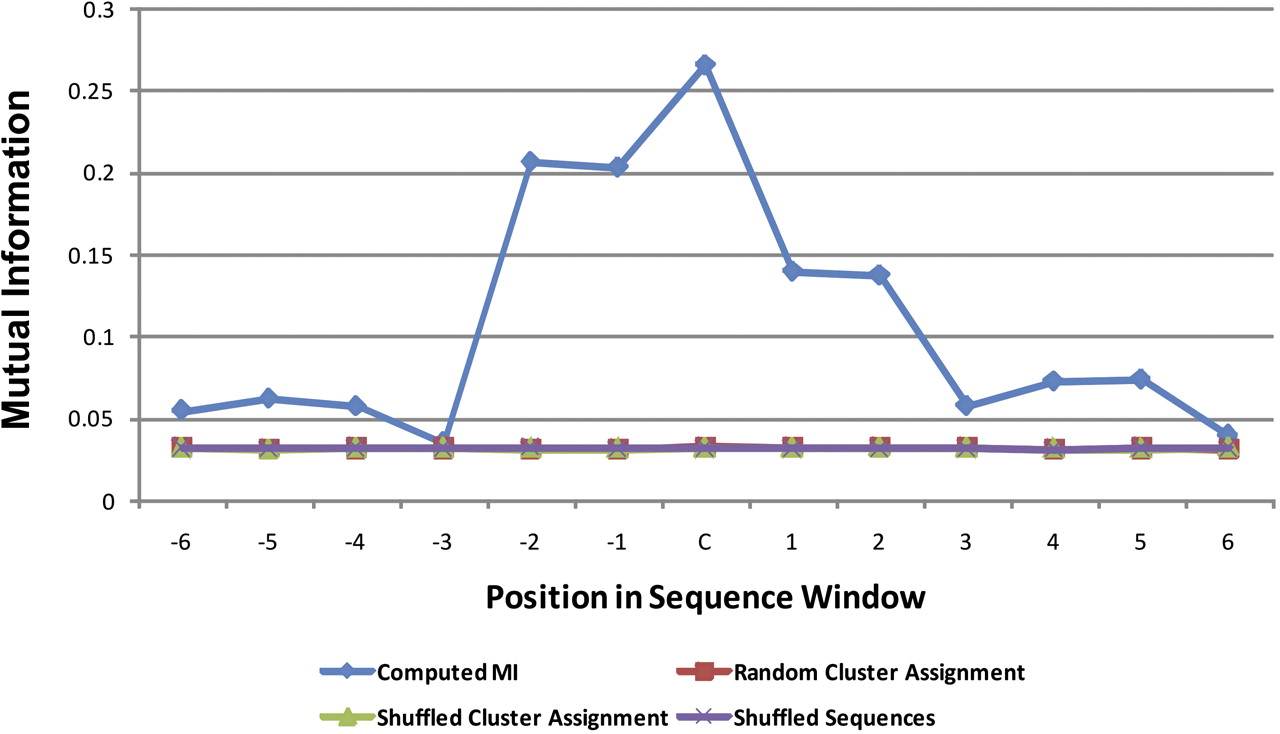
Mutual information between the position-specific sequence composition and conformational class of the central nucleotide in a segment. The plot shows the mutual information for 13mer sequences occurring in clusters at the s4 standard deviation level (C3′-endo I, II, and VI and C2′-endo II and IV). On the x-axis, each position is labeled with an index relative to the central nucleotide (C). The blue line shows the computed mutual information computed for actually observed segments; the other overlapping lines represent the mutual information for random data (red indicates randomly assigned cluster; green, randomly assigned cluster while preserving the distribution of clusters; and purple, shuffled sequences), respectively.




