


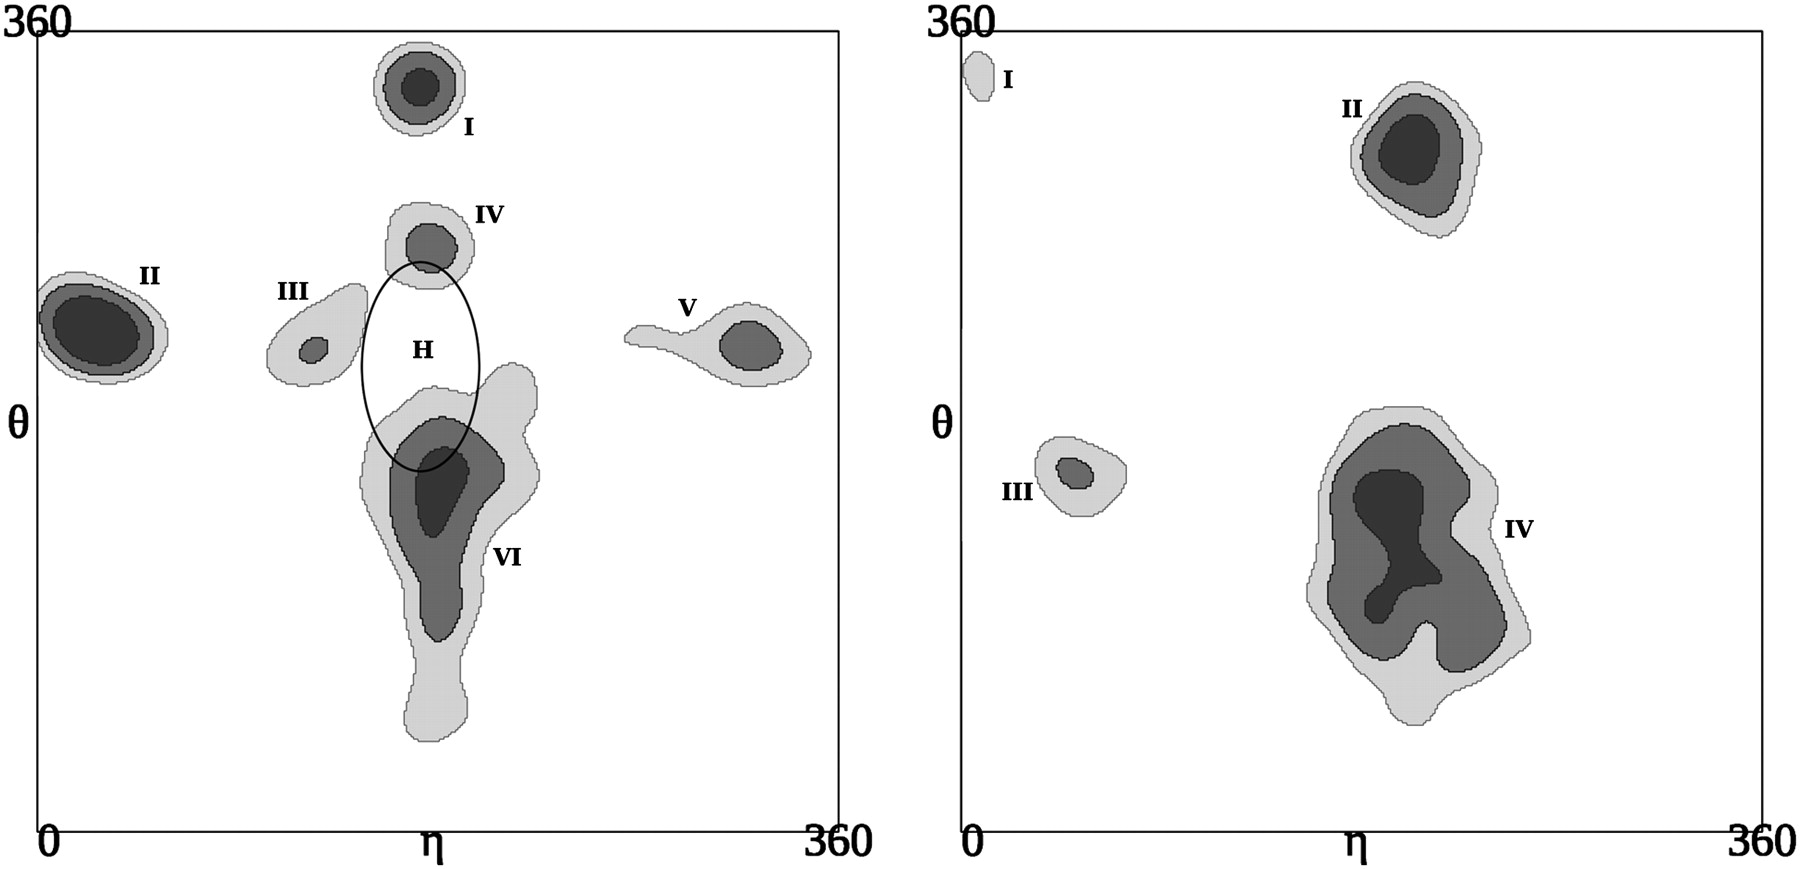
FIGURE 2.
η/θ density maps. Maps of η/θ backbone conformations for nucleotides with C3′-endo pucker (left) and C2′-endo pucker (right). In each map, conformational clusters (I–VI [C3′-endo] and I–IV [C2′-endo]) are shown as contours according to their standard deviation levels (dark gray indicates s4; medium gray, s2; and light gray, s1). The ellipse labeled H shows the conformational subspace for nucleotides with helical conformation. Figure data adapted from Wadley et al. (2007).




