


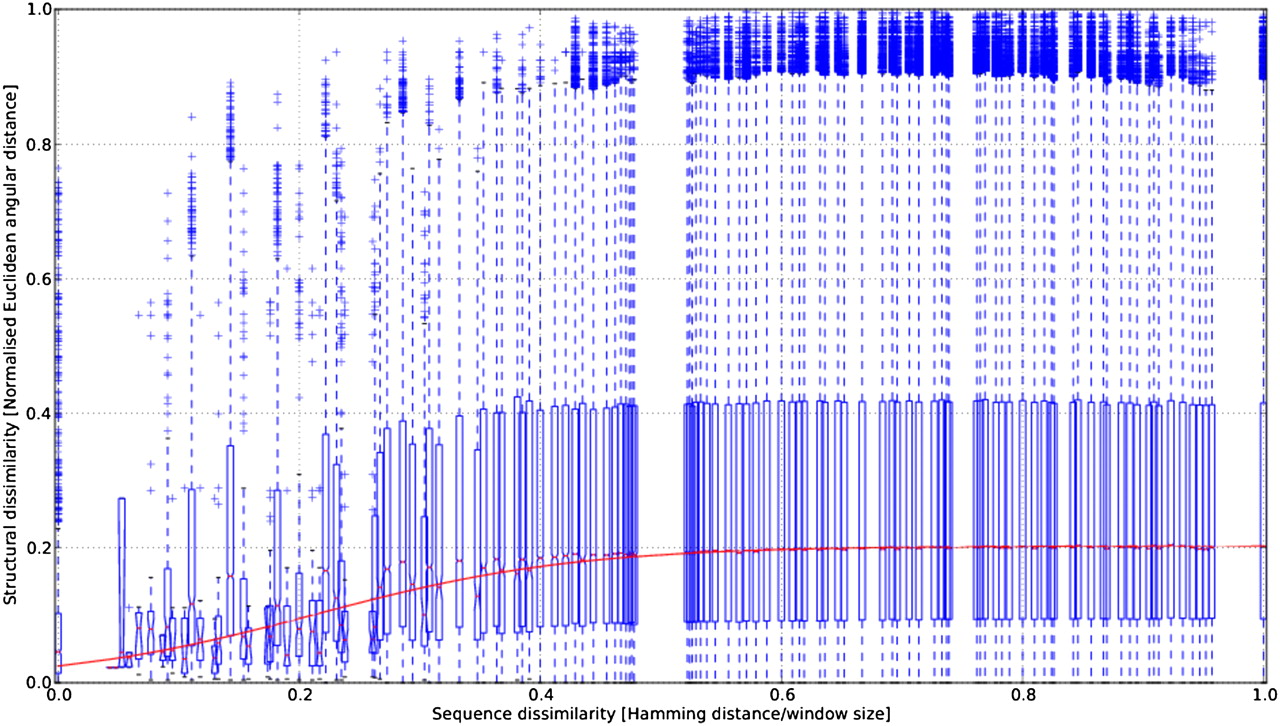
FIGURE 6.
Relationship between nucleotide backbone conformation and local sequence context. The graph shows boxplots angular Euclidean distance (normalized by maximum distance 180 × √2°) between pairs of segments as a function of their respective sequence dissimilarity given as a fraction of maximal Hamming distance. Each boxplot displays all pairwise angular comparisons (with the box capturing the median and the 75% and 25% percentiles) for a given level of sequence dissimilarity. A logistic function (red curve) has been fitted to the median data points to reveal the sigmoidal behavior and to identify the inflection point.




