


Solution structure of RNase P RNA
- Alexei V. Kazantsev1,
- Robert P. Rambo2,
- Sina Karimpour1,
- John SantaLucia Jr.3,
- John A. Tainer4 and
- Norman R. Pace1
- 1Department of MCD Biology, University of Colorado, Boulder, Colorado 80309, USA
- 2Life Sciences Division, Lawrence Berkeley National Laboratory, Berkeley, California 94720, USA
- 3Department of Chemistry, Wayne State University, Detroit, Michigan 48202, USA
- 4Department of Molecular Biology, Skaggs Institute for Chemical Biology, The Scripps Research Institute, La Jolla, California 92037, USA
Abstract
The ribonucleoprotein enzyme ribonuclease P (RNase P) processes tRNAs by cleavage of precursor-tRNAs. RNase P is a ribozyme: The RNA component catalyzes tRNA maturation in vitro without proteins. Remarkable features of RNase P include multiple turnovers in vivo and ability to process diverse substrates. Structures of the bacterial RNase P, including full-length RNAs and a ternary complex with substrate, have been determined by X-ray crystallography. However, crystal structures of free RNA are significantly different from the ternary complex, and the solution structure of the RNA is unknown. Here, we report solution structures of three phylogenetically distinct bacterial RNase P RNAs from Escherichia coli, Agrobacterium tumefaciens, and Bacillus stearothermophilus, determined using small angle X-ray scattering (SAXS) and selective 2′-hydroxyl acylation analyzed by primer extension (SHAPE) analysis. A combination of homology modeling, normal mode analysis, and molecular dynamics was used to refine the structural models against the empirical data of these RNAs in solution under the high ionic strength required for catalytic activity.
Keywords
INTRODUCTION
Ribonuclease P (RNase P) is a multiple turnover ribozyme responsible for endonuclease maturation of the 5′-ends of tRNAs and a growing list of other small RNAs (for review, see Kazantsev and Pace 2006; Marvin and Engelke 2009). In bacteria, RNase P consists of a large, ∼400-nt RNA (∼130 kDa) and a small, basic protein cofactor (∼14 kDa). In archaeal and eucaryal RNase P, additional proteins unrelated to the bacterial protein are present and correlate with a decrease in the size and structural complexity of the RNA moiety (Evans et al. 2006; Ellis and Brown 2009). The specific functions of the protein components of RNase P remain subjects for debate (Marvin and Engelke 2009; Esakova and Krasilnikov 2010), but the role of the RNA is clearly catalytic: The RNase P RNA components from all three domains of life are evolutionary homologs and can catalyze tRNA maturation in vitro independently of protein cofactors (Guerrier-Takada et al. 1983; Pannucci et al. 1999; Kikovska et al. 2007).
RNase P RNA is a metalloenzyme and catalyzes a divalent metal ion-dependent hydrolysis of substrate phosphodiester bonds (Smith and Pace 1993; Beebe and Fierke 1994; Persson et al. 2003). Some chemical groups important for substrate recognition and catalysis have been identified in the RNA, protein, and substrate pre-tRNA, and energetic contributions to the reaction have been investigated in some detail (for review, see Kirsebom 2007). Few of the reaction details are understood in the context of molecular structure, although efforts to determine the structure of RNase P have resulted in significant progress. Extensive phylogenetic-comparative analyses established the basic secondary structure of the RNA. All RNase P RNAs have a common core and vary in the presence or absence of appendages that participate in tertiary interactions and stabilize the global structure of this large RNA. There are two types of the bacterial RNA, A-type and B-type, which differ in some of these tertiary structure elements. Crystal structures have been determined for independently folding “catalytic” (C-domain) and “specificity” (S-domain) structural domains of the A- and B-types of the bacterial ribozymes (Krasilnikov et al. 2003, 2004; Kazantsev et al. 2009), for two full-size A- and B-type RNAs (Kazantsev et al. 2005; Torres-Larios et al. 2005) and, more recently, for the ternary complex between the A-type holoenzyme and the product tRNA (Reiter et al. 2010). In addition, crystal structures of bacterial (Stams et al. 1998; Spitzfaden et al. 2000; Kazantsev et al. 2003) and archaeal RNase P protein components (for review, see Evans et al. 2006) have been solved, as well as a complex of two eucaryal proteins with a peripheral RNA fragment (Perederina et al. 2010).
Despite these significant advances, a complete structural perspective on RNase P in solution is not available. The crystal structures of both full-size A- and B-type RNase P RNAs are incomplete, apparently, due to disorder in crystals (Kazantsev and Pace 2006). As the result, the overall architectures of the A- and B-type RNAs deduced from the RNA-alone crystal structures are notably different, which is unexpected for homologous molecules, and also differ from the conformation that RNA adopts in the ternary complex (Reiter et al. 2010). One unusual feature exhibited by the crystal structure of the B-type RNA alone is the remarkably flat shape of the substrate-binding surface (Fig. 1A). The apparently featureless flat docking face made it difficult to hypothesize how the coaxial stack of the acceptor and T-arm of tRNA (the main structural feature recognized by RNase P RNA) binds to the B-type RNase P RNA without invoking a significant conformational change. The crystal structure of an A-type RNase P RNA alone appears to have a more concave shape, suggesting the substrate-binding surface (Fig. 1A) that was recently confirmed in the structure of the ternary complex, but the overall structure of the free RNA is clearly distorted, highlighted by the disruption of a critical long-range helix (P6) and rearrangement of the surrounding helical domains to form artificial contacts in the crystalline lattice. These crystal structures raise the important question of how well static crystal-based structures represent the solution structures, the active conformations that the RNAs would assume without the structural constraints imposed by the crystalline lattice.
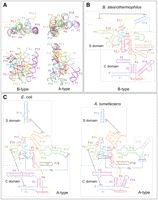
Bacterial RNAse P RNA structures. (A) Crystal structures of RNase P RNA from B. stearothermophilus (B-type) and T. maritima (A-type). Paired elements of the structure (P1, P2, etc.) are labeled in the order of their occurrence from the 5′-end. (B) Secondary structure of the B-type RNase P RNA (B. stearothermophilus). Dashed lines mark independently folding structural domains. Solid lines indicate long-range docking interactions. Helical elements of the structure are labeled and colored according to A. (C) Secondary structures of the A-type RNase P RNAs, from E. coli and A. tumefaciens.
Here, we report a comprehensive solution study of three phylogenetically and structurally diverse RNase P RNAs using small angle X-ray scattering (SAXS), selective 2′-hydroxyl acylation analyzed by primer extension (SHAPE) analysis, and molecular modeling. We find that the solution structures of these ribozymes, under the high ionic strength required for activation of their catalytic properties independently of the protein cofactors, are best described by small ensembles of well-folded conformations that likely reflect the natural flexibility of these multisubstrate enzymes.
RESULTS
RNA species chosen for the analysis
Bacterial RNase P RNAs, at 350–400 nt, are suitable targets for low-resolution studies by SAXS. In order to generalize results with RNase P RNA and provide a comparative perspective, we analyzed three structurally distinct RNase P RNAs, including two A-type RNAs and one B-type RNA. Structural interpretation of RNA SAXS data in solution is complicated by the presence of misfolded species that often arise during purification and refolding procedures and may hamper structural interpretation of the SAXS data (Rambo and Tainer 2010b). While contamination by misfolded species can be minimized with high-resolution gel-filtration chromatography (below), rational selection of the RNA species for SAXS analysis is expected make a significant contribution to generating interpretable data of high quality.
In the case of the B-type RNase P RNA, the moderately thermophilic RNA from Bacillus stearothermophilus (Fig. 1B) was an obvious choice: This RNA can be easily refolded by simple annealing procedures to form a sample amenable to crystallization (Buck et al. 2005a; Kazantsev et al. 2005). The choice of the A-type RNA was less obvious. The RNA from the hyperthermophilic Thermotoga maritima (Torres-Larios et al. 2005), while crystallizable, appears to favor a grossly misfolded conformation at ambient temperature when unbound to the product tRNA (Fig. 1A). A critical feature of this RNA structure is the A-type-specific helix P6 that is formed from base-pairing across disparate regions within the RNA sequence (Fig. 1C). An intact helix P6 would result in tight packing of helices P15, P16, and P17 (Chen et al. 1998; Massire et al. 1998), the proper orientation of important substrate-recognition element L15 (Kirsebom and Svard 1994; Oh and Pace 1994) with respect to the highly conserved catalytic core, and likely contribute to the conformational stability of the catalytic core (Buck et al. 2005b). Instead, in the crystallized form of the T. maritima RNA, helices P15, P16, and P17 are misoriented and the stretches of complementary nucleotides that normally form P6 in cis are base paired in trans with a neighboring RNA molecule in the crystalline lattice to form a dimer of misfolded molecules. This unexpected conformation may have resulted in the course of preparation of this RNA for crystallization (Torres-Larios et al. 2005).
Consequently, we chose mesophilic representatives of the A-type RNase P RNA for solution analysis. One RNA, from Escherichia coli (Fig. 1C), has been extensively studied biochemically, and available data suggest that it can be easily folded into a compact, predominantly monomeric form (Fang et al. 2001; Buck et al. 2005a). The E. coli RNA has a short helix P6 of only 4 bp, however, and may be as prone to unpairing as the P6 in the T. maritima RNA, which also is 4 bp. We therefore chose an additional RNA for structural studies in solution, the RNase P RNA from the mesophilic soil bacterium Agrobacterium tumefaciens (Fig. 1C). This RNA is catalytically active under high ionic strength, characteristic of all of bacterial RNase P RNA species (Brown et al. 1991) and its P6 element is predicted to contain 7 bp, potentially more stable than the 4-bp helix P6 of E. coli.
Preparation of RNA samples to minimize refolding artifacts
A number of techniques have been developed for the preparation of folded RNA samples suitable for structural studies, including denaturing (Golden and Kundrot 2003; Ke and Doudna 2004) and nondenaturing methods (Kieft and Batey 2004; Batey and Kieft 2007; Kim et al. 2007). Although it has been well-documented that bacterial RNase P RNAs can refold within minutes at 37°C and millimolar concentrations of Mg2+ (for review, see Baird et al. 2007), the homogeneity of the folded states has rarely been studied. To optimize sample preparation for our SAXS studies, we used high-resolution gel-filtration chromatography (HR GF) coupled with multiangle light scattering (MALS) (Rambo and Tainer 2010b) in solution to assess the hydrodynamic homogeneity of RNase P RNA samples prepared by both denaturing and native techniques in order to optimize sample preparation for our SAXS studies.
Purification of in vitro transcribed RNA by denaturing methods followed by annealing has been used extensively to generate RNA samples suitable for crystallization (Holbrook et al. 2001; Golden and Kundrot 2003; Ke and Doudna 2004; Mooers 2009). We find that in the case of the B. stearothermophilus (Bst) RNA, refolding of the denatured RNA by slowly cooling over several minutes in the presence of 25 mM Mg2+ and 200 mM K+ generates a highly homogeneous sample that elutes as a sharp, symmetric peak from an HR GF column (Fig. 2A, Bst, “annealed”). Molecular weight measurements by MALS are consistent with monomeric RNA eluting as the major peak with a small fraction of dimer preceding the well-separated monomer. In contrast, a similar annealing procedure applied to the A. tumefaciens (Atu) RNA failed to generate a homogeneous sample (Fig. 2A, Atu, “annealed”); the annealed Atu RNA eluted as a broad asymmetric peak, suggesting severe conformational heterogeneity. Attempts to optimize an annealing procedure for the Atu RNA, including variation of ionic and temperature conditions, failed to improve the homogeneity of the RNA samples for SAXS.
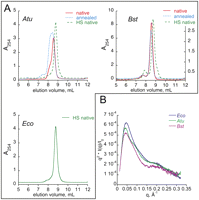
Sample preparation for SAXS experiments. (A) Chromatographic profiles of RNA samples prepared by different techniques. RNA from A. tumefaciens (“Atu”), B. stearothermophilus (“Bst”), or E. coli (“Eco”) was prepared by refolding from denatured state (“annealed”), nondenaturing method according to Batey and Kieft (2007) (“native”) or by transcription at elevated ionic strength and nondenaturing purification (“HS native”), and analyzed by high-resolution gel-filtration chromatography on Shodex KW 803. Absorbance at 254 nm is plotted versus retention time. (B) Kratky plot representation of the scattering data from RNA samples prepared by HS native method.
Alternative methods for preparation of folded RNAs suitable for biophysical studies avoid denaturation and refolding steps. Typically, RNA is allowed to fold cotranscriptionally, under relatively low ionic strength, in the presence of divalent metal ions (25 mM Mg2+, no additional monovalent), and purified by chromatography. Application of the “native” purification method to Bst RNase P RNA transcribed by T7 RNA polymerase yields a homogeneous sample of essentially the same quality as the renaturation procedure (Fig. 2A, Bst, “native”). In the case of the Atu RNA, however, this native purification yielded RNA with heterogeneity reduced, but not completely removed (Fig. 2A, Atu, “native”). Although monomeric (as assessed by MALS), the resulting Atu RNA eluted as a major peak comparable in profile to the Bst RNA sample, but heavily contaminated by a leading shoulder that represents a second stable conformer.
The occurrence of multiple conformers of the Atu RNA indicates, as seen for other RNAs, that much of the molecular population is kinetically trapped, preventing proper folding (Pan and Sosnick 1997; Pan et al. 1999; Buck et al. 2005b). Since ionic strength influences folding of some RNase P RNAs and high ionic strength is required for catalytic activity of RNase P RNA (Guerrier-Takada et al. 1983; Siegel et al. 1996), we surmised that the concentration of monovalent salt during in vitro transcription could influence the cotranscriptional folding of RNase P RNA. Although the T7 RNA polymerase used for in vitro synthesis of these RNAs is severely inhibited by salt concentrations exceeding 300 mM (data not shown), RNAs could be prepared by transcription in 200–300 mM K+ (Materials and Methods). Atu RNA transcripts synthesized under this condition appeared homogeneously folded and monomeric (Fig. 2A, “HS native”).
High-resolution gel-filtration chromatography is highly reproducible, so it is noteworthy that both Bst and Atu RNAs prepared by the HS native method exhibit slightly longer retention times on the HR GF columns than do RNAs prepared by annealing or transcription at low ionic strength, suggesting that preparation by the HS native method results in more compactly folded states of RNAs than does annealing or the low-salt native methods described above. The HS native protocol also generates a highly homogeneous sample of the Eco RNase P RNA (Fig. 2A, Eco). We therefore propose that cotranscriptional folding at moderately high ionic strength, followed by nondenaturing purification, may be a superior method for the preparation of homogeneously folded large RNAs for biophysical studies.
Sample quality by SHAPE and SAXS
To further assess the folded states of the different RNase P RNAs prepared by the HS native method, we used selective 2′-hydroxyl acylation analyzed by primer extension (SHAPE), which identifies flexible nucleotides in RNA structure based on their reactivity toward acylating agents, e.g., NMIA (Wilkinson et al. 2006). Consistent with available crystallographic data and with previous studies on the Bacillus subtilis RNase P RNA homolog (Mortimer and Weeks 2009), only a handful of nucleotides in the Bst RNA exhibited notable reactivity toward NMIA (Supplemental Fig. 1). These nucleotides are located in loops that tend to be poorly ordered in crystal structures (Krasilnikov et al. 2003; Kazantsev et al. 2005). In turn, nucleotides that are involved in base-pairing, extensive noncanonical structures (e.g., in the catalytic core), or long-range docking interactions (e.g., L5.1, L15.1, L8, P10.1, and L12) were nonreactive to NMIA. The pattern of reactivity of the Eco RNA followed similar general trends: Nucleotides involved in formation of canonical helices or long-range docking interactions do not exhibit notable reactivity to NMIA (Supplemental Fig. 1). Particularly interesting in light of the misfolded T. maritima structure, helix P6 was nonreactive, indicating that the sample is dominated by completely folded molecules.
The Atu RNA RNase P RNA exhibited overall notably higher reactivity to NMIA compared with the Bst and Eco RNAs (Supplemental Fig. 1). Sensitive sites included many highly conserved nucleotides in the interhelical junctions comprising catalytic core (J 3-4, J15-18, J19-1), indicating that the local structure of this mesophilic RNA is rather flexible. However, nucleotides in the elements of the structure expected to be involved in long-range docking interactions (L9, L13, L14, and L18) were nonreactive to NMIA (Supplemental Fig. 1), indicating that these docking interactions were completely formed. Importantly, helix P6 was intact: Six of seven canonical base pairs predicted by comparative analysis were nonreactive. We conclude that Atu RNA prepared by the HS native method is in a folded state despite relatively high local conformational flexibility.
The high qualities of the RNA samples prepared by HS native method were further confirmed by the SAXS data. Guinier plots and overlay plots of the SAXS scattering profiles from several concentrations suggested no aggregation in the samples (Table 1; Supplemental Fig. 2) and Kratky plots for all three RNAs prepared by the HS native method (Fig. 2B) approached zero at high values of momentum transfer (q), indicating the samples were void of random coils and indeed well-folded. P(r) distributions calculated for the scattering curves of each RNA peaked around 45 Å (Supplemental Fig. 3), in agreement with the prediction from crystal structures that A-form helices packed side-by-side dominate folding of these RNAs.
Rg and Dmax values estimated from experimental data (“SAXS data”), unperturbed (“Manual model”), and optimized RNA models (“EOM”)
Ab initio modeling fails to define unique scattering envelopes
Determination of the solution structures of these RNAs requires superimposition of molecular structure with the scattering envelopes extracted from SAXS. We initially attempted to reconstruct solution-scattering envelopes of the RNAs by ab initio modeling with DAMMIF (Franke and Svergun 2009) and auxiliary programs. This approach works well for monodisperse compact particles that are not inherently flexible and has been successfully utilized in a recent study of the VS and c-di-GMP ribozymes to generate scattering envelopes of sufficient quality for structural interpretation at the level of relative orientation of helical domains (Lipfert et al. 2008; Kulshina et al. 2009).
We found that, despite the excellent quality of the samples, the ab initio modeling from the SAXS data collected for all three RNAs was insufficient in defining uniquely interpretable scattering envelopes (Supplemental Fig. 4). Averaging and filtering of several ab initio modeling runs led to poorly superimposed ensembles (Kozin and Svergun 2001; Volkov and Svergun 2003) or oblate shapes with no features that would be instructive for structural interpretation at the resolution of A-form helices or independently folding structural domains (Supplemental Fig. 4). One reason for such an outcome could be intrinsic conformational flexibility in the folded RNA samples, for instance, movement of the independently folding structural domains or smaller features with respect to each other, which may be undetectable by a combination of HR GF and SHAPE used above. Because all conformations in solution contribute to the overall scattering from any sample, such heterogeneity would have a “blurring” effect on the appearance of the reconstructed, averaged envelope and hamper structural interpretation.
Generation of all-atom RNA models
As an alternative to ab initio-based building of a molecular structure to fit the observed scattering envelopes, we generated all-atom models of the RNase P RNAs for iterative fitting against observed SAXS scattering data. The atomic models of the three RNAs were generated by utilizing available phylogenetic and crystallographic information, as detailed in Materials and Methods. Briefly, the model of the Bst RNA was constructed by superimposing the incomplete crystal structure of the Bst RNA with the crystal structure of the S-domain from the B. subtilis homolog (Krasilnikov et al. 2003), then modified to conform to the sequence and the secondary structure of the Bst RNA. The final model (Fig. 3, Bst) containing all 417 nt of the Bst RNA, was regularized by restrained local energy minimization with CNS (Brunger et al. 1998) in order to minimize local geometry errors introduced by manual modeling. The radius of gyration (Rg) and maximal length (Dmax) calculated for this manual model are close to the parameters estimated from the SAXS data (Table 1) and the theoretical scattering profile calculated from this model fits the scattering data with |2 of 2.25, indicating that the initial flat model represents the solution conformation of the Bst RNA reasonably well, with small differences only at q > 0.25, as assessed by the residual analysis (Fig. 3).
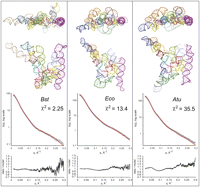
(Top) All-atom models of the RNase P RNA variants. RNA models were generated in silico by taking into account available crystallographic and phylogenetic information. Elements of the structure are colored according to Figure 1. (Middle) Agreement between theoretical scattering profiles calculated from the models (red line) and experimental SAXS data (open circles). (Bottom) Distribution of the residuals (Idata/Imodel) vs. q.
For an A-type RNase P RNA, a significant portion of the observed crystal structure (Fig. 1A) is severely misfolded, and because the lengths of helices involved in long-range docking interactions differ between the T. maritima and the Eco and Atu RNAs, these A-type RNAs were modeled from smaller, predictable pieces of structure, taking into account available crystallographic data as a general guide. In this process, the independently folding S- and C-domains of Eco and Atu RNAs were modeled separately to conform to the sequence and structural constraints imposed by the phylogenetically refined secondary structures of these RNAs (Fig. 1C), and then docked, guided in general by the T. maritima crystal structure. Complete models were regularized by local energy minimization with appropriate geometry restraints.
This modeling and optimization procedure resulted in compact RNA models of reasonable quality (see Materials and Methods), with all known base pairs and docking interactions accounted for, and with the highly conserved core regions folded according to the available crystallographic information. However, although Rg and Dmax parameters calculated from these models are in reasonable agreement with their estimates from SAXS data (Table 1), theoretical scattering profiles calculated from these models disagree with experimental data, as illustrated by poor goodness-of-fit values in Figure 3 (|2 values 13.4 for the Eco and 35.5 for the Atu model), and relatively large residuals at q > 0.20 for Eco and throughout the most of the q range for the Atu model, indicating significant differences between these A-type static models and the conformational properties in solution.
Fitting structure to solution envelope with EOM and NMA
A number of computational techniques have emerged in recent years that allow improvement of atomic models to achieve a better agreement with observed SAXS data such as the ensemble optimization method (EOM) (Bernado et al. 2007; Putnam et al. 2007; Rambo and Tainer 2010a). In EOM, a large set of conformationally different models are generated from a set of starting models to generate a large pool of reasonable conformational alternatives; small ensembles of conformers are then selected from the pool by a Monte Carlo–based genetic algorithm to maximize the agreement between theoretical scattering by a selected ensemble and the experimental data. The key barrier in this approach is to ensure that the conformational space is sampled sufficiently such that the desired conformations are not missed.
One attractive method for conformational sampling uses molecular dynamics simulations (Pelikan et al. 2009; Stoddard et al. 2010). An advantage of this computationally intensive method is flexibility in terms of restraining the model during the course of the simulations. MD simulations are highly sensitive to, and restricted by, the starting conformation, and so may fail to capture significant motions in macromolecular models based primarily on homology and biochemical information, e.g., the Eco and Atu RNA models described above. Since such collective motions in macromolecules often correlate with perturbations along elastic normal modes (Delarue and Sanejouand 2002; Tama et al. 2003; Mitra et al. 2005; Matsumoto and Ishida 2009), we investigated whether coarse-grain normal mode analysis (NMA) (Tirion 1996) combined with the ensemble optimization method (Bernado et al. 2007) could extract structural models of these RNase P RNAs with improved fit to the SAXS data.
For each of the RNAs, a pool of 1051 nonredundant conformers was generated by perturbing the initial model along five lowest elastic normal modes, including all bimodal perturbations (see Materials and Methods for details). Each perturbed structure was further refined by restrained local energy minimization to correct for unrealistic bond lengths and angles that are introduced by NMA at high amplitudes. This resulted in pools of conformers with maximal deviations of peripheral structural elements up to 10–11 Å from the starting models, with typical RMSDs of ∼1.1 Å between consecutive structures along any perturbation trajectory. As shown in Figure 4, these pools exhibit distributions of Rg and Dmax values that are centered at the peak values characteristic of the unperturbed models (Supplemental Table S1), with the spread of up to 2 Å in Rg and up to 10 Å in Dmax values.
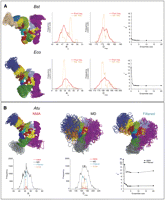
Conformational pools for ensemble optimization. (A) All-atom models of Bst and Eco RNase P RNA perturbed along five lowest elastic normal modes. Ribbon diagrams of the 50 endpoints of perturbation trajectories are shown on the left, colored according to Figure 1. Rg and Dmax frequency distributions plotted on a relative scale illustrate spread of these values in the pools of the 1051 conformations used for ensemble optimization (“Pool freq.”). Rg and Dmax distributions in a typical optimized ensemble of 10 conformations that fit the experimental data best (Fig. 5) are also shown (“Sel. Freq.”). (Far right) Dependence of the goodness-of-fit parameter χ2 on the size of optimized ensemble n (n = 0 corresponds to the unperturbed models shown in Fig. 3). (B) Conformational pools for ensemble optimization of Atu RNA. (Top) Ribbon diagrams of the 50 endpoints of perturbations along elastic normal modes (“NMA”) are compared with the endpoints of 104 torsion molecular dynamics trajectories (“MD”) and to 65 conformations selected at random from a pool of 12,684 conformations obtained by filtering the MD pool to exclude conformations with unrealistic Rg and Dmax (“Filtered”). (Bottom) Rg and Dmax frequency distributions plotted on absolute scale illustrate spread of these values in the conformational pools prepared by NMA perturbations (“NMA”, 1051 conformations), torsion MD simulations (“MD”, 52,000 conformations), or filtered pool combined with the NMA-perturbed pool (13,735 conformations). Rg and Dmax distributions in a typical optimized ensemble of 10 conformations that fit experimental data best (Fig. 5) are also shown on relative scale (“EOM”). (Far right) Dependence of the goodness-of-fit parameter χ2 on the size of optimized ensemble n for selections from a pool of 1051 NMA-perturbed conformations (“NMA”) compared with the selections from a pool of 13,735 filtered MD conformations (“Filtered”); n = 0 corresponds to the unperturbed model shown in Figure 3.
Application of EOM to these conformational pools for the Bst and Eco RNAs resulted in ensembles of well-folded conformations (Fig. 5, Bst, Eco) that fit scattering data better than the initial manual models shown in Figure 3. Maximum-likelihood superposition (Theobald and Wuttke 2006) shows that conformations selected in the case of Bst RNA differ primarily by the relative orientations of the S- and C-domains (Fig. 5). The parts of the model that exhibit maximal deviations in the selected ensembles, the tops of the S-domain and helix P19) correspond well with the parts of the structure that are disordered in the crystals of Bst RNA (Kazantsev et al. 2005). This suggests that the perturbation-selection procedure used here can recapture natural motions in this RNA.
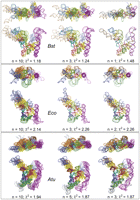
Representative conformational ensembles that fit SAXS data best. Typical optimized ensembles of indicated size selected for Bst and Eco RNA from the pools of 1051 NMA-perturbed conformations and for Atu RNA from a pool of 13,735 filtered MD-perturbed conformations. For each RNA, minimal ensembles that fit experimental data best are shown on the right, superimposed onto the unperturbed model from Figure 3 (black ribbon).
Ensembles selected in the case of the Eco RNase P RNA are similar in predicting some degree of motion for the S-domain, the P16–P17 element and the phylogenetically highly variable peripheral helix P3 (Fig. 5). Analysis of the dependence of the goodness-of-fit parameter |2 on the size of the selected ensemble indicates that for the Bst RNA conformational pool prepared by perturbation along normal modes, a single unique conformation is sufficient to explain the data: |2 of 1.48 (Fig. 5, Bst, n = 1), while at least two conformations are needed to adequately model the data in the case of Eco RNA (Fig. 4). A further increase in the ensemble size has only marginal effects on the goodness-of-fit in both cases (Fig. 4). For the mesophilic Eco RNA, this observation is consistent with a comparatively higher conformational flexibility than to its thermophilic Bst homolog at room temperature. The best single conformation selected for the Bst RNA most probably represents population-weighted thermodynamic “average” of the real conformational ensemble in solution (as seen in Fig. 5: cf. n = 10 and n = 3 with n = 1 for Bst RNA) and is predicted to be representative of the envelope shape of the molecule in solution. This representative conformation is flat, only marginally different from the manual model in terms of goodness-of-fit to SAXS data (|2 1.48 vs. 2.25), as well as structurally (RMSD of 5.2 Å) indicating that the Bst RNA in solution is not particularly predisposed for substrate recognition by adopting a concave shape. In the case of Eco RNA, the minimal best ensemble of two conformations appears more concave than the Bst model (Fig. 5; Eco; n = 2), supporting the hypothesis that the Eco RNase P RNA is predisposed for substrate recognition in solution.
EOM and NMA for Atu RNA structure
Perturbation of the Atu RNase P RNA model along elastic normal modes had only a moderate effect on the fit of the selected structures to experimental data: |2 values failed to decrease below 10 even for relatively large selected ensembles (Fig. 4: |2 vs. n for Atu; NMA). This suggested that the overall mass distribution in this RNA is significantly different from the model, perhaps resulting from an undocked structural element. Since the Atu RNA model can be thought of as a three-dimensional mosaic of substructures, most of which can be predicted with high confidence (e.g., helices and bundles of highly conserved structure), we surmised that the relative orientations of one or more of these pieces might retard the optimization of the structural fit to the scattering data. Therefore, we expanded conformational sampling for the Atu RNA by performing restrained torsion-angle MD simulations (see details in Materials and Methods). A total of 52,000 conformations, with a typical RMSD below 0.4 Å between consecutive structures in any trajectory, were extracted from 104 MD trajectories generated in this process. As illustrated in Figure 4, this resulted in a pool of conformations with very broad distributions of Rg and Dmax, far beyond the reasonable range estimated from the experimental SAXS data. Then, 12,684 conformations were selected in allowed ranges of Rg (44–47 Å) and Dmax (160–180 Å) and added to the pool of the 1051 conformations perturbed along normal modes (Fig. 4; “Filtered”). Application of EOM to this combined pool of 13,735 conformations resulted in selection of small ensembles of well-folded, compact structures that fit the experimental data very well, with |2 values comparable to results with the Bst and Eco RNase P RNAs (Fig. 5; Atu).
Although no restraints were applied to maintain the integrity of long-range docking interactions in the course of MD simulations with the Atu RNA, and most MD simulations result in eventual disruption of these interactions at some point along the trajectory, typical conformations selected by EOM contain all the long-range docking interactions predicted by available phylogenetic and crystallographic information, and confirmed by SHAPE analysis. This is consistent with observations that EOM can detect long-range structuring effects in macromolecules (Bernado et al. 2007). As with the Bst and Eco RNAs, ensembles generated for the Atu RNA differ primarily by the relative orientations of the S- and C-domains, although some additional movement of the undocked peripheral helices also is expected and observed (Fig. 5). Analysis of the behavior of the goodness-of-fit parameter with the increase in the selected ensemble size (Fig. 4; Atu) shows that with the Atu RNA, no single conformation models the data better than a small ensemble of at least three conformations (Fig. 5, Atu, n = 3). Since Atu RNA is more reactive toward NMIA then Bst and Eco homologs (Supplemental Fig. 1), this observation is consistent with enhanced flexibility exhibited in solution by the Atu RNA. Similar to the Eco RNA, this best-fitting ensemble appears concave, suggesting that predisposition to substrate binding may be a common feature among the A-type bacterial RNase P RNAs.
DISCUSSION
Structural interpretations of SAXS data are strongly influenced by the occurrence of heterogeneous, misfolded species in solution (Rambo and Tainer 2010b). Most studies of RNase P RNA (and other RNAs) have used protocols that rely on denaturing gel purification, followed by renaturation. However, the folding pathways of large RNAs are rugged with alternative conformations that may be separated by high energetic barriers (Treiber and Williamson 2001; Russell 2008; Woodson 2010). Indeed, in many biophysical studies of RNA folding it is not clear whether biologically relevant conformations are achieved. Specific activity correlations are useful, but do not report on the conformational homogeneity of large RNAs. Consequently, we used hydrodynamic properties, seen with HR GF and MALS, to assess the homogeneity of samples prepared in different ways.
One innovation in this study of RNase P RNA is the determination that native purification of RNAs produced by transcription under high ionic strength resulted in samples that are hydrodynamically homogeneous and consequently produced high-quality SAXS data. In contrast, with these RNase P RNAs, renaturation or even transcription at low ionic strength, the usual practices, results in polydisperse behavior in gel filtration, reflecting heterogeneously folded RNAs. We were guided to the use of high ionic strength during transcription by the general properties of RNase P RNA, which requires high ionic strength for catalytic activation and folding. The requirement for high ionic strength during folding possibly indicates that electrostatic repulsion creates important barriers in RNA folding pathways, and ionic screening facilitates the folding pathway, presumably by screening such repulsions. Consequently, we suggest that transcription at high ionic strength may be a general method for preparation of large, homogeneously folded RNAs.
Another innovation in this work is application of elastic normal mode analysis to the structural interpretation of SAXS data. Theoretical attempts have been made to combine elastic NMA with fitting to SAXS data (Gorba and Tama 2010). In that case, subsequent perturbations of a coarse-grain model along normal modes are evaluated against the P(r) function to guide the overall fitting procedure. An advantage of this approach is that the P(r) distribution can be calculated from a set of averaged experimental curves and, therefore, achieve substantial noise reduction in data. A potential disadvantage of the approach of Gorba and Tama is that a single, static conformation is sought in the course of refinement and, therefore, information about potential flexibility of the system is not obtained. Combination of NMA with EOM overcomes this and the scattering envelopes extracted by this approach indicate that the overall flexibility of these RNAs is dictated by structural domains that flex with respect to one another, in good agreement with previous crystallographic observations (Kazantsev et al. 2005). The main advantage of combining coarse grain elastic NMA with EOM, compared with MD and EOM (Rambo and Tainer 2010a,b) is computational simplicity and speed of approach. This becomes particularly important for large macromolecules and assemblies, where a large number of internal degrees of freedom may preclude efficient conformational sampling by molecular dynamics.
One biologically relevant observation of this work is the lack of structural commonality of these RNase P RNAs in solution under the high ionic strength conditions required for activation of their catalytic properties. In the case of B-type RNA, the flat shape of the particle inferred from the SAXS data is consistent with the reconstruction from the crystal structures of unbound components. As discussed previously (Kazantsev et al. 2005; Kazantsev and Pace 2006), such a model is consistent with most, but not necessarily all biochemical data that map potential sites of contact between RNase P RNA and the substrate pre-tRNA. Specifically, while a good model of the B-type enzyme–substrate complex based on conservative interpretation of photo-affinity cross-linking data can be generated from the flat B-type RNase P model and a crystal structure of tRNA (Kazantsev et al. 2005; Christian et al. 2006), the flatness of the B-type RNase P RNA model results in unfulfilled contacts between the T-loop of the tRNA and a highly conserved substructure in the S-domain of the RNA, which is observed in the crystal structure of the A-type ternary complex. We therefore conclude that the B-type RNase P RNA in solution is not preformed to dock with the substrate and, so, must undergo a conformational change upon encountering the substrate. A similar global rearrangement is expected for the B-type holoenzyme even independently of the protein, since the bacterial RNase P protein component binds RNase P RNA away from the interface between the S- and C-domains (Buck et al. 2005b; Reiter et al. 2010). Considering the flexibility between C- and S-domains suggested by the EOM reconstructions based on the SAXS data, conformational change upon substrate-binding probably would occur readily, stabilized by the free energy of substrate binding.
The SAXS-derived data with the Eco and Atu RNAs show that the crystal structure for the unbound A-type RNase P RNA, that of T. maritima, is seriously distorted by both inter- and intramolecular interactions; the poorly packed dimer of the crystal form is seen as a well-folded, compact monomer in solution, consistent with the conformation adopted by the A-type RNA in the ternary complex. Both of these A-type RNase P RNAs are more concave than the B-type RNA, and therefore are predisposed to substrate recognition. This more concave shape of the A-type RNA, stabilized by long-range docking interactions that are lacking in the B-type RNA, brings together potential binding partners in the T-loop of the tRNA and the S-domain of the RNase P RNA, and thus better satisfies available biochemical information that bears on the contacts between P RNA and the substrate.
MATERIALS AND METHODS
RNA preparation
DNA constructs for the expression of RNA were generated by PCR from plasmids pBstHH2 (Kazantsev et al. 2005), pDW98 (Haas et al. 1996), or genomic DNA of A. tumefaciens strain DSM 30150 (Brown et al. 1991), cloned under T7 RNA polymerase promoter into EcoRI/KpnI digest of pRAV-23 vector (Batey and Kieft 2007) and verified by sequencing. PCR of the templates for in vitro transcription was performed as described (Batey and Kieft 2007). In vitro transcriptions were performed on a scale of from 0.5 to 2 mL in the buffer containing 40 mM Na-HEPES (pH 8.0), 25 mM MgCl2, 10 mM dithiothreitol, 0.05% NP-40, 4 mM each nucleotidetriphosphate, 1 U/mL yeast inorganic pyrophosphatase, 0.05 mg/mL T7 RNA polymerase, and 10% of the template PCR mix. For the HS native method, potassium acetate was added to the transcription buffer at 200 mM. For denaturing and HS native methods transcriptions were supplemented with 1 mM glucosamine-6-phosphate to promote cotranscriptional cleavage of the glmS ribozyme from the 3′-termini of nascent transcripts. Transcription reactions were incubated at 37°C for 4 h (denaturing and native methods) or overnight (HS native method).
Denaturing purification of RNA was performed in polyacylamide gels supplemented with 50% urea, followed by passive elution, nondenaturing ion exchange chromatography as described (Kazantsev et al. 2005), rapid dialysis into 0.1 mM EDTA and concentration to 3–10 mg/mL with microcentrifuge concentrators (MWCO 50 kDa). RNA samples prepared by this method were stored at −20°C and refolded by annealing in the presence of 25 mM MgCl2 and 200−300 mM KOAc as described in the text immediately prior to the high-resolution gel-filtration step.
Nondenaturing (native) purification of transcripts was performed as described by Batey and Kieft (2007), by affinity chromatography on Ni-NTA resin (Qiagen) with the use of recombinant HMM protein. RNase P RNA was eluted from the resin by the buffer containing 50 mM Na-HEPES (pH 7.5), 150 mM NaCl, 10 mM MgCl2, 0.1 mM EDTA, and 1 mM glucosamine-N-phosphate, concentrated to 2–3 mg/mL and stored at +4°C for a period of a few hours (typically, overnight) prior to the high-resolution gel-filtration step.
HS native purification was performed by gel filtration on Superdex 200. In a typical run, 0.45 mL of an overnight transcription in the presence of 200 mM KOAc was applied to a Superdex 200 HR 10/30 column (GE Healthcare) equilibrated with the buffer containing 20 mM Na-MES (pH 6.5), 20 mM Mg(OAc)2 and 300 mM KOAc. The column was eluted at 0.5 mL/min. Eluting RNA was detected by absorbance at 280 nm, peak fractions collected and stored at +4°C for a period of a few hours (typically, overnight) prior to the high-resolution gel-filtration step.
High-resolution gel filtration was performed on Shodex KW 803 (Showa Denko, LLC) column eluted at 1 mL/min with a buffer containing 20 mM MES (pH 6.5), 20 mM Mg(OAc)2 and 600 mM KOAc. For analytical runs, 25 μL of RNA at 0.2–0.4 mg/mL were applied and chromatographic profiles were monitored by absorbance at 254 and 280 nm and analyzed by a combination of refractometry and multiangle light scattering as previously described (Rambo and Tainer 2010b). For preparative runs immediately prior to SAXS data collection or SHAPE experiments, RNA samples were concentrated to 2–5 mg/mL with microcentrifuge concentrators (MWCO 50 kDa) and 40–50 microliters were loaded.
Selective 2′ hydroxyl acylation analyzed by primer extension
To alleviate sequence assignment close to the RNA termini and to provide a binding site for an external sequencing primer, transcription constructs for SHAPE analysis were extended by 14 nt at the 5′-end and by 43 nucleotides at the 3′-end (Wilkinson et al. 2006) by PCR with appropriate primers. Folded RNase P RNAs were prepared by run-off transcription according to HS native method immediately followed by HR gel filtration on Shodex KW 803 as described above. Peak RNA fractions from the high-resolution gel filtration (typically, at 0.7–1.5 μM concentration in 20 mM Na-MES at pH 6.5, 20 mM Mg(OAc)2, 600 mM KOAc) were diluted to 0.11 μM concentration with SHAPE reaction buffer (60 mM Na-HEPES at pH 8.0, 20 mM Mg(OAc)2 and 600 mM KOAc). Then, 18-μL aliquots of RNA were treated with 2 μL of 15 mM NMIA in DMSO for 3 h at 23°C; control reactions were performed with 2 μL of neat DMSO and treated RNA samples were precipitated with ethanol. Primer extension and sequencing reactions were performed as described with 32P-labeled primers, including external primer as recommended by Wilkinson et al. (2006) and with internal primers complementary to the region encompassing J11/12 and 5′-half of P12 of each individual RNA. Products of primer extension reactions were separated by electrophoresis in denaturing, 6% polyacrylamide gels and processed as described (Wilkinson et al. 2006; Mortimer and Weeks 2009) to calculate normalized reactivities that are plotted in Supplemental Figure S1.
Generation of all-atom RNA models
All-atom RNA models were generated in silico following the strategy outlined below. Ideal helices and point mutations were generated with COOT (Emsley and Cowtan 2004). Where appropriate, small structural motifs were identified in deposited RNA structures with the aid of SCOR database (Klosterman et al. 2002; Tamura et al. 2004) and added to the intermediate models by interactive local least-squares-based superimposition of the overlapping atoms with PyMOL (Schrödinger, LLC). Larger elements of the modeled structures were oriented with respect to each other with O (Jones et al. 1991). Incomplete intermediate models we subjected to local geometry regularization with COOT or O at different stages of model building.
The incomplete flat model of the Bst RNA variant described previously (Kazantsev et al. 2009) was generated by superimposing the structure of the S-domain from the B. subtilis homolog (Krasilnikov et al. 2003), modified to conform to the sequence and the secondary structure of the Bst RNA. To complete the model, top of P9 was constructed from an A-form helix capped with UUCG tetraloop, placed on top of tandem G-U pairs forming a cross-strand G stack (Moore 1999). The terminal loops L15 and L19 and an internal loop in helix P19, both disordered in the crystal structure, were modeled with a combination of de novo prediction and homology modeling methods using the program RNA-123 (DNA Software, Inc.) as described (Sijenyi et al. 2010).
Because a significant portion of the A-type RNA crystal structure (Fig. 1A) is so dramatically misfolded and because the lengths of helices involved in long-range docking interactions differ between the T. maritima and the Eco and Atu variants, these A-type RNAs were modeled from smaller, predictable pieces of structure, identified—where appropriate—by homology with the aid of the SCOR database. In this process, the independently folding domains of Eco and Atu RNAs were modeled separately to conform to the sequence and structural constraints imposed by the phylogenetically refined secondary structures of these RNAs (Fig. 1C) and then manually docked with each other, guided in general by overall appearance of the T. maritima crystal structure. Individual helices involved in long-range docking interactions were then repositioned with respect to each other in order to satisfy the docking constraints observed in crystal structures. Helices P6, P16, (P16.1 in Atu), and P17 were modeled as ideal helices and placed manually to satisfy junction points with each other and with the loop L15, that was positioned in the same region as its homolog in the Bst model. Conformation of the loop L15 in the A-type RNAs was influenced by the de novo prediction for the B. stearothermophilus, although some remodeling had to be done in order to conform to the structural constraints imposed by docking of the helices P6, P16, and P17. Taking into account SHAPE data, helix P6 in Atu was modeled as six canonical base pairs, NMIA-reactive base pair U75 * G276 was broken. When connecting helical elements with the short stretches of unpaired nucleotides, care was taken to maximize stacking interactions.
Complete all-atom models of all three RNAs were subjected to local energy minimization with CNS (Brunger et al. 1998) by utilizing idealized geometry restraints for the Watson-Crick base pairs; sugar puckers were restrained as either 3′-endo or 2′-endo for the regions of structure that were predicted with high confidence based upon available crystallographic and phylogenetic information (e.g., A-form helices, catalytic core and highly conserved features of the S-domain). For minimizations of the A-type RNA models additional pseudo-NOE restraints were applied between selected atoms involved in long-range docking interactions as observed in available crystal structures.
The modeling and optimization procedure used here resulted in compact RNA models with all known base-pairing and docking interactions accounted for and with the highly conserved core regions folded according to the available crystallographic information. The quality of the final models was assessed by Clashscore values calculated with MolProbity server (Chen et al. 2010): 31.4 for Bst, 33.6 for Eco, and 32.7 for the Atu model; according to these values these models are comparable in quality to the crystal structures of RNA determined at ∼3 Å resolution.
Conformational sampling by NMA and MD
Model perturbations along the five lowest elastic normal modes (including all possible bimodal perturbations) were calculated with the aid of the elNemo server (Suhre and Sanejouand 2004). Perturbation trajectories were calculated with the following parameters: DQMIN: −600, DQMAX: 600, DQSTEP: 120. Individual nonredundant conformations were extracted from each trajectory and subjected to restrained local energy minimization with CNS as described above to correct for violations in the geometry of chemical bonds that are introduced by perturbations at high amplitudes.
Torsion MD simulations were performed with CNS. In these simulations, canonical A-form helices were restrained as rigid bodies, while no restraints were applied to the substructures that were expected to be flexible on the basis of the SHAPE experiments or the substructures that we could not structurally define with high confidence. To broaden the sampling, the 50 endpoints of mono- and bimodal perturbations along normal modes, as well as the unperturbed input model, were chosen as the starting points for the MD simulations. Each simulation at a constant temperature of 298 K consisted of 50,000 of 0.02-psec time steps (1 nsec overall) and was calculated twice, either with no electrostatic terms, or with electrostatic terms included (∑ = 10) in order to accelerate dissociation of the long-range docking interactions in the course of simulation. Atomic coordinates were sampled every 2 psec and recorded in a simulation trajectory. Simulation trajectories were converted to PDB format with VMD (Humphrey et al. 1996).
Computational workflow was alleviated by application of in-house Python and UNIX shell scripts designed to generate and execute individual CNS scripts on a large scale (hundreds of minimization and MD simulations, typically split into eight batches of consecutive jobs and executed in parallel on a 8-processor Mac Server), to split perturbation trajectories into individual PDB files and to select perturbed structures within desired ranges of Rg and Dmax values as described in the text.
SAXS data collection and processing
SAXS data were collected at beam line 12.3.1 at the Advanced Light Source, Lawrence Berkeley National Lab. Peak fractions from the high-resolution gel-filtration chromatography, at 4–10 μM concentration, were subjected to a series of consecutive dilutions with chromatographic buffer (typically, 4:5); 20-μM aliquots were loaded into a 96-well plate and scattering data collected by an automated procedure as described (Hura et al. 2009). One-second, 6-sec, and another 1-sec expositions were collected for each concentration and the data from first and last 1-sec expositions were compared to visually assess for potential radiation damage. One-second and 6-sec expositions for each concentration were merged with PRIMUS (Konarev et al. 2003). P(r) distributions were calculated from the scattering data from the highest concentration in a dilution series with GNOM by applying perceptual criteria for an estimate of Dmax (Svergun 1992). All scattering curves, Kratky plots, and P(r) distributions were plotted with KaleidaGraph. Ab initio modeling of the scattering envelopes was performed with DAMMIF (Franke and Svergun 2009) with P(r) distributions calculated with maximal reasonable value of Dmax (Supplemental Table S1). Ten individual reconstructions were calculated for each RNA, superimposed, averaged, and filtered with DAMSEL, DAMSUP, DAMAVER, and DAMFILT utilities as described elsewhere (Kozin and Svergun 2001; Volkov and Svergun 2003). Theoretical scattering profiles from all-atom models were calculated with CRYSOL (Svergun et al. 1995) by assigning an electron density for solvent to 0.334 e/Å3 and a thickness of the solvent shell to 3 Å. Goodness of fit between theoretical and experimental curves was assessed by calculating a value of |2 as described elsewhere (Svergun et al. 1995; Stoddard et al. 2010).
Optimized ensembles were selected with EOM (Bernado et al. 2007) from pools of perturbed conformations as described in the text; for selections with ensemble size of two and more, redundant conformations were allowed to be selected. Selected conformations were analyzed by maximum-likelihood superimposition with THESEUS (Theobald and Wuttke 2006).
SUPPLEMENTAL MATERIAL
Supplemental material is available for this article.
Footnotes
-
Reprint requests to: Norman R. Pace, Department of MCD Biology, Campus box 347, University of Colorado, Boulder, CO 80309, USA; e-mail: nrpace{at}colorado.edu; fax: (303) 492-7744.
-
Article published online ahead of print. Article and publication date are at http://www.rnajournal.org/cgi/doi/10.1261/rna.2563511.
- Received November 23, 2010.
- Accepted March 30, 2011.
- Copyright © 2011 RNA Society




