


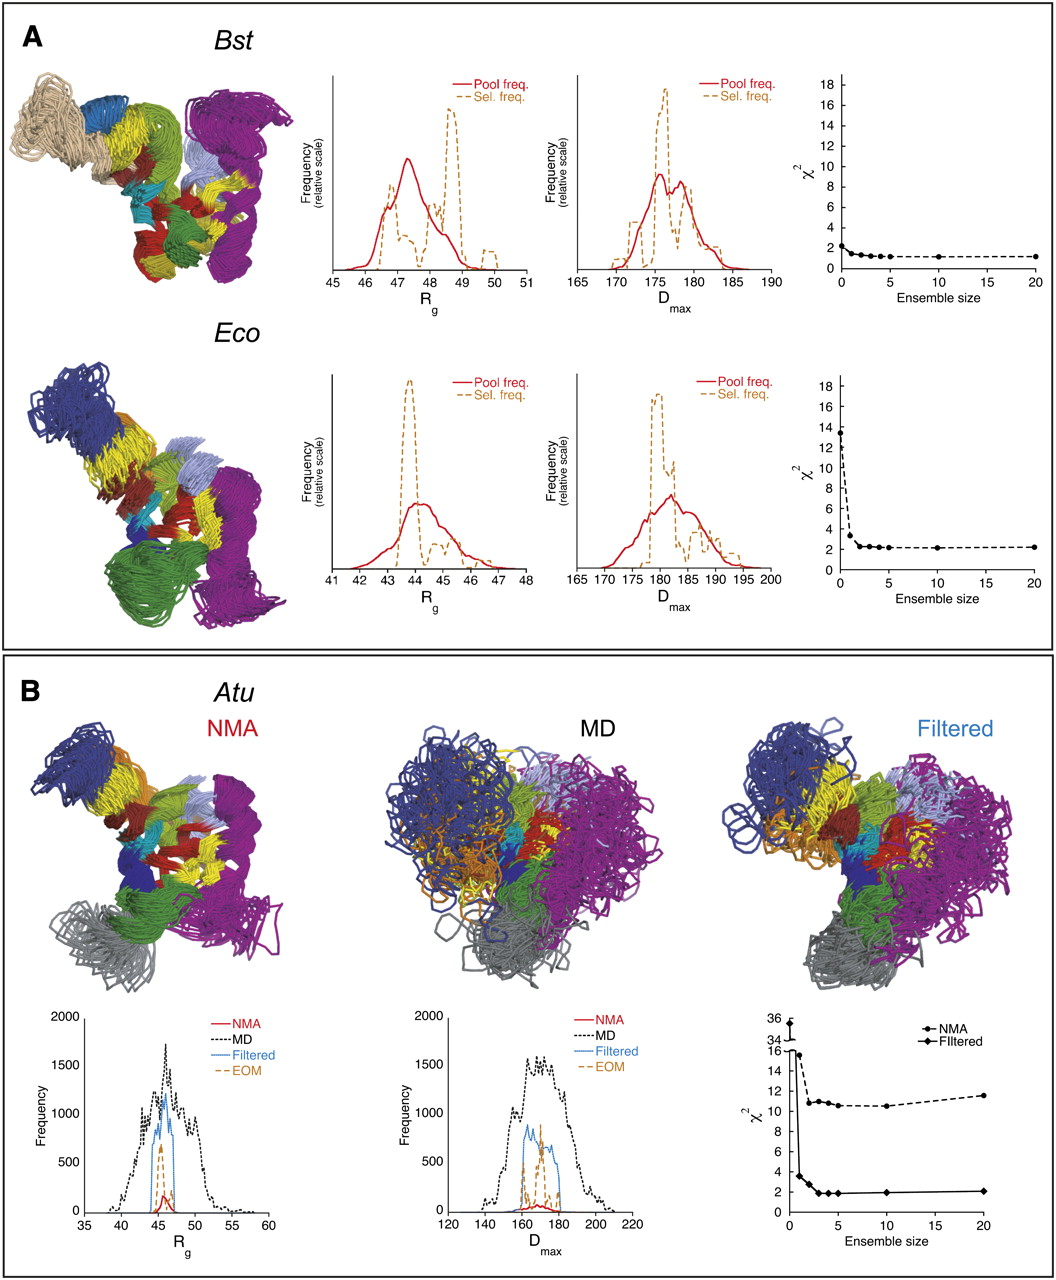
Conformational pools for ensemble optimization. (A) All-atom models of Bst and Eco RNase P RNA perturbed along five lowest elastic normal modes. Ribbon diagrams of the 50 endpoints of perturbation trajectories are shown on the left, colored according to Figure 1. Rg and Dmax frequency distributions plotted on a relative scale illustrate spread of these values in the pools of the 1051 conformations used for ensemble optimization (“Pool freq.”). Rg and Dmax distributions in a typical optimized ensemble of 10 conformations that fit the experimental data best (Fig. 5) are also shown (“Sel. Freq.”). (Far right) Dependence of the goodness-of-fit parameter χ2 on the size of optimized ensemble n (n = 0 corresponds to the unperturbed models shown in Fig. 3). (B) Conformational pools for ensemble optimization of Atu RNA. (Top) Ribbon diagrams of the 50 endpoints of perturbations along elastic normal modes (“NMA”) are compared with the endpoints of 104 torsion molecular dynamics trajectories (“MD”) and to 65 conformations selected at random from a pool of 12,684 conformations obtained by filtering the MD pool to exclude conformations with unrealistic Rg and Dmax (“Filtered”). (Bottom) Rg and Dmax frequency distributions plotted on absolute scale illustrate spread of these values in the conformational pools prepared by NMA perturbations (“NMA”, 1051 conformations), torsion MD simulations (“MD”, 52,000 conformations), or filtered pool combined with the NMA-perturbed pool (13,735 conformations). Rg and Dmax distributions in a typical optimized ensemble of 10 conformations that fit experimental data best (Fig. 5) are also shown on relative scale (“EOM”). (Far right) Dependence of the goodness-of-fit parameter χ2 on the size of optimized ensemble n for selections from a pool of 1051 NMA-perturbed conformations (“NMA”) compared with the selections from a pool of 13,735 filtered MD conformations (“Filtered”); n = 0 corresponds to the unperturbed model shown in Figure 3.




