


Ribosomal dynamics inferred from variations in experimental measurements
Abstract
The crystal structures of the ribosome reveal remarkable complexity and provide a starting set of snapshots with which to understand the dynamics of translation. To augment the static crystallographic models with dynamic information present in crosslink, footprint, and cleavage data, we examined 2691 proximity measurements and focused on the subset that was apparently incompatible with >40 published crystal structures. The measurements from this subset generally involve regions of the structure that are functionally conserved and structurally flexible. Local movements in the crystallographic states of the ribosome that would satisfy biochemical proximity measurements show coherent patterns suggesting alternative conformations of the ribosome. Three different types of data obtained for the two subunits display similar “mismatching” patterns, suggesting that the signals are robust and real. In particular, there is an indication of coherent motion in the decoding region within the 30S subunit and central protuberance and surrounding areas of the 50S subunit. Directions of rearrangements fluctuate around the proposed path of tRNA translocation and the plane parallel to the interface of the two subunits. Our results demonstrate that systematic combination and analysis of noisy, apparently incompatible data sources can provide biologically useful signals about structural dynamics.
Keywords
INTRODUCTION
The ribosome is a molecular machine that synthesizes proteins according to genetic message. The structure of the ribosome has been carefully studied for many years by using various biochemical techniques, and we have accumulated much of the data in the Riboweb resource (Chen et al. 1997; Bada and Altman 2000; Whirl-Carrillo et al. 2002). The success of crystallography of the ribosome in the past few years has been dramatic, as ribosomal structures have emerged with unprecedented detail and completeness (Ban et al. 2000; Schluenzen et al. 2000; Wimberly et al. 2000; Harms et al. 2001; Yusupov et al. 2001). With the publication of the X-ray structures of the prokaryotic and archaeal ribosome, there is an opportunity to look at noncrystallographic structural measurements to assess the agreement between different types of data. The hypothesis behind this work is that data that are incompatible with published crystal structures may provide coherent patterns that suggest alternative conformations complementary or additional to those observed by crystallography (Yusupov et al. 2001; Brodersen et al. 2002; Ramakrishnan 2002; Yonath 2002 and references therein), and other experimental methods (see Lodmell and Dahlberg 1997; Frank and Agrawal 2000). It has been suggested that biochemical proximity measurements, such as crosslink, footprint, and cleavage experiments, may contain clues to ribosomal structural fluctuations and dynamics ribosome (see Sommer and Brimacombe 2001). However, there has been no systematic and integrative analysis of biochemical experimental results in the context of the recent high-resolution structures.
In previous work, we have described the RiboWeb database of structured representations for biochemical experiments. We have used RiboWeb to study the structure of the ribosome and the consistency of the reported experimental results (Chen et al. 1997; Bada and Altman 2000; Whirl-Carrillo et al. 2002). RiboWeb has ~11,000 individual observations about ribosomal structure, mostly derived from Escherichia coli ribosomes. The knowledge base is available for download along with software for reading it (Protégé) at http://protege.stanford.edu/. In this study, we report the results of comparing crosslink, footprint, and cleavage measurements to distances extracted from crystal structures of ribosomes for three species, homology model, and cryoelectron microscopy–based fittings of E. coli ribosomal subunits (see Materials and Methods). We focus on the biological implications of these comparisons rather than the accuracy and precision of different types of experiments and interpretations, which have been addressed elsewhere (Sergiev et al. 2001; Whirl-Carrillo et al. 2002).
We analyzed 2691 distances between ribosomal components as 5382 (2691 pairs of oppositely pointing) vectors attributed to individual components. We classified the data as “matching” or “mismatching” based on comparisons with ~40 sets of atomic coordinates available for ribosomes in different organisms and conformations. We found that labeling ribosomal substructures based on their abundance of missing, matching, and mismatching data correlated with their levels of evolutionary, structural, and functional conservation. Many of our results are consistent with findings from cryoelectron microscopy, mutagenesis, and other studies that suggest possible structural rearrangements in the ribosome (Lodmell and Dahlberg 1997; Agrawal et al. 1999; Gabashvili et al. 1999; Matassova et al. 2001; Ogle et al. 2002 and references therein). However, to more systematically demonstrate the evidence for conformational motions in the biochemical data, we analyzed all experimental proximity vectors, with the expectation of finding coherent patterns that would point to localized or large-scale dynamic motions. Our results suggest conformational changes in the decoding region of the 30S subunit head and the corresponding contact regions of the 50S subunit in the direction roughly defined by the tRNA translocation path through the ribosome. This conformational motion may be necessary for initial binding and proofreading of incoming tRNA and its translocation within the ribosome. Coherent patterns suggest the possibility of sequential motions, and the “pulsing” of the 30S subunit observed in this work is consistent with a ratchet-like dynamics of the ribosome (Frank and Agrawal 2000). We also note motion of the central protuberance of the 50S subunit and “hugging” movements of L7/L12 and L1 proteins (wrapping around the 30S subunit).
A number of studies comparing crystallographic data with biochemical, gene expression, and proteomic measurements have been currently reported (Sergiev et al. 2001; Edwards et al. 2002; Jansen et al. 2002; Whirl-Carrillo et al. 2002; P. Wollenzien, pers. comm.). The rate of “errors” found in these works on average varied from 25%–50%. We believe that our analysis is the first to demonstrate that ribosomal distance measures that appear wrong (with reference to crystallography) actually contain low-resolution information about possible alternative conformations and dynamics.
RESULTS
Distribution of mismatches
Figure 1 summarizes the results of comparisons between biochemical proximity measurements and distances obtained from crystal structures for ribosomal RNAs (5S, 16S, and 23S) and proteins of the two subunits. We found that 606 distances, that is, 23% of the total (2691) distances examined, did not match any of the available sets of coordinates. The ratio of mismatches to all available measurements varied from ~10% (for footprinting and “slight” crosslinking mismatches for RNA and proteins) to ~30% (for all crosslinking mismatches) and up to 100% for the 5S rRNA cleavage data.
The results can be further mapped onto the 5S, 16S, and 23S RNAs of E. coli and considered for individual ribosomal proteins (Fig. 2A,D). Regions with consistent matching biochemical and crystallographic proximities account for about one fourth of the 16S RNA structure and almost half of the 23S RNA. Figure 2, B and E, illustrates three-dimensional distribution of these regions. The regions are mapped in the three-dimensional crystal structures (1GIX and 1GIY; Yusupov et al. 2001). The gray (no-information) regions are clustered in the most protruding parts of the 30S subunit and the solvent-exposed helices of the 50S subunit, surrounding the exit of the nascent polypeptide from the ribosome. The 30S subunit mismatch regions are basically on the interface and head/neck areas, drawing around the tRNA translocation route through the ribosome. The mismatch regions of the 50S subunit are distributed around its periphery, primarily associated with its proteins. None of the matching RNA regions participate in ligand interactions in the 30S subunit, but many of these helices in the 50S subunit have tRNA and factor-binding or intersubunit–bridging roles (Fig. 2). We note, however, that even in the 50S subunit case, all tRNA and translation factor-binding regions are directly linked with the mismatching regions. In summary, the correspondence between the mismatching (Fig. 2A,B) and potentially flexible (Fig. 2C) regions is striking for the 30S ribosomal subunit. It is present, but less spectacular for the 50S subunit, in which mismatching areas may surround rather than totally coincide with the ligand-binding and potentially flexible sites (Fig. 2D–F).
The proteins bearing the largest mismatches were L18, L5, and L25. These proteins are the only ones associated with the 5S RNA, a molecule with biochemical data that were generally incompatible with crystallographic measurements (Fig. 1). In particular, 75% of the total paired biochemical/crystallographic observations for these three proteins were inconsistent (Fig. 1). One explanation for this fact would be an experimental artifact due to misincorporation of this part in the reconstituted ribosomes. Specific conformational changes can also not be ruled out. An analysis of this and other patterns in different types of data is presented below.
Local movements
We represented all false-positive proximity data points (biochemical experiments predicting shorter distances than observed in crystals) as vectors describing local movements that would tend to “satisfy” the biochemical measures (see Materials and Methods). Each mismatch between atoms i and j is described by two vectors: one pulling i toward j and another pulling j toward i, with the magnitude dependent on specific experiments (Materials and Methods). A reasonable approach for examining all possible movements within the ribosome would involve separate consideration of vectors within conformationally independent domains. Uneven distribution of the data, with some areas characterized by very few experiments, makes a general analysis of this kind impossible. Some potential movements, however, are suggested by clusters, formed by the aggregated data (see Materials and Methods), as shown in Figure 3, A–C. They are in neighboring regions of the ribosome, surrounding the decoding region of the 30S subunit and central protuberance of the 50S subunit (containing the 5S rRNA), spread from L9–L7/L12 proteins. Two average vectors represent intersubunit motions (transparent black arrows in Fig. 3B,C) that can be best described as hugging of the 30S subunit by the 50S subunit, by its peripheral L7/L12 and L1 proteins. Most movements in the 30S subunit (as represented by these mismatch vectors) have corresponding counterparts in the 50S subunit, suggesting that many of the motions observed are coordinated between the two subunits.
Large-scale movements
Analysis of clusters of vectors detects only some of the local movements in the ribosome, relative to conformations in crystal structures. Analysis of global directions of all vectors provides additional (albeit low-resolution) information. Patterns of coherently directed vectors may suggest translational or rotational large-scale movements in the structure. We scanned the angular space occupied by our mismatch vectors and sought subsets of coherent vectors (±15°) for all type of experiments. Some directions displayed noisy, apparently incoherent distribution, whereas others revealed signals on the possibility of large-scale movements. Figure 3, D–F, illustrates such signals in the two subunits. A principal component analysis of the mismatch vectors suggests a dominant direction present in all types of data, including intersubunit measurements. The vectors are remarkably well aligned for the 50S subunit and fluctuate around the same direction in the 30S subunit. The significance of such alignment is estimated by us as P < 0.0078 (see Materials and Methods), compared with the chance of these vectors aligning at random.
To identify other broadly consistent sets of mismatch vectors, we computed an “average” error vector by summing all error vectors for all types of experiments and dividing the resulting vector by the total number of vectors (Materials and Methods). The average vector is 11 Å in length and lies in the plane perpendicular to the interface, forming an angle of ~20° to the tRNA translocation path.
DISCUSSION
Flexibility and motion underlie biological function. It is likely that all the ribosomal components are inherently flexible (see Gao et al. 2003). Even a fully assembled ribosome has many degrees of conformational freedom remaining. Modes of ribosomal flexibility can be studied by experimental and theoretical methods, including cryoelectron microscopy, comparative X-ray crystallography, biochemical and genetic approaches, single molecule biophysics, and molecular modeling (for examples, see Frank and Agrawal 2000; Polacek et al. 2000; Stark et al. 2000; Bayfield et al. 2001; Harms et al. 2001; Noller and Baucom 2001, Ogle et al. 2002; Ramakrishnan 2002; Sanbonmatsu and Joseph 2003; Stagg et al. 2003; Valle et al. 2003 and references therein). These studies have shown that existence of different conformers or structural heterogeneity is usually associated with functional centers and with regions that bind tRNA and translation factors. In particular, the head and neck regions of the 30S subunit, the peptidyl-transferase center, the L1 and L7/L12 proteins of the 50S subunit, and some intersubunit bridges show significant flexibility. Structural variability has been also detected for regions with no functional information, such as the spur, which is helix 6 of 16S RNA (Frank and Agrawal 2000; Yusupov et al. 2001).
Our results show that ribosomal components yielding the highest number of mismatches in our comparisons all have important functional roles in interactions with tRNA, mRNA, and protein factors of translation. Indeed, the error rates act almost as an indication of functional importance. The best-matched regions between crystallographic and solution measurements apparently serve to stabilize the structure.
Analysis of mismatched directional vectors within the ribosome demonstrates that there are coherent sets of inconsistencies between crystallography and three types of biochemical experiments. Conformational rearrangements can be described as a pulsing movement within the 30S subunit decoding region and similar motion around the central protuberance of the 50S subunit. These regions are directly contacting by B1 bridges (Gabashvili et al. 2000; Yusupov et al. 2001) prone to partial destabilization (Gabashvili et al. 1999; Frank and Agrawal 2000; Gao et al. 2003). Pulsing would be taking place around the B2a bridge, which does not necessarily need to be disconnected during the motion.
The 30S subunit has been previously proposed to undergo large conformational rearrangements and pulse (Laughrea 1994) or “ratchet” (Frank and Agrawal 2000) during translocation. The pivoting or nodding of the head in different directions has been observed by both cryoelectron microscopy and comparison of crystallographic structures (Agrawal et al. 1999; Gabashvili et al. 1999; Frank and Agrawal 2000; Noller and Baucom 2001; Ogle et al. 2002). The head of the 30S subunit seemed to rotate or bent by 90° in the late stages of assembly or initiation complex formation, as studied by Monte Carlo simulation (Stagg et al. 2003), but there has been scant experimental support for these motions. Movements involving both 30S and 50S ribosomal subunits may facilitate initial binding of incoming tRNAs and their translocation, thus representing important conformations of the ribosome.
MATERIALS AND METHODS
Data sets
Comparisons between biochemical data and atomic coordinates have been described in detail (Whirl-Carrillo et al. 2002). This work expanded the same data set slightly, as crystallographic information on more ribosomal components was available. The Protein Data Bank (PDB; http://www.rcsb.org) accession numbers of coordinate files used in this work are as follows: 1QD7, 1C04, 486D, 1FFK, 1FFZ, 1FG0, 1FJF, 1FJG, 1FKA, 1HNW, 1HNX, 1HNZ, 1HR0, 1I94, 1I95, 1I96, 1I97, 1IBK, 1IBL, 1IBM, 1GIX, 1GIY, 1JG0, 1JGP, 1JGQ, 1JJ2, 1JZX, 1JZY, 1JZZ, 1K00, 1K01, 1KC9, 1J5E, 1LNR, 1M5G, 1C2W, 1C2X, 1EG0, 1JQM, 1JQS, 1JQT, 1N32, 1N33, 1N34, and 1N36. We used RiboWeb and other in-house automatic programs to calculate all corresponding distances and compare them (Chen et al. 1997; Bada and Altman 2000; Raychaudhuri 2000; Whirl-Carrillo et al. 2002).
Vectors
Vectors were constructed to represent mismatch results of biochemical experiments, that is, those predicting shorter distances between ribosomal components than those observed in crystals. Each vector is starting from one region in the ribosome and pointing toward the region that was crosslinked to it or related to it by footprint or cleavage experiments. Thus, they represent the shortest direct linear path between two ribosomal segments that would need to be further shortened in order to satisfy the proximity measures. Each experimental distance was described by two vectors, having the same length but opposite directions and different starting points. In many experiments, the precise atoms (e.g., those forming a crosslink) in nucleotides or amino acids were not known. We calculated the closest distances between α-carbon atoms in proteins and 5′ phosphorus atoms in RNA. We adjusted the expected distances to account for the uncertainty of distance measurements, as previously described (Bada and Altman 2000; Whirl-Carrillo et al. 2002). Adjustments included the length of the agent (or the range of its action), possible variability of the length, and the difference in distance between actually linked atoms and atoms of RNA and protein backbones used for calculation of distances (see Whirl-Carrillo et al. 2002). The resulting “error vectors” were all those with greater than zero length defining a mismatch.
Statistics
We compared 2691 observations of crosslinking, footprinting, and cleavage experiments reported in 88 articles, with distances derived from >40 X-ray structures and cryo-electron microscopy fittings (see Whirl-Carrillo et al. 2002 and the previous paragraph). We selected only crosslinking, footprint, and cleavage data that had information in crystal structures. We eliminated data recognized to be artifacts by investigators themselves in their later publications. We manually sorted the data and classified them as (1) “matches,” if they exactly matched at least one crystal structure (within the resolution of the experiment and all uncertainties considered); (2) “slight mismatches,” if they were different from all crystal structures but could be explained by changes in conformation of up to 15 Å between ribosomes in crystals and solution; and (3) “gross-mismatches,” if the minimal difference found from comparisons with available crystals was >15 Å. We applied more generous cutoffs to footprinting and cleavage data, allowing them to be up to 30 Å different from the distances between corresponding backbone atoms in crystal structures (as discussed in Whirl-Carrillo et al. 2002). By using two crystal structures that report the articulated 30S and the 50S subunits (1GIX and 1GIY; Yusupov et al. 2001), we measured 599 distances (1198 vectors) corresponding to the experimental measurements reported (crosslinking, protection, and radical cleavage). We initially analyzed each experiment type separately, but we concluded that a summary combined analysis was appropriate because the individual analyses were concordant and because the statistics improve with larger numbers of vectors. We have previously analyzed sources of error separately (Whirl-Carrillo et al. 2002).
Analysis
Distances were calculated from cartesian coordinates of crystal structures. Vectors were drawn between all points constrained by biochemical experiments that were also identified in crystal structures (closest α-carbon or phosphorus atoms). Angles between two directions were calculated from dot products of two vectors divided by their lengths. For consistency, we used the same set of 30S subunit, 50S subunit, and tRNA coordinates in all angle calculations and visualizations (PDB identification 1GIX, 1GIY; Yusupov et al. 2001).
K-means clustering and principal component analysis were performed with in-house programs (Raychaudhuri et al. 2000) and custom Perl scripts, using k ranging from 5 to 100. The features vectors used for clustering were composed of cartesian coordinates and spherical coordinates with Euclidian distance metrics. Clustering was done in semi-automatic fashion (manually adjusted for belonging to structurally meaningful domains). All vectors in the cluster were summed and averaged. To define a cluster, we looked for a minimum of eight vectors that were not more than a maximum distance of 20 Å from the cluster center. These clusters thus represent portions of the molecule that, as a fragment, have a consistent tendency for mismatch between the crystal and the biochemical experimental results.
To determine the significance of coherent principal axes that we computed from the 30S and 50S subunit, we generated random sets of 2 million vectors between arbitrary points within and between the subunits. We then estimated the likelihood that N independent vectors drawn from this distribution would point in the same direction (to within 45°), as they did in our results. We computed that the vector directions are significant with P < 0.0078, based on this empirical estimate of likelihood.
All molecular graphics images were produced by using the Chimera package from the Computer Graphics Laboratory, University of California, San Francisco (Huang et al. 1996).
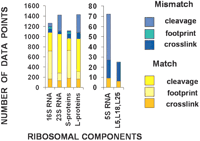
Results of comparisons between distances predicted by biochemical experiments and crystal coordinates of rRNA and proteins in the ribosome. The Y-axis shows the number of matching (shades of yellow) and mismatching (shades of blue) data points for different types of experiments.
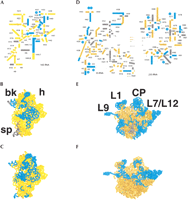
Distribution of regions for which no crosslinking, footprinting, or cleavage information was available (dim gray in A, B, D and E) and ≥25% of the data available was in disagreement with crystal structures (blue in A, B, D and E). (A) Ratios of mismatches mapped into secondary structure of ribosomal 16S RNA. Proteins bearing >25% mismatches in crystallography vs. biochemistry comparisons (see the text) are shown as blue circles placed approximately near binding sites in RNA. (B) Interface of the 30S subunit. The same color scheme as in A, but rendered in three dimensions. (C) Ligand-binding regions (Pioletti et al. 2001; Yusupov et al. 2001; Klaholz et al. 2003; Rawat et al. 2003) and regions found to be flexible in comparative structural studies (see Matadeen et al. 1999; Yusupov et al. 2001; Ogle et al. 2002; Klaholz et al. 2003; Rawat et al. 2003) mapped into crystal structures of the 30S subunit (PDB identification: 1GIX; Yusupov et al. 2001). (D) Secondary structure diagram of the 23S RNA, 5S RNA, and associated proteins, colored in dark gold if data available for the region generally were in good agreement (<25% of mismatch); blue, >25% of mismatches; and gray, no data in our data set. (E) Interface of the 50S subunit. The same color scheme as in D, but rendered in three dimensions. (F) Ligand-binding regions and regions found to be flexible in comparative structural studies (Matadeen et al. 1999; Yusupov et al. 2001; Klaholz et al. 2003; Rawat et al. 2003) mapped into crystal structures of the 50S subunit (PDB identification: 1GIY; Yusupov et al. 2001). Landmarks show macroscopic features of the 30S and 50S subunits known from electron microscopy: h indicates head; bk, beak; sp, spur; and CP, central protuberance (where the 5S RNA is located); as well as proteins L1, L9, and L7/L12 dimer.
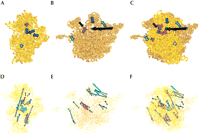
Vectors representing major clusters suggesting local movements (A–C) and exemplar subsets of coherent violation vectors suggesting more global motions (D–F) are shown for the 30S subunit (A, D), 50S subunit (B, E), and 70S ribosome (C, F). Color code for ribosomal subunits and intersubunit measurements is as follows: gold indicates 30S subunit; goldenrod, 50S subunit; blue, intrasubunit crosslinks; purple, footprints; turquoise, cleavage; and transparent black, intersubunit crosslinks. When shown on the 70S ribosome (C), 30S subunit vectors are shaded in red. Arrows of vectors shown in D–F are represented as balls of smaller radius (compared with initial points), circled in red. (Note that not all vectors are visible in the three-dimensional figure due to partial or complete overlapping.)
Acknowledgments
This work is supported by NIH LM-05652 and LM-06422, National Science Foundation DBI-9600637, and grants from IBM and Sun Microsystems. M.W.C. was supported by NIH GM-08294, M.B. was supported by NIH HG11223, and D.R.B. was supported by NIH GM-56847. We thank Dr. Mario Fragata for reading an earlier version of the manuscript and giving helpful comments.
The publication costs of this article were defrayed in part by payment of page charges. This article must therefore be hereby marked “advertisement” in accordance with 18 USC section 1734 solely to indicate this fact.
Footnotes
-
Article and publication are at http://www.rnajournal.org/cgi/doi/10.1261/rna.5141503.
-
- Accepted August 15, 2003.
- Received July 22, 2003.
- Copyright 2003 by RNA Society




