


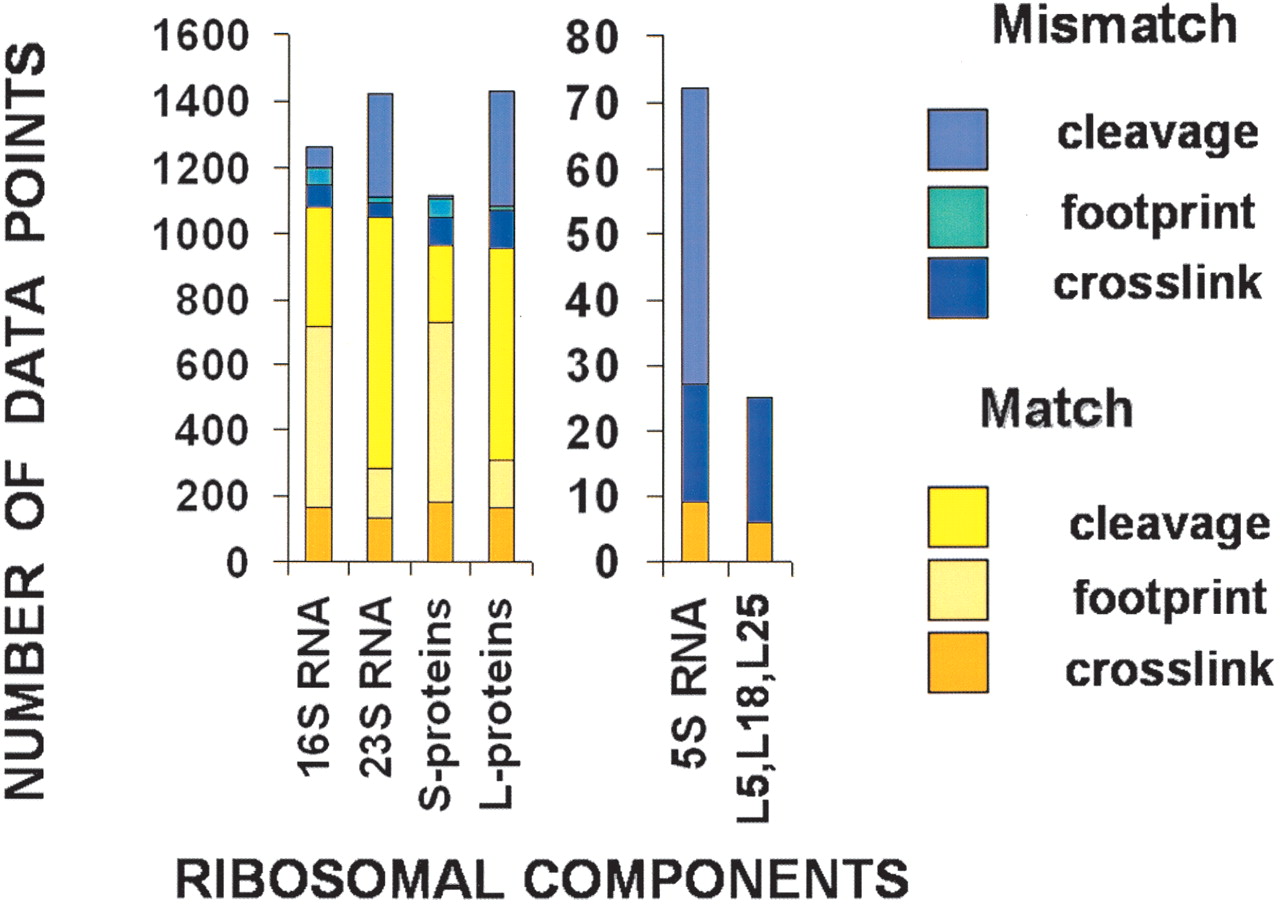
FIGURE 1.
Results of comparisons between distances predicted by biochemical experiments and crystal coordinates of rRNA and proteins in the ribosome. The Y-axis shows the number of matching (shades of yellow) and mismatching (shades of blue) data points for different types of experiments.




