


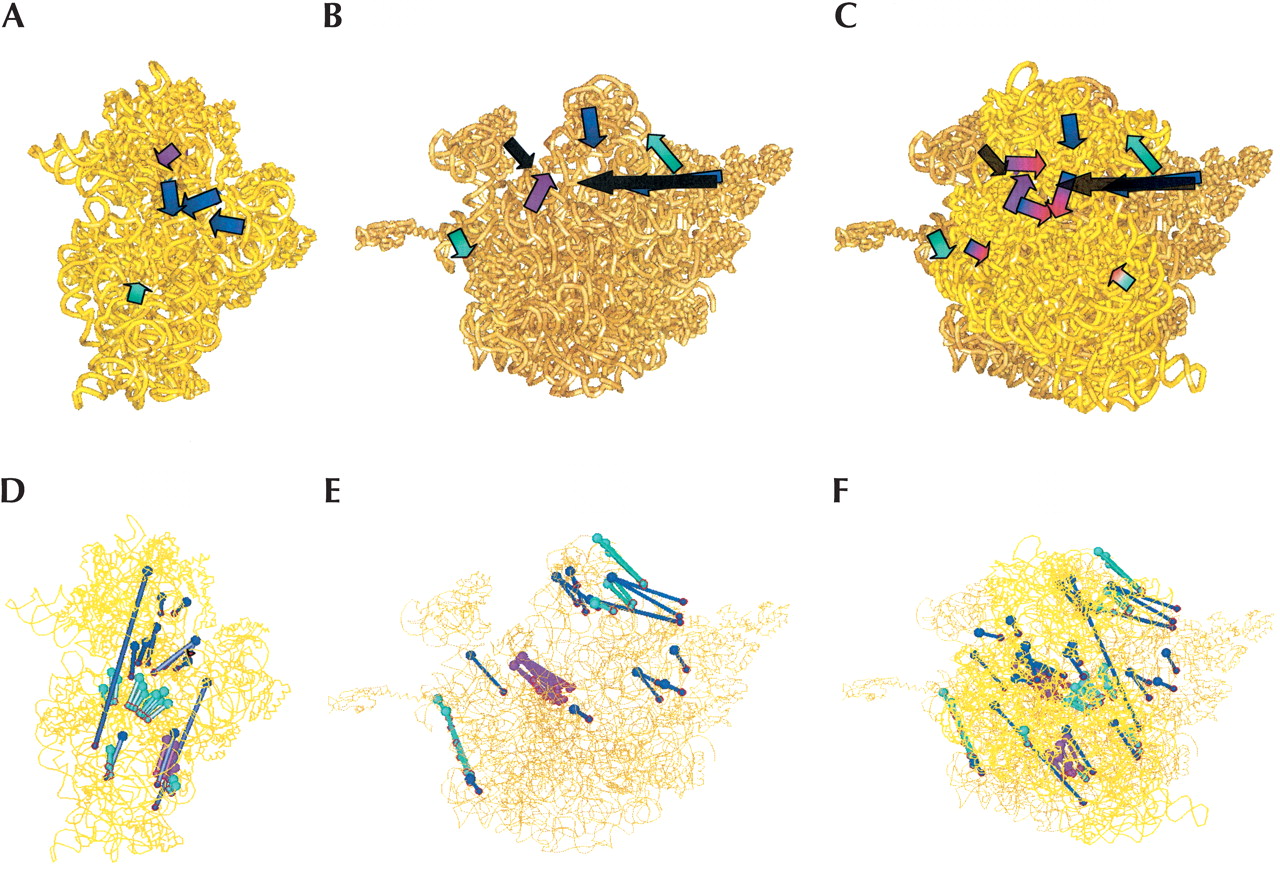
Vectors representing major clusters suggesting local movements (A–C) and exemplar subsets of coherent violation vectors suggesting more global motions (D–F) are shown for the 30S subunit (A, D), 50S subunit (B, E), and 70S ribosome (C, F). Color code for ribosomal subunits and intersubunit measurements is as follows: gold indicates 30S subunit; goldenrod, 50S subunit; blue, intrasubunit crosslinks; purple, footprints; turquoise, cleavage; and transparent black, intersubunit crosslinks. When shown on the 70S ribosome (C), 30S subunit vectors are shaded in red. Arrows of vectors shown in D–F are represented as balls of smaller radius (compared with initial points), circled in red. (Note that not all vectors are visible in the three-dimensional figure due to partial or complete overlapping.)




