


Live-cell imaging of circular and long noncoding RNAs associated with FUS pathological aggregates by Pepper fluorescent RNA
- Erika Vitiello1,5,
- Francesco Castagnetti1,5,
- Lorenzo Stufera Mecarelli1,2,
- Eleonora D'Ambra3,
- Paolo Tollis3,
- Giancarlo Ruocco3,
- Pietro Laneve4,
- Elisa Caffarelli4,
- Davide Mariani1,2 and
- Irene Bozzoni1,2,3
- 1Center for Human Technologies, Italian Institute of Technology, Genoa, Italy
- 2Department of Biology and Biotechnologies “C. Darwin”, Sapienza University of Rome, Rome, Italy
- 3Center for Life Nano- and Neuro-Science, Fondazione Italian Institute of Technology, Rome, Italy
- 4Institute of Molecular Biology and Pathology, CNR, Rome, Italy
- Corresponding authors: irene.bozzoni{at}uniroma1.it, davide.mariani{at}iit.it
-
Handling editor: Maria Carmo-Fonseca
Abstract
Lately, important advancements in visualizing RNAs in fixed and live cells have been achieved. Although mRNA imaging techniques are well-established, the development of effective methods for studying noncoding RNAs (ncRNAs) in living cells is still challenging but necessary, as they show a variety of functions and intracellular localizations, including participation in highly dynamic processes like phase transition, which is still poorly studied in vivo. Addressing this issue, we tagged two exemplary ncRNAs with the fluorescent RNA (fRNA) Pepper. Specifically, we showed that circ-HDGFRP3 interacts with p-bodies and is recruited in pathological FUS aggregates in a dynamic fashion, and we super-resolved its distribution in such condensates via structured illumination microscopy. Moreover, we tracked the long noncoding RNA (lncRNA) nHOTAIRM1, a motor neuron–specific constituent of stress granules, monitoring its behavior throughout the oxidative-stress response in physiological and pathological conditions. Overall, as fRNA development progresses, our work demonstrates an effective use of Pepper for monitoring complex processes, such as phase transition, in living cells through the visualization of circular RNAs (circRNAs) and lncRNAs with super-resolution power.
Keywords
- live imaging of circular RNAs
- live imaging of noncoding RNAs
- Pepper fluorescent RNA
- liquid–liquid phase separation
- FUS aggregates
- super resolution microscopy
INTRODUCTION
Over the years, considerable effort has been spent in developing tools for imaging RNAs. Although advances in RNA FISH (fluorescent in situ hybridization) have yielded significant results in terms of spatial resolution and multiplexing, a lot of information is missing when it comes to study the RNA dynamics. Approaches based on chemically synthesized probes and genetically encoded probes were developed for targeting endogenous RNAs (Le et al. 2022); however, they encounter limitations determined by the abundance of the target RNA, high background signal, and off-target issues (Tyagi and Kramer 1996; Ma et al. 2017; Yang et al. 2019; Tang et al. 2022; Wang et al. 2022). The most diffused tools for RNA live imaging take advantage of RNA-binding proteins that can be fused to a fluorescent molecule, like a fluorescent protein (FP), to target exogenous RNAs of interest (Le et al. 2022). Nonetheless, this approach requires up to 48 FPs tethered to a single RNA molecule, resulting in high hindrance for the target RNA (Peabody 1993; Le et al. 2022). To overcome these limitations, fluorescent RNAs (fRNAs) are improving fast, too. The first developed dye-binding RNA aptamer, Spinach, is able to bind a molecule that mimics the GFP chromophore, remaining nonfluorescent in its free state but becoming fluorescent upon binding to the RNA aptamer, due to rigidification (Paige et al. 2011). In 2019, Yang and colleagues (Chen et al. 2019) described the new family of dye-binding aptamers Peppers, addressing the main issues of previously described fRNAs (Paige et al. 2011; Jeng et al. 2016), which were limited in brightness, color, and photostability. The Pepper aptamer binds a series of custom small molecules named HBC, proving enhanced efficiency in targeting a wide range of RNAs with a relatively short RNA tag, potentially enabling the visualization of different classes of noncoding RNAs (ncRNAs).
Nonetheless, with the exception of circular RNA (circRNA) aptamers utilized as metabolite biosensors (Litke and Jaffrey 2019), there are no examples in the literature of live imaging experiments performed on circRNAs and few examples are provided for long noncoding RNAs (lncRNAs) (Chen et al. 2019; Yang et al. 2019; Cawte et al. 2020; Sarfraz et al. 2023).
Indeed, circRNAs originate from a noncanonical splicing event, the back-splicing reaction, a process that is driven by the matching of complementary intronic sequences or by specific RNA-binding proteins (Ashwal-Fluss et al. 2014; Conn et al. 2015; Kramer et al. 2015; Errichelli et al. 2017; Fei et al. 2017). The back-splicing junction (BSJ) is the only specific sequence that distinguishes a circRNA from other linear isoforms deriving from the same pre-mRNA, making circRNAs challenging to target both in fixed and in live cells (Bejugam et al. 2020).
Interestingly, ncRNAs, and in particular circRNAs, are thought to play a major role in ribonucleoparticles (RNPs) assembly and transport as well as in the promotion of liquid–liquid phase separation (LLPS) events (Molliex et al. 2015; Rybak-Wolf et al. 2015; You et al. 2015; Jain et al. 2016; Khong et al. 2017; Namkoong et al. 2018; Corbet and Parker 2019; D'Ambra et al. 2019). These biological processes, often deregulated in neurodegenerative diseases, are highly dynamic (Protter and Parker 2016), making it crucial to explore them through live imaging assays. Although important contributions have occurred in the study of these processes for several mRNA species (Le et al. 2022), the application of live imaging techniques in the context of ncRNAs remains quite limited and unexplored (Yang et al. 2019).
With these premises, we designed overexpression plasmids to track the dynamics of paradigmatic ncRNAs, associated with pathological condensates formed upon mutations in the ALS-linked FUS protein, tagging them with Pepper fRNA (Chen et al. 2019). Specifically, we dedicated our effort to visualize through live imaging the circRNA circ-HDGFRP3 (D'Ambra et al. 2021) and the lncRNA nHOTAIRM1 (Rea et al. 2020; Tollis et al. 2023), providing an effective model for studying diverse classes of ncRNAs in physiological and pathological conditions.
RESULTS
Engineering and validation of overexpression constructs for circRNAs live imaging
circ-HDGFRP3, which originates from the circularization of exons 2, 3, 4, and 5 of the HDGFRP3 (hepatoma-derived growth factor-related protein 3) gene, was selected as a representative example for live imaging due to its ability to traffic along neurites under normal conditions while being trapped in protein condensates when FUS aggregates are induced (D'Ambra et al. 2021).
The overexpression construct for circ-HDGFRP3 tagged with the fRNA Pepper was obtained by cloning the region to be circularized between the inverted complementary sequences (ICSs) of the ZKSCAN1 MCS vector (Kramer et al. 2015; Legnini et al. 2017), which also harbors a doxycycline inducible promoter (hereby named “p-circ,” Fig. 1A). Second, to tag the circRNA with Pepper preserving the integrity of the BSJ, we identified two different Pepper insertion sites: one within exon 4 of circ-HDGFRP3, generating the plasmid p-circ-Ex4 and another within exon 5, generating the plasmid p-circ-Ex5. As circ-HDGFRP3 is 522 bp long, an array of 4xPepper (196 bp) was cloned in each insertion site, optimizing the balance between signal-to-noise ratio and length of the target.
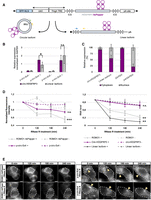
Overexpression constructs for visualization of exogenous circRNAs tagged with Pepper. (A) Graphical representation of the p-circ overexpression plasmids designed to tag and visualize circRNAs with the fRNA Pepper. Green and blue arrows represent forward primers and yellow arrows represent common reverse primers, respectively, used to amplify the BSJ of circ-HDGFRP3 and the linear isoforms. (B) Expression levels quantified through qPCR of circ-HDGFRP3 and of the linear isoform upon p-circ-Ex4 and p-circ-Ex5 transfection, with (+) or without (−) doxycycline administration, normalized on GAPDH levels. Error bars represent ± SEM (N = 3). (*) P = 0.05 corresponds to two-tailed unpaired Student's t-test (N = 3) calculated on DDCt values normalized on the -rt samples to account for plasmid DNA contamination. (C) Nuclear/cytoplasmic fractions of exogenous circ-HDGFRP3 and its relative linear isoform expressed in percentage. GAPDH and preGAPDH were used as cytoplasmic and nuclear controls, respectively. Error bars represent ± SEM (N = 3). (D) Left chart represents normalized fluorescence intensities fluctuations of HBC620 dye bound to ROMO1-4xPepper (gray, solid line) or to p-circ-Ex4 transcript (magenta, solid line) upon 120, 180, and 240 min of RNase R treatment. Cells transfected with overexpression plasmids but not treated with Triton X-100, hence not exposed to RNase R, were used as a negative control (dashed lines). Error bars represent ± SEM. (***) P ≤ 0.001 corresponds to two-tailed unpaired Student's t-test (N = 3) calculated on unnormalized fluorescent intensity measurements of treated versus nontreated cells at 240 min. Right chart represents RNA levels of ROMO1 mRNA (gray), circ-HDGFRP3 (magenta) and of the linear isoform (black) exposed (solid line) or not exposed (dashed line) to 120, 180, and 240 min of RNase R treatment. Error bars represent ± SEM. (**) P ≤ 0.01 corresponds to two-tailed unpaired Student's t-test (N = 3) calculated on DCt of treated versus nontreated RNAs at 240 min. (E) Representative cells transfected with ROMO1-4xPepper (left panel) or p-circ-Ex4 (right panel) constructs treated and nontreated with RNase R at 0, 120, 180, and 240 min time points. Yellow arrows highlight focal foci in cells transfected with p-circ-Ex4. Scale bars, 5 μm.
After engineering, we tested the overexpression level and the circularization efficiency of the different p-circ constructs. Indeed, the coupling of the ICSs is not a flawlessly efficient process (Kramer et al. 2015) and plasmid transcription could result in a different proportion of properly circularized transcript compared to a spurious linear noncircularized transcript (linear isoform) composed of the ICSs, the exons of the circRNA, the sequence of Pepper and canonical 5′-cap and poly(A) tail (Fig. 1A).
Importantly, the linear isoform might as well retain the ability to bind the fluorogenic dye, possibly causing unwanted fluorescent signal.
To determine the expression level of both circular and linear isoforms, qPCR analysis was performed upon transfection and doxycycline induction in HEK 293T cells. To distinguish between the two isoforms, divergent primers were designed to amplify the BSJ of circ-HDGFRP3, whereas one primer on the ICSs and one primer close to the 5′ end of circ-HDGFRP3 were used to detect the linear isoform; more specifically, the reverse primer is common for both the targets. To minimize biases given by performing qPCR with different primer pairs, amplification efficiency was evaluated through standard curve quantification, resulting comparable for the circular and linear isoforms-amplifying reactions (2003 and 1971, respectively). qPCR results showed that both p-circ-Ex4 and p-circ-Ex5 ensured satisfactory overexpression of the circular isoform, even if p-circ-Ex5 generated a higher amount of linear isoform compared to p-circ-Ex4. Importantly, p-circ-Ex4 provided a favorable circular-to-linear ratio, with the circular isoform being significantly more abundant than the linear one (Fig. 1B). Therefore, p-circ-Ex4 was selected to evaluate whether the insertion of Pepper affected the localization of exogenous circ-HDGFRP3. Nuclear/cytoplasmic fractionation experiments in HEK 293T cells transfected with p-circ-Ex4 revealed that exogenous circ-HDGFRP3 was mostly exported in the cytoplasm (91%), consistent with the localization of the endogenous transcript, previously described as mainly cytoplasmic (Errichelli et al. 2017). On the other hand, the linear isoform was equally distributed between nucleus (45%) and cytoplasm (55%) (Fig. 1C).
Altogether, these experiments indicated that Pepper insertion did not perturb the cytoplasmic localization of circ-HDGFRP3.
Detection of exogenous circ-HDGFRP3 in living cells
To assess the visualization of exogenous circ-HDGFRP3, we treated p-circ-Ex4 transfected HEK 293T cells with the HBC620 fluorogenic dye. Successfully transfected cells were monitored thanks to the tagBFP reporter gene adapted with a nuclear localization signal (BFP-NLS) cloned into the p-circ-Ex4 construct (Fig. 1A). To set the background signal, cells without doxycycline were used (Supplemental Fig. S1A, left panel). When looking at the HBC620 fluorescent signal in doxycycline-treated cells, we could observe quite clear cytoplasmic focal foci (Supplemental Fig. S1A, right panel, yellow arrows), in agreement with the localization of the endogenous circ-Hdgfrp3 (D'Ambra et al. 2021). To quantify the signal above background, we compared the mean fluorescence intensity of HEK cells transfected with 2000 ng of p-circ-Ex4 with the one of nontransfected cells treated with HBC only. A significant increase in mean fluorescent intensity was measured (Supplemental Fig. S1B), indicating that p-circ-Ex4 construct is correctly folded, responds to the fluorophore and provides a good signal-to-noise ratio.
To demonstrate that the fluorescent signal corresponding to such foci mainly derived from circularized circ-HDGFRP3 molecules, we treated transfected cells with RNase R and imaged them with HBC620. In fact, it is well described although circRNAs are resistant to RNase R activity, linear RNAs are rapidly degraded (Nielsen et al. 2022). The transcript of ROMO1 (Chung et al. 2006) tagged with 4xPepper, was used as linear control and indicated that the RNase R treatment was working properly; in fact, although without RNase R, we observed only a 15% decrease of the fluorescent signal between 0 and 240 min (Fig. 1D, left panel, and Fig. 1E), paralleling the reduction in RNA level, which was of 20% (Fig. 1D, right panel), upon the nuclease treatment the reduction of the fluorescent signal and of the RNA was conspicuous, reaching residual values of 55% and 32% respectively (Fig. 1D,E). In comparison, the fluorescent signal provided by p-circ-Ex4 without RNase R treatment decreased only 5% (Fig. 1D, left panel and Fig. 1E), whereas the RNA levels of both exogenous circ-HDGFRP3 and of its linear isoform decreased 20% (Fig. 1D, right panel). Interestingly, after 240 min of RNase R treatment the fluorescent signal from p-circ-Ex4 decreased 25% compared to time 0 (Fig. 1D, left panel, and Fig. 1E); notably, at the end of the treatment, although the circRNA levels remained at 78% of the initial amount, the linear isoform dropped down to 15% (Fig. 1D, right panel). To exclude that these observations could be biased by differential expression levels, we also showed nonnormalized data of circ-HDGFRP3 and its linear isoform RNA levels upon RNase R treatment (Supplemental Fig. S1C). The fact that, in the case of p-circ-Ex4, the fluorescence was only partially affected (25%) upon exonucleolytic treatment, indicated that the detected signals were mostly provided by circular molecules. Moreover, because these cytoplasmic fluorescent signals concentrated in focal foci (Fig. 1E), we could derive that these foci were made by circ-HDGFRP3 molecules. To be noted, the decrease in fluorescence intensity between cells transfected with p-circ-Ex4 with and without RNase R treatment was nonstatistically significant (Fig. 1D, left panel). However, this would suggest that ∼20% of the signal provided by p-circ-Ex4 would be accounted to the linear isoform. Further supporting this hypothesis, we did not identify any discrete puncta in the nuclear compartment, which contains only the linear isoform, allowing us to conclude that such isoform produces diffused signals difficult to discriminate from the background (Fig. 1E), which mostly consists of free, unbound HBC (Supplemental Fig. S1A, left panel).
circ-Hdgfrp3 interacts with processing bodies (p-bodies)
To evaluate the identity of such spots, we investigated circ-Hdgfrp3 interaction with canonical cytoplasmic organelles. Because different circRNA species have been discovered to interact with mRNAs and to regulate their stability and translation (Rossi et al. 2022; Grelloni et al. 2024), we investigated the association with p-bodies which are known to act on posttranscriptional regulation of mRNAs and to dynamically exchange with stress granules (SG) (Kedersha et al. 2005; Luo et al. 2018; Moon et al. 2019).
We initially took advantage of Basescope technology to perform smFISH on endogenous circ-Hdgfrp3, coupled with IF for the DCP1A (decapping mRNA 1A) protein, a marker of p-bodies and with TIAR protein, a marker of SG. Staining was performed in mouse embryonic stem cells (mESCs) derived motor neurons (mMNs) nontreated (Fig. 2A, upper panels) or treated with 0.5 mM NaAsO2 for 1 h, to induce oxidative stress response (Fig. 2A, lower panels). Differentiation was validated by qPCR measuring the expression levels of OCT4, a marker of staminality, PAX6 and HB9, markers of motor neuron differentiation and ISLET and ChAT, markers of mature motor neurons (Supplemental Fig. S2A; Wichterle and Peljto 2008; Briggs et al. 2017). A strong association (55%) was observed between circ-Hdgfrp3 and DCP1A signals in nonstressed conditions, suggesting a close interplay between the circRNA and p-bodies (Fig. 2B, left chart), whereas TIAR remained mostly retained in the nucleus (Fig. 2A, upper panels). When oxidative stress was induced, 60% of the circ-Hdgfrp3 spots associated with DCP1A (Fig. 2B, right chart). In these conditions, we also observed circ-Hdgfrp3 spots localizing with both DCP1A and TIAR (Fig. 2A, lower panels, magnified details).
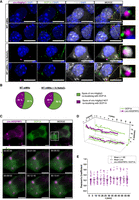
circ-Hdgfrp3 interacts with p-bodies in murine MNs and in living mammalian cells. (A) Upper panels: two examples of colocalization between circ-Hdgfrp3 (magenta) and DCP1A (green) in nonstressed mESCs-derived MNs. Lower panels: two examples of association between circ-Hdgfrp3 (magenta), DCP1A (green), and TIAR (gray) in stressed mESCs-derived MNs. Oxidative stress response was monitored with TIAR (gray) staining. Magnified yellow boxes highlight the colocalizing spots. Scale bars, 10 μm. (B) Quantification of circ-Hdgfrp3 spots colocalizing with DCP1A signals in murine MNs in nonstressed (left panel) and stressed (right panel) conditions (NWT MNs = 25 cells; NWT MNs+NaAsO2 = 30 cells). (C) Representative HEK 293T cells expressing circ-HDGFRP3 labeled with HBC620 (magenta) and GFP-DCP1A (green). Lower panel shows a magnification view of the white box with circ-HDGFRP3 and DCP1A interacting over time (duration 15 min; interval ∼11 sec). Spots and tracks detected with TrackMate Plug-in on Fiji-ImageJ are overlaid, respectively, as magenta (circ-HDGFRP3) and green (DCP1A) circles and lines. Scale bars, 5 μm. (D) Single-particle tracking of circ-HDGFRP3 and DCP1A spots shown in C over time. The plot indicates circ-HDGFRP3 (magenta) and DCP1A (green) xy-coordinates (micron) as a function of time (min). (E) Scatter interval plot representing PCC between circ-HDGFRP3 and DCP1A over time upon NaAsO2 administration. Dots represent individual measurements of PCC in an interval of 5 min collected from 17 time-lapse acquisitions (duration 1 h; interval 1–5 min) from two independent biological replicates. Horizontal lines indicate mean values and error bars represent ± SEM.
Subsequently, we generated HEK 293T stable cell lines expressing DCP1A tagged with eGFP, and we verified that exogenous GFP-DCP1A colocalized with endogenous p-bodies, stained with anti-DCP1A antibody (Supplemental Fig. S2B) in unstressed (89%) and stressed (83%) conditions (Supplemental Fig. S2C). We transfected these cells with the p-circ-Ex4 plasmid and imaged circ-HDGFRP3 and GFP-DCP1A for 15 min at a temporal resolution of ∼11 sec/frame; then we performed single-particle tracking (SPT) on selected regions of interest (ROIs) taking advantage of the TrackMate plug-in on Fiji Image-J (Tinevez et al. 2017; Ershov et al. 2022). Trajectories of representative particles were plotted as a function of time, confirming a persistent association between the circRNA and p-bodies (Fig. 2C,D; Supplemental Movie S1). Besides, we also imaged circ-HDGFRP3 and GFP-DCP1A upon NaAsO2 treatment, and we measured the Pearson's correlation coefficient (PCC) over time. In line with the analysis in fixed samples, because the PCC value fluctuated between 0.2 and 0.3 over time, we could define that circ-HDGFRP3 positively and evenly correlated with GFP-DCP1A (Fig. 2E; Supplemental Movie S2).
circ-HDGFRP3 tagged with Pepper fRNA associates with mutant FUS aggregates in living mammalian cells
Next, we wanted to test through live imaging the association of Pepper-tagged circ-HDGFRP3 in FUS aggregates. Hence, we produced stable HEK 293T cell lines expressing FUSP525L tagged with eGFP. Remarkably, when transfecting cells expressing GFP-FUSP525L with p-circ-Ex4, a strong colocalization between the GFP and the HBC620 signal was observed, suggesting that exogenous circ-HDGFRP3 correctly colocalizes with FUSP525L aggregates (Fig. 3A; Supplemental Movie S3). We then imaged the particles for ∼10 min at a temporal resolution of ∼11 sec/frame, and we measured the average number of interactions in an interval of 1 min (Fig. 3B, magenta), showing that circ-HDGFRP3 and FUSP525L signals strongly intersect in both space and time. Moreover, we also performed SPT for both circ-HDGFRP3 and FUSP525L signals, confirming a persistent colocalization between FUSP525L and the circRNA (Fig. 3C; Supplemental Movie S3).
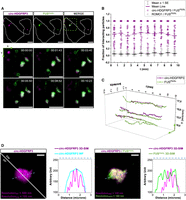
Visualization of exogenous circ-HDGFRP3 colocalizing with FUSP525L aggregates in living HEK 293T cells. (A) Representative HEK 293T cells transfected with p-circ-Ex4 expressing both circ-HDGFRP3 labeled with HBC620 (magenta) and GFP-FUSP525L (green). Lower panel shows a magnification view of the green dotted box with some circ-HDGFRP3 and FUSP525L particles interacting over time (duration 10 min; interval ∼11 sec). Spots and tracks detected with TrackMate Plug-in on Fiji-ImageJ are overlaid respectively as magenta (circ-HDGFRP3) and green (FUSP525L) circles and lines. Scale bars, 5 μm. (B) Scatter interval plot representing circ-HDGFRP3 (magenta) and ROMO1 (gray) fraction of interacting particles with FUSP525L over time. Dots represent individual measurements of number of interacting particles/total number of particles per cell in an interval of 1 min. Error bars represent ± SEM. Magenta and black lines represent mean values. Average and SEM values were calculated from 10 time-lapse measurements (duration 10 min; interval 11–13 sec) collected from four independent biological replicates for circ-HDGFRP3/FUSP525L interactions and from six measurements from two independent biological replicates for ROMO1/FUSP525L interactions. (C) Single-particle tracking of circ-HDGFRP3 and FUSP525L particles shown in A over time. The plot indicates circ-HDGFRP3 (magenta) and FUSP525L (green) xy-coordinates (micron) as a function of time (min). (D) Representative FUSP525L aggregate containing circ-HDGFRP3. Starting from left, signals of circ-HDGFRP3 labeled with HBC620 imaged with Widefield or with 3D-SIM are compared. Intensity profiles (Arbitrary Unit) along the reference blue dotted line of circ-HDGFRP3 signal imaged with Widefield (cyan) or with 3D-SIM (magenta) microscopy are plotted in second panel. Third panel shows FUSP525L signal (green) merged with circ-HDGFRP3 signal (magenta) imaged with 3D-SIM. Respective resolution values calculated on the image are indicated at the bottom of the image. In the last panel, intensity profiles (arbitrary unit) of circ-HDGFRP3 and FUSP525L imaged with 3D-SIM along the blue dotted line are represented. Scale bars, 1 μm.
To assess that the observed association was actually due to the circRNA sequence and was not caused by a spurious interaction between the sequence of Pepper and the FUSP525L protein, we also performed live imaging and SPT of ROMO1 tagged with four Pepper repetitions. Indeed, this mRNA was selected as a negative control because it is strongly depleted from both WT and FUSP525L-containing SG in the data set of Mariani et al. (2024). The average number of interactions in a 1-min interval was counted (Fig. 3B, gray), and trajectories of ROMO1 and FUSP525L were tracked and plotted (Supplemental Fig. S3A,B; Supplemental Movie S4). These measurements showed a very low interaction between ROMO1 mRNA and FUSP525L, confirming that Pepper tag alone is not sufficient to determine a stable interaction with FUSP525L.
Moreover, because the HBC620 dye is compatible with structured illumination microscopy (SIM), we super-resolved the localization of circ-HDGFRP3 in the larger FUSP525L aggregates. As shown by the intensity profiles, a substantial increase in axial resolution (WF ResolutionHBC = 588 nm; SIM ResolutionHBC = 155 nm) was obtained imaging Pepper-tagged circ-HDGFRP3 by SIM, when compared to Widefield microscopy (Fig. 3D, left panels). Moreover, by plotting the intensity profile of both HBC620 and eGFP signals imaged with SIM, we were able to determine circ-HDGFRP3 subcompartmental distribution in FUSP525L aggregates, unveiling nonuniform signal foci of the circRNA partaking in such structures (Fig. 3D, right panels). Unequal distribution of RNA in phase-separated granules imaged in super-resolution has already been described in other systems (Jain et al. 2016). Noticeably, the foci of circ-HDGFRP3 signals did not show perfect coplanarity with the ones of FUSP525L, in line with the assumption that, as predicted by CatRapid (Bellucci et al. 2011), there are no binding sites for FUS on circ-HDGFRP3. Therefore, these measurements suggest that circ-HDGFRP3 entrapment in pathological FUS aggregates might be due to the intermediation of different protein partners.
Taken together, these data demonstrate that Pepper is a potent tool for live, super-resolved imaging of circRNAs, when associated with specific membrane-less organelles, enabling the monitoring of their intracellular localization and interaction in supra-molecular structures.
The lncRNA nHOTAIRM1 localizes in physiological and pathological SG
Many lncRNAs have been linked to the formation of amyloid aggregates and to the pathogenesis of diverse neurodegenerative diseases (Wang et al. 2018). For this reason, we also decided to explore the behavior of nHOTAIRM1, an attractive case study of lncRNA in an ALS-like context. The neuronal isoform of the lncRNA HOTAIRM1 (nHOTAIRM1) plays a crucial role in the control of neuronal differentiation (Rea et al. 2020; Tollis et al. 2023) and is highly expressed in MNs. nHOTAIRM1 has been shown to directly interact with the FUS protein in the cytoplasm (Rea et al. 2020), where FUS regulates its abundance. Nonetheless, it remained un-investigated how nHOTAIRM1 responds to stress stimuli, specifically in ALS conditions.
Therefore, we examined its behavior in WT and FUSP525L human-induced pluripotent stem cells (iPSCs)-derived MNs upon NaAsO2 administration (De Santis et al. 2018). Differentiation was validated also in this case by qPCR measuring the expression levels of OCT4, a marker of staminality, PAX6 and HB9, markers of motor neuron differentiation and ISLET and ChAT, markers of mature motor neurons (Supplemental Fig. S4A; Briggs et al. 2017). Then, we combined smFISH and immunofluorescence (IF), targeting nHOTAIRM1, the SG marker G3BP1 and FUS. As previously reported, we observed that nHOTAIRM1 signal was distributed both in the nucleus and in the cytoplasm (Rea et al. 2020; Tollis et al. 2023), in both WT and FUSP525L conditions (Fig. 4A). Colocalization analysis on both nHOTAIRM1 and G3BP1 signals showed that, in stressed WT MNs, a substantial portion of nHOTAIRM1 (64%) colocalized with G3BP1-positive SG (Fig. 4B), whereas as expected, WT FUS mostly localizes in the nucleus (Fig. 4A, upper panel; Dormann et al. 2010; Kino et al. 2011). In FUSP525L MNs, where FUS delocalizes in the cytoplasm and participates in SG (Fig. 4A, lower panel; Bosco et al. 2010; Lenzi et al. 2015), nHOTAIRM1 was again recruited to SG. Specifically, 45% of the spots colocalized with granules positive for both G3BP1 and mutant FUS, 19% of the signal colocalized with G3BP1 alone, 4% colocalized only with mutant FUS, and 32% of the spots did not colocalize (Fig. 4C). Collectively, these data indicate that nHOTAIRM1 is recruited to SG upon oxidative stress induction independently of FUS mutation. Indeed, both WT and FUSP525L MNs exhibited the same percentage of nHOTAIRM1 localized in SG, with no significant difference between the two conditions (Fig. 4B,C).
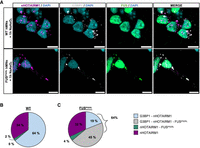
The lncRNA nHOTAIRM1 colocalizes with physiological and pathological SG. (A) Combination of smFISH and IF for the detection of nHOTAIRM1 (magenta), G3BP1 (gray), and FUS (green) in stressed WT (upper panel) or stressed FUSP525L (lower panel) iPSCs-derived MNs. Nuclei stained with DAPI are shown in cyan. Scale bars, 10 μm. (B, C) Pie charts representing nHOTAIRM1 percentage of colocalization in WT (B) or FUSP252L (C) MNs with G3BP1-positive granules (light blue), FUS-positive granules (green), G3BP1- and FUSP525L-positive granules (gray), and percentage of free nHOTAIRM1 spots (magenta). Mean percentages from three independent biological replicates are shown (NWT = 549 cells; NFUSP525L = 84 cells).
Moreover, we stained WT and FUSP525L MNs, treated or nontreated with NaAsO2, with TIAR and DCP1A, together with the smFISH for nHOTAIRM1 (Supplemental Fig. S4B), and we calculated PCC between nHOTAIRM1 and DCP1A signal to determine if nHOTAIRM1 interacts with p-bodies. A PCC close to 0 was measured in unperturbed WT MNs (Supplemental Fig. S4C), indicating a poor correlation between nHOTAIRM1 and p-bodies. The PCC increased significantly when inducing oxidative stress (Supplemental Fig. S4C), in line with the assumption that nHOTAIRM1 colocalizes with SG (Fig. 4B; Supplemental Fig. S4D) and that p-bodies dock onto SG upon NaAsO2 treatment, as suggested by the increase of TIAR/DCP1A colocalization (Supplemental Fig. S4E; Kedersha et al. 2005). Interestingly, the PCC between nHOTAIRM1 and DCP1A increased in FUSP525L conditions regardless of stress induction (Supplemental Fig. S4C). As it was previously demonstrated that nHOTAIRM1 biochemically interacts with FUS (Rea et al. 2020; Tollis et al. 2023) and that mutant FUS binds and sequesters proteins involved in p-bodies formation (Takanashi and Yamaguchi 2014), these data suggest that the presence of mutant FUS in the cytoplasm could drive the interaction between nHOTAIRM1 and p-bodies.
nHOTAIRM1 is dynamically recruited in SG in live mammalian cells
Evidence of nHOTAIRM1 recruitment into SG collected in fixed samples was complemented with temporal and dynamic information, leveraging Pepper once again. We designed an overexpression construct to tag nHOTAIRM1 with a 4xPepper array inserted at the 3′ end of the lncRNA (Supplemental Fig. S5A). To follow nHOTAIRM1 behavior during the oxidative stress response, we transfected the construct in HEK 293T cells stably expressing G3BP1 or FUSP525L tagged with eGFP. The nHOTAIRM1-4xPepper plasmid provided high transcript levels in both HEK 293T stable lines if compared to the housekeeping mRNA for GAPDH (Supplemental Fig. S5B). Hence, upon transfection, it was possible to visualize nHOTAIRM1 bound to the HBC620 dye, with a considerable proportion of the total transfected cells emitting a robust fluorescent signal, mostly diffused in the cytoplasm (Figs. 5A and 6A, magenta). Quantification of signal above background in HEK cells transfected with 2000 ng nHOTAIRM1-4xPepper showed also in this case a significant increase in mean fluorescent intensity (Supplemental Fig. S5C), resulting in a good signal-to-noise ratio. Transfecting nHOTAIRM1 tagged with Pepper in GFP-G3BP1 HEK cells, allowed us to observe its dynamics throughout the entire stress event. As expected, within the first 30 min upon NaAsO2 treatment, we witnessed LLPS of G3BP1, which formed droplet-like structures eventually becoming SG (Fig. 5A,B; Supplemental Movie S5). Interestingly, nHOTAIRM1 also underwent condensation, and we could observe fusion events between the lncRNA and the protein concurrent with the formation of mature SG (Fig. 5B, asterisks). These observations were consistent with an increase over time of Manders’ overlap coefficient (MOC) between nHOTAIRM1 and G3BP1 signals (Fig. 5C). As MOC can range from 0 to 1, these measurements indicate that a considerable fraction of nHOTAIRM1 signal overlaps with G3BP1 one, upon NaAsO2 treatment. To highlight the condensation event, we generated binary masks of the selected ROIs (Fig. 5B, second and fourth rows) and we obtained the intersection mask between G3BP1 and nHOTAIRM1 thanks to the Image Calculator on Fiji-ImageJ. Paralleling the increase in MOC, we observed an increase in the intersection area between G3BP1 and nHOTAIRM1 channels over time (Fig. 5D). As a negative control, we exploited again the mRNA of ROMO1 tagged with 4xPepper and monitored its behavior upon oxidative stress (Supplemental Fig. S5D). In line with the assumption that ROMO1 mRNA is excluded from SG, the average MOC between ROMO1 and G3BP1 remained close to 0 and, importantly, it did not increase over time (Supplemental Fig. S5F). To corroborate our observations, we performed a paired Student's t-test comparing MOC distribution at time 0 min with the distribution at time 60 min. A significant increase in MOC was calculated for nHOTAIRM1–G3BP1 (Supplemental Fig. S5H, purple boxes); conversely, a nonsignificant statistic was obtained evaluating ROMO1–G3BP1 MOC variation over time (Supplemental Fig. S5H, orange boxes). Paralleling these data, an unpaired Student's t-test between nHOTAIRM1–G3BP1 MOC and ROMO1–G3BP1–MOC at time 60 showed nHOTAIRM1-G3BP1 MOC distribution to be significantly higher than the one of ROMO1–G3BP1 (Supplemental Fig. S5H), confirming stronger pixel co-occurrence between nHOTAIRM1 and G3BP1 throughout the stress event.
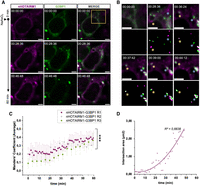
nHOTAIRM1 recruitment in SG followed with Pepper fRNA. (A) Representative HEK 293T cell expressing both nHOTAIRM1 labeled with HBC620 (magenta) and GFP–G3BP1 (green). Time 00:00:00 corresponds to 0.5 mM NaAsO2 administration (upper row), whereas in the following time points (second and third row) formation of SG can be followed (duration 1 h; interval 1–3 min). All scale bars correspond to 5 μm. (B) Magnification view of yellow box in A showing different nHOTAIRM1 particles and G3BP1 undergoing LLPS throughout the oxidative stress event (yellow and light blue asterisks) and merging (time points 00:39:00 and 00:44:12). Second and fourth row show binary masks of the selected time points highlighting fusion events. Scale bars, 5 μm. (C) Average Manders’ coefficient between nHOTAIRM1 and G3BP1 over time upon NaAsO2 administration. Dots represent average values of Manders’ coefficient. Error bars represent ± SEM. Average and SEM values were calculated from 5 to 10 time-lapse measurements (duration 1 h; interval 1–5 min) collected from three independent biological replicates. Each color (magenta, gray, and green) corresponds to a single biological replicate. (***) P ≤ 0.001 corresponds to two-tailed paired Student's t-test (N = 3). (D) Scatter plot showing intersection area over time calculated from intersection mask between G3BP1 and nHOTAIRM1 signals of A. A polynomial curve was fitted to the points in order to show the increase over time (R2 = 0.8838).
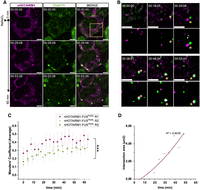
nHOTAIRM1 recruitment in ALS-like granules followed with Pepper fRNA. (A) Representative cell expressing both nHOTAIRM1 labeled with HBC620 (magenta) and GFP-FUSP525L (green). Time 00:00:00 corresponds to 0.5 mM NaAsO2 administration (upper row), whereas in following time points (second and third row) formation of FUSP525L condensates can be followed (duration 1 h; interval 1–5 min). Scale bars, 5 μm. (B) Magnification view of yellow box in D showing nHOTAIRM1 and FUSP525L undergoing LLPS throughout the oxidative stress event (yellow asterisk) and finally merging (time point 00:38:51). Second and fourth row show binary masks of the selected time points highlighting fusion events. Scale bars, 5 μm. (C) Average Manders’ coefficient between nHOTAIRM1 and FUSP525L over time upon NaAsO2 administration. Dots represent average values of Manders’ coefficient. Error bars represent ± SEM. Average and SEM values were calculated from 5 to 10 time-lapse measurements (duration 1 h; interval 1–5 min) collected from three independent biological replicates. Each color (magenta, gray, and green) corresponds to a single biological replicate. (***) P ≤ 0.001 corresponds to two-tailed paired Student's t-test (N = 3). (D) Scatter plot showing intersection area over time calculated from intersection mask between FUSP525L and nHOTAIRM1 signals of Figure 6A. A polynomial curve was fitted to the points in order to show the increase over time (R2 = 0.9035).
As we determined that nHOTAIRM1 also colocalizes with SG containing FUSP525L (Fig. 4C), we replicated the same experiment in HEK 293T cells expressing GFP-FUSP525L. Upon stress induction, also FUSP525L underwent condensation in droplet-like structures, mirroring nHOTAIRM1 behavior. Looking at the interplay between HBC and eGFP signals (Fig. 6A,B; Supplemental Movie S6), we observed the same dynamic depicted between nHOTAIRM1 and G3BP1. Consistently, Manders’ coefficient between nHOTAIRM1 and FUSP525L increased over time (Fig. 6C), whereas Manders’ coefficient between ROMO1 and FUSP525L remained close to 0 and unaffected by NaAsO2 treatment (Supplemental Fig. S5E,G). Statistical analysis supported these observations, as nHOTAIRM1-FUSP525L MOC significantly increases at 60 min compared to time 0, whereas ROMO1-FUSP525L MOC does not; moreover, nHOTAIRM1-FUSP525L MOC is significantly higher than ROMO1-FUSP525L MOC at the end of a stress event (Supplemental Fig. S5I). In parallel, also in this case, we observed an increase in the intersection area between FUSP525L and nHOTAIRM1 channels over time (Fig. 6B, second and fourth row and Fig. 6D). Overall, these measurements confirmed that nHOTAIRM1 is dynamically recruited in physiological SG and in pathological FUSP525L aggregates, adding possible indications of its involvement in ALS progress.
DISCUSSION
In this paper, we report that Pepper (Chen et al. 2019) is an effective tool to investigate the localization and dynamics of ncRNAs in membrane-less organelles related to phase transition and neurodegenerative-linked processes in living cells. In fact, coupling experiments in fixed samples with live imaging assays, we successfully reproduced the localization of exogenous circ-HDGFRP3 and nHOTAIRM1 in multiple biomolecular condensates, including SG, p-bodies, and pathological FUSP525L aggregates in living cells, recapitulating smFISH experiments on their endogenous counterparts in fixed samples.
In particular, we employed Pepper to follow the dynamics of how the lncRNA nHOTAIRM1 undergoes condensation and fusion events as it is recruited in physiological and pathological granules.
Even if the fRNA Pepper proved very straightforward to image linear RNAs, the application to circRNAs was more challenging. Because circRNAs share their whole sequence with their linear counterparts, except for the BSJ, producing overexpression plasmids for circRNA tagging requires careful design to select the optimal insertion sites and to promote efficient circularization instead of linear counterpart production. Nevertheless, we were able to prove the specificity of circ-HDGFRP3 localization to discrete focal foci through the use of RNase R digestion, and we demonstrated its association to p-bodies in physiological conditions as well as its association to FUS aggregates in pathological conditions. These findings provide important hints for determining the function of this circRNA. Indeed, its association with organelles involved in mRNA processing and the fact that circRNAs have been discovered to interact with specific mRNA classes to control their stability and translation (Rossi et al. 2022; Grelloni et al. 2024), suggests a possible role of circ-Hdgfrp3 as a platform for local mRNA control in motor neurons. Notably, we also explored its subcompartmental distribution in FUSP525L aggregates through SIM analysis, providing the first instance of a circRNA being detected with an fRNA compatible with a super-resolution technique in vivo (Bejugam et al. 2020). In fact, to the best of our knowledge, SIM microscopy has not been previously employed for visualizing circRNAs in living samples. Although the new generation of fRNA outperforms the MS2 system and similar ones in terms of brightness, target perturbation, and background, the Pepper methodology still requires high levels of labeled RNA expression and thus often limits the study of RNA dynamics to exogenously expressed molecules. Importantly, new tools have been recently described, such as iPepper and RhoBAST (Sunbul et al. 2021; Wang et al. 2022), which are not only compatible with SIM, but also with more sophisticated single-molecule localization microscopy (SMLM) techniques and provide promises also for the detection of low-abundant endogenous RNAs.
MATERIALS AND METHODS
Plasmid construction
To produce the p-circ plasmids, the described steps were followed: A doxycycline-inducible backbone endowed with flanking ICSs (Kramer et al. 2015; Legnini et al. 2017) for enhanced overexpression of the circRNAs was already present in the laboratory. Starting from this plasmid, the In-Fusion HD Cloning Kit (Takara Bio) was used to replace the sequence for puromycin resistance with the sequence of the Blue Fluorescent Protein (tagBFP), amplified from the Addgene plasmid (55312). The SV40 nuclear localization sequence (CACTTTCCGCTTTTTCTTTGG, Addgene plasmid 39319) was cloned downstream the tagBFP combining inverse PCR and blunt end ligation (T4 Ligase NEB). The sequence of circ-HDGFRP3 (exons 2-3-4-5, 522 bp long) was PCR-amplified from SK-N-BE cells cDNA and cloned between the ICSs using the In-fusion Cloning Kit (Takara Bio). 4xPepper array sequence (196 bp long) was amplified from the pAPU6-MCS-Pepper (PAPU604MCS1 FR Biotechnology) plasmid and cloned within exon 4 (between base 43 and 44) and exon 5 (between base 71 and 72) of the circ-HDGFRP3 sequence by the In-Fusion Cloning Kit (Takara Bio) to obtain the final constructs p-circ-Ex4 and p-circ-Ex5.
The ePB-bsd-Eif1a (PiggyBac transposable vector) plasmid for GFP-G3BP1 expression (Perego et al. 2023) served as a template to generate the constructs for GFP-FUSP525L and GFP-DCP1A expression, using sequential In-Fusion Cloning (Takara Bio) reactions. The same strategy was used to generate epb-bsd-Eif1a plasmids for the overexpression of nHOTAIRM1 and ROMO1 tagged with 4xPepper. CloneAmp HiFi PCR Premix (Clontech) was used for all the PCR amplifications.
Cell maintenance and manipulation
HEK 293T cells stored at −80°C in freezing medium (DMEM high glucose, Sigma-Aldrich, supplemented with 20% FBS, Gibco, and 10% DMSO), were quickly defrosted at 37°C, using a thermostatic bath. After removing the freezing medium by centrifugation (5 min at 1000 rpm), cells were resuspended in the appropriate amount of maintaining medium (DMEM high glucose, Sigma-Aldrich, supplemented with 10% FBS, 2 mM GlutaMAX, Gibco, and 1% Penicillin/Streptomycin, Sigma-Aldrich) and plated for maintenance and amplification. For live imaging experiments, the common DMEM high glucose was replaced with FluoroBrite DMEM (Thermo Fisher Scientific).
To produce HEK 293T cell lines stably expressing GFP-G3BP1, GFP-FUSP525L, and GFP-DCP1A, 2.5 × 10⁵ cells were plated on 6 cm dishes. The next day, cells were transfected with a mix of Optimem (Thermo Fisher Scientific), 5 μg of specific plasmid, 0.5 μg of hybrid transposase plasmid (Yusa et al. 2011), and Lipofectamine 2000 transfection reagent (Invitrogen) with a 1:2.5 DNA:transfection reagent ratio.
Cells were then grown in 10 μg/mL blasticidin (Thermo Fisher Scientific) supplemented medium for 7–10 days to select a successfully transfected pool of cells.
Cell transfection and induction
For live imaging experiments, 5 × 10⁴ HEK 293T cells per well were plated the day before transfection in 8-well Nunc Lab-Tek II Chambered Coverglass, previously coated with Geltrex (Thermo Fisher Scientific) by incubation at 37°C for at least 3 h. Similarly, for expression and circularization efficiency experiments, 2 × 10⁴ HEK 293T cells were plated 2 days before transfection on 12-multiwell plate (Corning) coated with 500 μL of Attachment factor X (Gibco) and incubated for 30 min at room temperature. For nucleus-cytoplasm fractionation experiments, 3.5 × 10⁵ cells were instead plated on a 6 cm dish (Corning), always 2 days before transfection.
In both live imaging and circularization efficiency experiments, cells were transfected using a mix of Optimem (Thermo Fisher Scientific), 1:2 DNA:FuGENE HD transfection reagent (Promega) ratio and 2 μg of specific plasmid, whereas for nucleus-cytoplasm fractionation experiments, the amount of transfected plasmid was 2 μg/mL. In the case of circRNAs overexpression experiments, circRNAs transcription was induced using doxycycline at a final concentration of 2 μg/mL, the day after transfection. Doxycycline induction was maintained for 24 h before cell collection.
RNA extraction, reverse transcription and qPCR analysis
To evaluate overexpression and circularization efficiency, cells were collected, and RNA was extracted using a Direct-zol RNA Miniprep Kit (Zymo Research), following manufacturer instructions 24/48 h after transfection of overexpression constructs. Residual genomic and plasmidic DNA was removed using DNA-free kit (Invitrogen), and 500 ng of RNA was retrotranscribed with PrimeScript RT Master Mix (Takara Bio), following manufacturer instructions. cDNA obtained from retrotranscription was analyzed by qPCR using the PowerUp SYBR Green Master Mix (Thermo Fisher Scientific) reagent coupled with a Quant-Studio 5 (Applied Biosystems) machine. For each reaction, 5 ng of cDNA, 7.5 μL of SYBR Green, 0.5 μL of each primer (330 μM as final concentration), and ddH2O up to 15 μL of total reaction volume were used. Three technical replicates for each selected target were analyzed on a 96-well plate (Applied Biosystems).
For overexpression and circularization efficiency experiments, analysis of qPCR data was conducted as follows: First, the Delta Ct between the target RNA and the reference gene GAPDH was calculated. Those values were then used to calculate the fold change (FC), to obtain the relative expression of the specific RNA isoform compared to a housekeeping gene. The FC of three independent biological replicates was used to calculate the average FC, the standard deviation (SD), and the standard error (SE), shown in the error bars. For neuronal differentiation validation, the Delta Ct between the target RNA and the reference gene ATP5O was calculated. Those values were then used to calculate the FC, to obtain the relative expression of the specific RNA isoform compared to a housekeeping gene. The FC of three independent biological replicates was used to calculate the average FC, the standard deviation (SD), and the standard error (SE), shown in the error bars.
Nucleus-cytoplasm fractionation
Nucleus-cytoplasm fractionation was performed as described in Conrad and Ørom (2017) to evaluate the subcellular localization of the circular and the linear isoforms transcribed from p-circ overexpression constructs. All centrifugation steps were carried out at 4°C and all buffers were ice-cold.
Briefly, HEK 293T cells, previously transfected and induced as indicated above, were detached by adding 0.5 mL of 0.25% Trypsin solution (Gibco) and incubating at 37°C for 5 min. The trypsinization reaction was then inactivated adding 1.5 mL of HEK maintaining media. Cell suspension was transferred into a 15 mL falcon tube, spun for 5 min at 200g in a tabletop centrifuge, and the supernatant was aspirated. A cell pellet was resuspended in 10 mL PBS and spun at 200g for 5 min. The supernatant was removed, cell pellet was resuspended in 1 mL PBS and transferred to a 1.5 mL Eppendorf tube, spun at 200g in a microcentrifuge for 2 min and the supernatant was carefully removed again. Four hundred microliters of Igepal lysis buffer (10 mM Tris pH 7.4, 150 mM NaCl, 0.15% Igepal CA-630) was added to the pellet, gently pipetted up and down 3–5 times to resuspend the cells, and the solution was incubated on ice for 5 min. The cell lysate was gently transferred in a new Eppendorf tube and gently overlaid on top of 1 mL sucrose buffer (10 mM Tris pH 7.4, 150 mM NaCl, 24% sucrose). The solution was centrifuged at 3500g for 10 min and the supernatant, containing the cytoplasmic fraction, was transferred in another tube and cleared again by centrifugation at 14,000g for 1 min. Then, 1/7 of the cytoplasmic fraction was resuspended in TRIzol (Thermo Fisher Scientific). Instead, the pellet obtained after the centrifugation in sucrose buffer, corresponding to the nuclear fraction, was all resuspended in TRIzol. RNA was extracted and, upon removal of residual genomic and plasmidic DNA, RNA concentration was quantified and iso-volumetric quantities (never exceeding 500 ng) from nuclei and cytoplasmic fractions were collected and retrotranscribed. For qPCR analysis, the logarithm to the base of 2 of 7 was subtracted to all the Ct means of the cytoplasmic fractions, to account for the dilution coefficient of the cytoplasmic lysate compared to the nuclear one. Then, the 2−Ct mean was calculated for nuclear and adjusted cytoplasmic fractions, and their sum was used as reference to calculate the relative percentage of transcripts in the specific compartment.
Live imaging of Pepper-tagged RNAs
HEK 293T cells, previously transfected and induced as indicated above, were incubated for 5–30 min in FluoroBrite DMEM medium (Gibco) supplemented with MgSO4 5 mM and HBC620 0.5 μM (FR biotechnology), following manufacturer instructions. For experiments carried out in stress condition, 0.5 mM NaAsO2 (Sigma-Aldrich) was added to the imaging medium and incubated for 1 h after HBC620 treatment to visualize RNAs and proteins during oxidative stress response.
RNase R treatment on live cells
HEK 293T cells cultured and transfected in 8-well Nunc Lab-Tek II Chambered Coverglass (as previously described), were first washed twice in PBS and then permeabilized in Triton X-100 0.05%/DPBS for 5 min (Ganassi et al. 2016). Subsequently, cells were washed again in PBS and incubated with imaging medium (MgSO4 5 mM; HBC620 0.5 mM in FluoroBrite DMEM) for 15 min. Finally, cells were treated with 10 U of RNase R (Biosearch Technologies, RNR07250) per well and imaged for 4 h (Koppula et al. 2022) at a temporal resolution of 10 min/frame.
To evaluate RNase R activity, images were analyzed using Fiji-ImageJ software: Briefly, bleach correction with a Simple Ratio algorithm was applied on HBC620 signal and the polygon selection tool was used to generate ROIs and select HBC620 positive cells. The “Analyze > Measure” function was then used to calculate mean fluorescence intensity at time points corresponding to 0, 120, 180, and 240 min of RNase R treatment. The mean intensities of all the time points were then normalized on the value of the first time point. Samples were compared and tested for statistical significance with a two-tailed unpaired Student's t-test.
For RNA quantification during RNase R treatment, cells were treated in the same conditions and collected in TRIzol at each time point. RNA was extracted and DNase-treated as described above. Five hundred nanograms of RNA at time point 0, and an equal volume of RNA from the other time points for each condition were retrotranscribed with PrimeScript RT Master Mix (Takara Bio) to account for minimal cell death during RNase incubation. The qPCR results are expressed as 2−DCt, where DCt is the difference between each time point Ct and the time point 0 Ct.
Differentiation of mESCs-derived MNs
mESCs were cultured and differentiated into spinal MNs as described in Wichterle and Peljto (2008), Capauto et al. (2018), and D'Ambra et al. (2024). Briefly, cells were maintained in culture with mESC medium, (EmbryoMax DMEM; 15% Embryonic stem-cell FBS, Thermo Fisher Scientific; 1% EmbryoMax 100X nucleosides, Sigma-Aldrich; 1% EmbryoMax nonessential amino acids, Sigma-Aldrich; 2-mercaptoethanol for ES cells, Sigma-Aldrich; 2 mM l-glutamine, Sigma-Aldrich; 1% penicillin-streptomycin, Sigma-Aldrich), supplemented with ESGRO Recombinant Mouse LIF Protein (Chemicon), FGFR inhibitor PD173074 (Sigma-Aldrich P2499), and GSK-3 Inhibitor XVI (Sigma-Aldrich 361559).
For motoneuronal differentiation, embryoid bodies (EBs) were obtained by culturing mESCs in ADNFK medium (1:1), Advanced DMEM/F12 (Gibco):Neurobasal medium (Gibco), 10% Knock Out Serum Replacement (Gibco), 1% GlutaMAX, 1% 2-mercaptoethanol, 1% Pen/Strep. After 2 days, ADNFK medium was supplemented with 2% B27 Supplement (Gibco), 1 μM RA (Sigma-Aldrich) and 0.5 μM SAG (Merck Millipore). On day 5, ADNFK medium was supplemented with 2% B27 Supplement and 5 ng/mL GDNF (PeproTech). On day 6, EBs were dissociated: first, EBs were incubated with 20 U/mL Papain (Worthington Biochemical Corporation), agitated for 5 min by hand, then blocked with 10 mg/mL ovomucoid inhibitor (Worthington Biochemical Corporation) for 5 min. Cells were then left to precipitate by gravity, and supernatant was removed. Single cells were then dissociated by pipetting in PBS supplemented with 0.4% Glucose (Sigma), 2.5% horse serum (Thermo Fisher Scientific), 2% B27, 3 mM MgCl2, Deoxyribonuclease I (Sigma-Aldrich, 25 μg/mL) and plated on 0.01% poly-l-ornithine (Sigma-Aldrich), Laminin 20 μg/mL (Sigma) coated glass coverslips. MNs were maintained in culture with N2B27 medium (50% DMEM/F-12 Ham, 50% Neurobasal Medium, 1% GlutaMAX Supplement, 1% 2-mercaptoethanol, 1% nonessential amino acids, 0.5% penicillin-streptomycin) supplemented with 2% N-2 supplement (Gibco), 1% B-27 supplement serum free (Thermo Fisher Scientific), 200 ng/mL l-ascorbic acid (Sigma-Aldrich), 20 ng/mL BDNF (PeproTech), 10 ng/mL GDNF (PeproTech), 10 ng/mL CNTF (PeproTech) and 10 mM ROCK inhibitor (Y-27632 dihydrochloride; Sigma-Aldrich).
For experiments carried out in stress condition, NaAsO2 at a final concentration of 0.5 mM was added to the neuronal medium and incubated for 1 h.
Differentiation of iPSCs-derived MNs
Human iPSCs were maintained and differentiated in spinal MNs as described in De Santis et al. (2018). Briefly, iPSCs were dissociated to single cells with Accutase (Thermo Fisher Scientific) and plated in Nutristem-XF/FF medium (Biological Industries) supplemented with 10 μM ROCK inhibitor (Enzo Life Sciences) on Matrigel (BD Biosciences) at a density of 100,000 cells/cm2. The day after, differentiation was induced by adding 1 μg/mL doxycycline (Thermo Fisher Scientific) in Nutristem without bFGF and TGFβ (Biological Industries) in order to drive the expression of the NIL (Ngn2-F2A-Isl1-T2A-Lhx3) cassette. After 48 h of doxycycline induction, the medium was changed to Neurobasal/B27 medium (Neurobasal Medium, Thermo Fisher Scientific, supplemented with 1X B27, Thermo Fisher Scientific, 1X Glutamax, Thermo Fisher Scientific, 1X NEAA, Thermo Fisher Scientific, and 0.5X Penicillin/Streptomycin, Sigma-Aldrich), containing 5 μM DAPT and 4 μM SU5402 (both from Sigma-Aldrich). At day 5, cells were dissociated with Accutase (Thermo Fisher Scientific) and plated on Matrigel (BD Biosciences) coated dishes. Ten micromolars of ROCK inhibitor was added for the first 24 h after dissociation. Neuronal cultures were maintained in neuronal medium (Neurobasal/B27 medium supplemented with 20 ng/mL BDNF, 10 ng/mL GDNF, both from PeproTech, and 200 ng/mL l-ascorbic acid, Sigma-Aldrich).
For experiments carried out in stress condition, NaAsO2 at a final concentration of 0.5 mM was added to the neuronal medium and incubated for 1 h.
BaseScope single-molecule fluorescent in situ hybridization (smFISH) of circRNAs coupled with IF
mESCs-derived MNs were plated on precoated 12 mm diameter coverslips and fixed in 4% paraformaldehyde (Electron Microscopy Sciences) for 20 min at 4°C. Dehydration step with ice-cold Ethanol series (50%, 70%, 100%) was performed in order to store cells at −20°C in absolute ethanol until use. Detection of circ-Hdgfrp3 was performed via BaseScope Assays (Advanced Cell Diagnostics, Bio-Techne) as previously described in D'Ambra et al. (2024) with custom produced probes (Advanced Cell Diagnostics, ref. 703021) designed to specifically target its BSJ. Briefly, fixed cells were permeabilized with Protease III (diluted 1:15; ref. 322381) before hybridization with the circ-Hdgfrp3-specific probes (Advanced Cell Diagnostics, Bio-Techne, cat#703021), at 40°C for 2 h. Amplification and detection steps were performed following the manufacturer's instructions using BaseScope detection reagents V2– RED (ref. 323910). After each amplification step, three washes were performed with 300 mL of 1X RNAscope Wash Buffer Reagents (ref. 310091) for 5 min at room temperature.
FISH staining was combined with IF incubating cells for 1 h at room temperature with anti-DCP1A (ab183709) and anti-TIAR (BD Transduction MS BD 610352) primary antibodies used at 1:100 and 1:200 dilution, respectively, in blocking solution (3% BSA and 0.2% Triton X-100 in PBS). After three washes in PBS, cells were labeled with secondary antibodies: Goat anti-Rabbit 647 (Thermo Fisher Scientific cat#A32795) diluted 1:300 in 1% goat serum/1% donkey serum/PBS for 45 min at room temperature. Lastly, the nuclei were counterstained with DAPI solution (1 μg/mL/PBS; Sigma-Aldrich, D9542) for 5 min at room temperature and then the coverslips were mounted using ProLong Diamond Antifade Mountant (Thermo Fisher Scientific, P-36961).
smFISH of lncRNAs coupled with IF
iPSCs-derived MNs were plated on 12 mm diameter coverslips coated with Geltrex (Thermo Fisher Scientific) and fixed in 4% paraformaldehyde (Electron Microscopy Sciences) for 10 min at room temperature. Cells were stored at −20°C in absolute ethanol until used in the dehydration step with ice-cold Ethanol series (50%, 70%, 100%).
nHOTAIRM1 was detected via smFISH with a mix of 18 biotinylated probes (Sigma-Aldrich) as described in Vautrot et al. (2015) and Santini et al. (2021). Briefly, cells were rehydrated by descendent ice-cold ethanol series (100%, 70%, 50%) and permeabilized in 0.05% Triton X-100/2 mM VRC (Sigma-Aldrich, R3380)/DPBS for 5 min. DPBS was replaced with 2X SSC buffer (300 mM NaCl; 30 mM sodium citrate in nuclease-free water) and cells were incubated for 5 min. Finally, samples were incubated in prehybridization buffer (10% deionized formamide, Sigma-Aldrich, 47671; 2X SSC in nuclease-free water) for 15 min at 37°C, followed and by an over night incubation at 37°C in a slide hybridizer machine (ACD HybEZ II Hybridization System) with hybridization buffer (10% deionized formamide; 2X SSC; 10% w/v Dextran sulfate, Sigma-Aldrich, D8906, 2 mM vanadyl ribonucleoside complexes (VRC), Sigma-Aldrich, R3380, in nuclease-free water) and completed with the biotinylated probes at a final concentration of 50 nM each. The next day, cells were washed twice with 2X SSC for 5 min first at 37°C and then at RT. SSC buffer was then replaced with TN buffer (Tris HCl pH 7.5 10 mM; NaCl 5 mM in nuclease-free water), incubated at RT for 10 min. Lastly, biotinylated oligos were stained with 1:200 diluted Alexa Fluor 568-conjugated streptavidin (Invitrogen S11226) incubated in 4% w/v BSA (Sigma-Aldrich, A2153)/TN buffer for 1–2 h at room temperature in a humid box.
When FISH was combined with IF, cells were washed twice with TN buffer and once with DPBS and then incubated with primary antibodies (anti-FUS, Bioss Antibodies bs-2980R, anti-FUS, Santa Cruz sc-47711, anti-G3BP1, Sigma GW22382A, anti-G3BP1, Sigma PLA0231, anti-TIAR, BD Transduction MS BD 610352, anti-DCP1A, ab183709) diluted in 1% w/v BSA/DPBS for 1 h at room temperature. Then, upon three washes in DPBS, cells were incubated with 1:300 diluted secondary antibodies (Goat anti-Mouse Alexa Fluor 488, Invitrogen A-11029; Goat anti-rabbit Alexa Fluor 488, Invitrogen A-11008; Goat anti-Chicken Alexa Fluor Plus 488, Invitrogen A32931, Donkey anti-mouse Alexa Fluor 647, Invitrogen A-31571) in 1% w/v BSA/DPBS for 45 min at room temperature. Cells were then washed three times with DPBS, nuclei were counterstained with DAPI solution (Sigma, D9542; 1 μg/mL/PBS) for 5 min at room temperature and coverslips were mounted with ProLong Diamond Mounting Media (Thermo Fisher Scientific, P-36961).
Image acquisition and processing
Fixed mESC-derived MNs were imaged with a confocal Olympus IX73 microscope equipped with a CrestOptics X-LIGHT V3 spinning disk system and a Prime BSI Express Scientific CMOS camera, using UPlanSApo 100× (NA 1.45) oil objective, and collected with MetaMorph software (Molecular Devices). The Z-stack confocal microscopy images were taken automatically (200 nm Z-spacing).
Fixed iPSCs-derived MNs were imaged on a Nikon Instrument A1 Confocal Laser Microscope equipped with a 1.49 NA 100× objective (Plan Apo VC 100× Oil DIC N2, Nikon). Confocal images were collected with NIS-Elements AR software (Nikon): ND Acquisition module was used for multipoint acquisition of Z-stack images (150–175 nm Z-spacing) of 4 μm thickness.
All live imaging experiments were performed using an Eclipse Ti2-E Inverted Microscope equipped with the Nikon Super Resolution System (N-STORM & N-SIM), with a 1.49 NA 100× objective (Apo TIRF 100× Oil, Nikon) and with a 3D EX V-R 100×/1.49 grating block. Cells were kept at 37°C and with 5% CO2 supply with a live imaging control system (Tokai Hit, INU) for the experiment duration. Widefield and SIM images were collected with NIS-Elements AR software (Nikon): ND acquisition module was used for multipoint and time-lapse images collection. Specifically, time lapses with a duration of 10–15 min and “no delay” (∼11 sec) interval were collected for higher temporal resolution acquisitions, and time lapses with a duration of 1 h and 1–5 min interval, depending on the number of selected multipoints, were collected for acquisitions upon NaAsO2 treatment. To reconstruct SIM acquisitions, the three reconstruction parameters illumination modulation contrast, high-resolution noise suppression and out of focus blur suppression were adopted to generate consistent Fourier transform. Images with a reconstruction score of 8 were selected for substructural analysis.
Occasionally, the Denoise.ai and the Clarify.ai deconvolution algorithms available on NIS-Elements AR software (Nikon), were used to postprocess Widefield time-lapse acquisitions for representative images. A DoG filter and the “subtract background” function of Fiji-Image J with rolling ball radius of five pixels (Sternberg 1983) were used to process FISH and tracking representative images, whereas RNase R assay representative images were presented without any manipulation.
Fluorescence intensity measurements
To calculate fluorescence turn-on of HBC dye upon binding to Pepper, images of HEK 293T cells transfected with overexpression plasmids for Pepper-tagged RNAs and treated with HBC, or cells treated with HBC only, were collected on a Nikon Instrument A1 Confocal Laser Microscope equipped with a 20× objective (Plan Apo Lambda 20×, Nikon). Outlines of single cells were segmented thanks to the “Voronoi” function on Fiji-ImageJ based on the DAPI signal, then fluorescence intensity of single cells was measured with the “Measure” function on Fiji-ImageJ.
Colocalization analysis and particles measurements on fixed samples
Fiji-ImageJ open source software was used for analysis on confocal images of immunofluorescence and FISH experiments.
For DCP1A/circ-Hdgfrp3 colocalization in mESC-derived MNs, all images were analyzed as previously described in D'Ambra et al. (2021). Briefly, Z-stacks were processed with Laplacian of Gaussian filter (Sage et al. 2005; Ballarino et al. 2018), and intensity threshold, contrast and brightness were adjusted using the ImageJ software. The coplanarity evaluation of the signals was performed combining the fluorescence distributions of each channel, recorded in the main grayscale value (expressed as arbitrary units) along Z-planes obtained from the ImageJ Plot Z-axis profile plugin, and the count of colocalizing signals was performed manually.
For object-based colocalization analysis between the lncRNA nHOTAIRM1, G3BP1, and FUSP525L, and between endogenous DCP1A and exogenous GFP-DCP1A, Moment's algorithm was exploited (Tsai 1985) to create binary masks for FISH and IF channels. Otsu thresholding algorithm (Otsu 1979) was used to create nuclei binary masks starting from DAPI signal. The Image Calculator command was then used to subtract nuclei masks to nHOTAIRM1, G3BP1, FUSP525L, and DCP1A channels in order to account only for the cytoplasmic signal. To detect colocalizing particles in the cytoplasm, the Image Calculator “AND” function was then applied to create secondary masks resulting from the intersection of the pixels between: nHOTAIRM1 and G3BP1; nHOTAIRM1 and FUSP525L; nHOTAIRM1, G3BP1 and FUSP525L; FUSP525L and G3BP1 or between endogenous DCP1A and exogenous GFP-DCP1A. “Analyze particles” function was used to count number of total particles and number of particles in the intersection masks; thus percentages of colocalization were obtained as a ratio between particles in the intersection mask/total number of particles.
For pixel-wise colocalization between nHOTAIRM1 and DCP1A, nHOTAIRM1 and TIAR and TIAR and DCP1A, a median filter radius = 2 was applied, and the Plug-in JACoP of Fiji-ImageJ was used to calculate PCC between the corresponding channels (Bolte and Cordelieres 2006). A PCC ranging from −1 to 0 was considered as “anti-correlation”; a PPC ranging from 0 to 0.1 was described as “poor correlation”; a PPC > 0.1 was described as “correlation.”
Single-particle tracking and substructural distribution of Pepper-tagged RNAs and GFP-tagged proteins in live cells
TrackMate plug-in on Fiji-ImageJ was used for single-particle tracking of Pepper-tagged RNAs interacting with G3BP1-, FUSP525L-, or GFP-DCP1A (Tinevez et al. 2017; Ershov et al. 2022). Representative ROIs were selected from time-lapse acquisition with a duration of 10–15 min and “no delay” (∼11 sec) interval, collected with widefield microscopy. DoG Detector algorithm was selected and an “estimated object diameter” of 1 μm was chosen to filter for the objects to track, whereas “Quality threshold” was determined case by case. Linear assignment problem (LAP) tracking algorithm (Jaqaman et al. 2008) was then exploited with the following configuration options:
-
Frame to frame linking: 1 μm;
-
Gap-closing max distance: 1 μm;
-
Max frame gap: 3;
-
Max distance for track segment splitting: 1 μm;
-
Max distance for track segment merging: 1 μm.
Finally, “track tables” recording single spots IDs and xy-coordinates frame-by-frame were extrapolated and used to generate 3D scatter plots with the Origin Lab software. In particular, the x-axis was assigned to x-coordinates, the y-axis was assigned to time position, and the z-axis was assigned to y-coordinates.
To determine the substructural distribution of circ-HDGFRP3 in FUSP525L aggregates, profiles of the signal distribution were generated along an arbitrary line with the function “Analyze > Plot Profile” of the Fiji-ImageJ menu. The axial resolution of representative SIM images was estimated thanks to the Image Decorrelation Analysis plugin on Fiji-ImageJ (Descloux et al. 2019).
Pixel-wise and object-based colocalization analysis in live samples
To evaluate the association throughout time between the RNAs and the GFP-tagged proteins upon oxidative stress induction, a pixel-wise colocalization approach was chosen. A custom ImageJ macro was used to calculate Pearson's and Manders’ coefficient between the RNA (HBC620) and the protein (eGFP) signals frame-by-frame, from time lapses of 1 h duration and 1–5 min intervals. Briefly, bleach correction with a Simple Ratio algorithm was applied on both HBC620 and GFP channels, then a DoG filter was applied to both channels generating a noise-reduced image (Gaussian blur σ = 2) and a background image (Gaussian blur σ = 10) and subtracting the two with the Image Calculator “Subtract” function. A ROI was then selected to analyze only cells in the field of view double positive for HBC620 and eGFP signals, and the Plug-in JACoP of Fiji-ImageJ was used to calculate colocalization coefficients on each frame (Bolte and Cordelieres 2006). To account for the increase in fluorescence intensity as the G3BP1 and FUSP525L proteins condensate upon stress, thresholder Manders’ Coefficient (Manders’ M2 Coefficient; fraction of HBC overlapping GFP) was evaluated when analyzing nHOTAIRM1/G3BP1, nHOTAIRM1/FUSP525L, ROMO1/G3BP1, or ROMO1/FUSP525L time-lapses (Manders et al. 1993). Threshold values for both channels were determined for each acquisition, depending on the fluorescence intensity.
Conversely, to analyze the association between FUSP525L and aggregates and Pepper-tagged circ-HDGFRP3, an object-based approach was chosen. Briefly, bleach correction with a Simple Ratio algorithm was applied on both HBC620 and GFP channels; then a LoG filter was applied to both channels taking advantage of the LoG 3D plug-in on ImageJ (Sage et al. 2005; Ballarino et al. 2018). Intermodes thresholding algorithm (Prewitt and Mendelsohn 2006) was then exploited to create binary masks of HBC620 and GFP channels, and the Image Calculator “AND” function was applied to create secondary masks resulting from the intersection of the pixels between the two masks. “Analyze particles” function was used to count the number of total RNA and FUSP525L particles and number of particles in the intersection masks in each time frame, thus the fraction of colocalizing particles was obtained as a ratio between number of particles in the intersection mask/total number of RNA (HBC620) particles per time interval. For intersection area measurements between G3BP1 and nHOTAIRM1 or between FUSP525L and nHOTAIRM1 upon NaAsO2 treatment, the same procedure was applied, taking advantage of a DoG filter and the Otsu thresholding algorithm. The “Analyze particles” function was again used to measure the area of the intersection mask in each time frame.
SUPPLEMENTAL MATERIAL
Supplemental material is available for this article.
ACKNOWLEDGMENTS
We thank Professor Alberto Diaspro and Dr. Paolo Bianchini (Nanoscopy & NIC@IIT, Istituto Italiano di Tecnologia), Dr. Michele Oneto (Nikon Imaging Center), and Marco Scotto (Molecular Microscopy and Spectroscopy, Istituto Italiano di Tecnologia) for experimental support in confocal and SIM microscopy. We are also grateful to Dr. Giuseppe Vicidomini, Dr. Eleonora Perego, and Sabrina Zappone (Molecular Microscopy and Spectroscopy, Istituto Italiano di Tecnologia) for useful discussions and suggestions. The authors would also like to thank the “RNA Technologies” Flagship at IIT. This work was supported by grants from the European Research Council (ERC-2019-SyG 855923-ASTRA) and from the Italian Association for Cancer Research (AIRC IG 2019, Id. 23053) to I.B.; from PRIN 2017 (id. 2017P352Z4) and from the EU within the MUR PNRR “National Center for Gene Therapy and Drugs based on RNA Technology” (project no. CN00000041 CN3, Spoke #3 “Neurodegeneration” and Spoke #6 “RNA Drug Development”) to I.B. and P.L.; from PRIN 2022 (id. 2022BYB33L) and Consiglio Nazionale delle Ricerche-CNR (projects DBA.AD005.225-NUTRAGE-FOE2021 and DSB.AD006.371-InvAt-FOE2022) to P.L.; and from the European Innovation Council (EIC) through its Pathfinder Open Programme, project ivBM-4PAP (id. 101098989), together with intramural IIT fundings to G.R.
Author contributions: I.B. conceptualized the project. I.B., D.M., E.C., and P.L. supervised and coordinated the experiments. I.B., G.R., and P.L. provided founding. E.V. and F.C. performed live imaging experiments. E.V., F.C., L.S.M., D.M., and P.T. performed cloning and molecular biology assays. F.C. and P.T. cultured and differentiated iPSCs. E.D.A. cultured and differentiated mESCs. E.V. and E.D.A. performed and analyzed FISH and IF experiments. E.V. analyzed live imaging experiments. I.B. and E.V. wrote the original manuscript with contribution of all the authors.
Footnotes
-
↵5 Joint first authors
-
Article is online at http://www.rnajournal.org/cgi/doi/10.1261/rna.080119.124.
-
Freely available online through the RNA Open Access option.
- Received June 3, 2024.
- Accepted December 14, 2024.
This article, published in RNA, is available under a Creative Commons License (Attribution-NonCommercial 4.0 International), as described at http://creativecommons.org/licenses/by-nc/4.0/.
REFERENCES
MEET THE FIRST AUTHORS


Meet the First Author(s) is an editorial feature within RNA, in which the first author(s) of research-based papers in each issue have the opportunity to introduce themselves and their work to readers of RNA and the RNA research community. Erika Vitiello and Francesco Castagnetti are co-first authors of this paper, “Live-cell imaging of circular and long noncoding RNAs associated with FUS pathological aggregates by Pepper fluorescent RNA.” Erika and Francesco are, respectively, a former PhD student and a postdoc in the group of Professor Irene Bozzoni at the Italian Institute of Technology in Genova, Italy. They both conducted their research focusing on the study of noncoding RNA in physiology and pathology.
What are the major results described in your paper and how do they impact this branch of the field?
In our project, we wanted to visualize noncoding RNAs, and in particular circRNAs, in living cells. When focusing on an imaging project, every measurement needs interpretation and doing live imaging adds complexity to the experiment setup, as the system becomes dynamic. Because live imaging of circRNAs had never been reported before, we focused on reproducing the behavior of a circRNA and a lncRNA in already described biological contexts or in processes that we could also monitor with orthogonal techniques. With our experiments, we proved that it is possible to tag ncRNAs, and most surprisingly circRNAs, with fluorescence RNA aptamers, also enabling their visualization in super resolution. We hope that this paper will pioneer the use of fRNAs as a standard technique for the study of the localization and dynamics of such interesting molecules.
What led you to study RNA or this aspect of RNA science?
EV: When I started my Master's degree, I was immediately fascinated by noncoding RNAs and by their ability to regulate gene expression at many different levels. As I approached my Master's thesis, I was proposed a project based on imaging of noncoding RNAs. At the beginning, I was reluctant as I had never been curious about microscopy, but soon, I became passionate about image acquisition and analysis, and I ended up focusing my whole PhD on the study of ncRNAs with sophisticated and innovative imaging techniques.
FC: The first time that I gained interest in RNA was while studying splicing factors of Dystrophin during my PhD project. I was particularly interested in how RNA can be adapted to serve as therapeutic molecules in Duchenne muscular dystrophy. During my career, I discovered many other uses of RNA molecules, and how they can be adapted for many different research purposes; last of them, the fRNA aptamers, which can be used as a fluorescent tag to monitor single molecules of RNA in live cells.
What are some of the landmark moments that provoked your interest in science or your development as a scientist?
EV: In high school, following my science teacher's suggestion, I got the opportunity to join a summer school in Biology at the Fondazione Golinelli in Bologna, Italy. In that occasion, I was surrounded by many talented supervisors and fellow students who shared my interest in the field, and I was able to follow a short project from the experimental procedure to the production of a scientific poster. During those weeks, I understood what the researcher's work consists of outside of the textbooks and I felt that I wanted to follow this path for my future career.
FC: During the first month of my Master's thesis internship, I was paired with a PhD student, Elisabetta, who was extremely optimistic and enthusiastic. Even though I was a beginner, she granted me a lot of autonomy and during an experiment I happened to observe an unexpected event, a case of serendipity. At that moment, I had the awareness of being the first person to observe that particular behavior, and it was an exciting feeling, the chance to be a modern pioneer.
What are your subsequent near- or long-term career plans?
EV: After obtaining my PhD, I started looking for a postdoc position to pursue my interest in RNA imaging. Soon enough, I found a position in the laboratory of Professor Jäschke at the University of Heidelberg, where I will be able to carry on a new project involving fluorescent light-up aptamers.
FC: After the end of my postdoc at the Italian Institute of Technology, I decided to take a sabbatical to take care of my newborn son. I am currently negotiating for a postdoc position at the University of Heidelberg, and I hope to be able to find independence in the near future.
What were the strongest aspects of your collaboration as co-first authors?
Collaborating on this project gave us the opportunity to transfer on the bench the partnership that we already have in life. The strongest aspect of our collaboration was the possibility to have an active confrontation and being able to share our ideas in every moment of the daylight. Being aware of each other's strengths and flaws made our job a lot easier and faster, knowing that we could always count on the other's support when the experiments did not go in the expected direction.




