


DNAJA2 and Hero11 mediate similar conformational extension and aggregation suppression of TDP-43
- 1Institute for Quantitative Biosciences, The University of Tokyo, Bunkyo-ku, Tokyo 113-0032, Japan
- 2Department of Computational Biology and Medical Sciences, Graduate School of Frontier Sciences, The University of Tokyo, Bunkyo-ku, Tokyo 113-0032, Japan
- 3Institute of Industrial Science, the University of Tokyo, Meguro-ku, Tokyo 153-8505, Japan
- 4School of Life Science and Technology, ShanghaiTech University, Shanghai 201210, People's Republic of China
- Corresponding author: tomari{at}iqb.u-tokyo.ac.jp
-
Handling editor: Erik Sontheimer
Abstract
Many RNA-binding proteins (RBPs) contain low-complexity domains (LCDs) with prion-like compositions. These long intrinsically disordered regions regulate their solubility, contributing to their physiological roles in RNA processing and organization. However, this also makes these RBPs prone to pathological misfolding and aggregation that are characteristic of neurodegenerative diseases. For example, TAR DNA-binding protein 43 (TDP-43) forms pathological aggregates associated with amyotrophic lateral sclerosis (ALS) and frontotemporal lobar degeneration (FTLD). While molecular chaperones are well-known suppressors of these aberrant events, we recently reported that highly disordered, hydrophilic, and charged heat-resistant obscure (Hero) proteins may have similar effects. Specifically, Hero proteins can maintain the activity of other proteins from denaturing conditions in vitro, while their overexpression can suppress cellular aggregation and toxicity associated with aggregation-prone proteins. However, it is unclear how these protective effects are achieved. Here, we used single-molecule FRET to monitor the conformations of the aggregation-prone prion-like LCD of TDP-43. While we observed high conformational heterogeneity in wild-type LCD, the ALS-associated mutation A315T promoted collapsed conformations. In contrast, an Hsp40 chaperone, DNAJA2, and a Hero protein, Hero11, stabilized extended states of the LCD, consistent with their ability to suppress the aggregation of TDP-43. Our results link single-molecule effects on conformation to macro effects on bulk aggregation, where a Hero protein, like a chaperone, can maintain the conformational integrity of a client protein to prevent its aggregation.
Keywords
- intrinsically disordered protein
- Hero protein
- chaperone
- single-molecule FRET
- TAR DNA-binding protein 43
INTRODUCTION
Most protein functions are defined by their native state, usually consisting of well-folded tertiary structures. However, intrinsically disordered proteins (IDPs) do not follow this principle. Particularly when isolated, IDPs exhibit a high degree of conformational flexibility, adopting a range of loosely defined structures owing to the high hydrophilicity of their amino acid compositions and the absence of a hydrophobic “core” necessary for stabilizing tertiary structures. This flexibility enables cooperative, multivalent interactions with various binding partners in different contexts. Consequently, IDPs play diverse biological roles, including gene regulation, signal transduction, trafficking, and assembly (Dunker et al. 2008; van der Lee et al. 2014).
Despite these important functions, several IDPs have become the focus of intense study because of their aberrant behavior in neurodegenerative diseases. For example, many RNA-binding proteins (RBPs) contain long intrinsically disordered regions characterized by depleted amino acid variety and similarity to yeast prion sequences (King et al. 2012; March et al. 2016; Harrison and Shorter 2017). These sequences enable RBPs to undergo self-assembly that regulates their functions but are highly prone to inappropriately misfold and aggregate (King et al. 2012; March et al. 2016; Harrison and Shorter 2017). This is exemplified by transactive response DNA-binding protein 43 (TDP-43), a highly abundant and essential RBP that functions in various manners of RNA processing, including mRNA transcription, splicing, transport and translation, and the processing of microRNAs and long noncoding RNAs (Ling et al. 2010, 2013; Prasad et al. 2019). TDP-43 is predominantly localized to the nucleus but can move into the cytoplasm upon cellular stress, including oxidative, osmotic, heat, proteasome, and endoplasmic reticulum (ER) stresses, where it not only regulates but also forms stress granules (Aulas et al. 2012; Dewey et al. 2012). During prolonged stress, TDP-43 even forms aberrant aggregates in the cytosol (McGurk et al. 2018; Gasset-Rosa et al. 2019; Mann et al. 2019; Streit et al. 2022). These aggregates are known as pathological hallmarks of amyotrophic lateral sclerosis (ALS) and frontotemporal lobar degeneration (FTLD), where they appear in ∼97% of cases and in ∼43% of cases, respectively (Arai et al. 2006; Neumann et al. 2006; Ling et al. 2013). In these cases, the ∼141 amino acid intrinsically disordered prion-like C-terminal region of TDP-43, called the low-complexity domain (LCD), forms the tightly packed stabilizing cores of these aggregates (Guenther et al. 2018; Cao et al. 2019; Li et al. 2021; Arseni et al. 2022).
To counteract the disasters caused by protein aggregates, cells have developed mechanisms to suppress misfolding; for example, molecular chaperones that mainly assist in the proper folding of proteins during or after translation (Balchin et al. 2016). Chaperones usually work in an ATP-dependent manner, promoting the proper folding of unfolded client proteins or the disassembly of already aggregated proteins, for example, the Hsp70/40/90 and the Hsp70/40/110 systems, respectively (Nillegoda et al. 2015; Balchin et al. 2016; Rosenzweig et al. 2019). Additionally, chaperones can also work in an ATP-independent manner by binding to unfolded client proteins to prevent their aggregation. Examples of this are Hsp40s, also known as DnaJ or J-domain proteins, which bind and stabilize unfolded client proteins until they are handed off to Hsp70 (Rosenzweig et al. 2019; de Graff et al. 2020; Mitra et al. 2022). In both ATP-dependent and ATP-independent cases, chaperones bind the folding intermediates of their client proteins through mainly hydrophobic interfaces on the tertiary structure of the chaperones (Karagöz et al. 2014; Jiang et al. 2019; Wang et al. 2022). Chaperones collaborate with each other and other processes, such as degradation pathways, to form an integral part of the protein quality control network (Balchin et al. 2016; Rosenzweig et al. 2019).
In contrast to structure-based conventional chaperones, studies of late-embryogenesis abundant (LEA) proteins in plants, cytoplasmic-abundant heat-soluble (CAHS) proteins in tardigrades, and other hydrophilic IDPs suggest that they may also have chaperone-like activities (Kovacs et al. 2008a, 2008b; Chakrabortee et al. 2010; Yamaguchi et al. 2012; Cuevas-Velazquez et al. 2014; van der Lee et al. 2014; Janis et al. 2018; Huang et al. 2021; Yakubu and Morano 2021; Ren et al. 2022; Kasianchuk et al. 2023). Additionally, we previously reported that heat-resistant obscure (Hero) proteins, which are abundant in the boiled supernatant of human and fly cell lysates, can stabilize the activity of client proteins from denaturing conditions in vitro and prevent pathological protein aggregation in cells, suggestive of their potential in biotechnology and therapeutics (Tsuboyama et al. 2020; Morimoto et al. 2022). Moreover, overexpression of some Hero proteins can extend the life span of Drosophila by >30% (Tsuboyama et al. 2020). However, Hero proteins appear vastly different from structured chaperones in that they are highly hydrophilic, electrostatically charged, and intrinsically disordered. Remarkably, Hero protein activity seems to rely on their biophysical properties as highly charged and sufficiently long polymers, rather than specific sequence-encoded structure (Tsuboyama et al. 2020). In light of these obvious structural differences and unique biophysical properties compared to canonical chaperones, it is important to investigate the mechanism of how these IDPs suppress aggregation.
Given the importance of misfolding and aggregation in neurodegenerative diseases, strategies to suppress these pathological behaviors have a high potential for the development of therapeutics. Just like chaperones, the overexpression of Hero proteins can suppress TDP-43 aggregation, but it remains unknown whether such IDPs can elicit effects similar to structured chaperone proteins. Here we address this by comparing the effects of exogenously expressed Hero proteins and chaperones on TDP-43. We report unexpectedly similar effects of a Hero protein, Hero11, and an Hsp40 family chaperone, DNAJA2, on the conformational dynamics and aggregation of TDP-43. Using genetic code expansion in HEK293T cells, we synthesized dye-labeled full-length TDP-43 for monitoring its LCD via total internal reflection fluorescence (TIRF) single-molecule fluorescence energy transfer (smFRET). While we observed high heterogeneity in the conformation of the wild-type (WT) LCD, the disease-associated aggregation-enhancing A315T mutation promoted collapsed conformations. In contrast, both DNAJA2 and Hero11 stabilized extended conformations, while the chargeless Hero11 mutant did not, mirroring their effects on aggregation. This suggests that Hero11, despite lacking clear structural features like conventional Hsp40, can still stabilize extended conformations resulting in a similar effect.
RESULTS
DNAJA2 and Hero11 suppress TDP-43 aggregation in HEK293T cells
To understand how Hero proteins act upon aggregation, we first sought to identify a well-established chaperone protein for reference. Since we do not expect Hero proteins to use ATP for this activity, we reasoned that the ATP-independent chaperoning ability of Hsp40 proteins would be a suitable reference for studying Hero proteins. Thus, we first performed cell-based aggregation assays to identify an effective Hsp40 chaperone for the aggregation of TDP-43 (Tsuboyama et al. 2020). As in the previous study, we used GFP-tagged TDP-43 lacking its nuclear localization signal (GFP-TDP43ΔNLS WT) to increase cytoplasmic mislocalization and aggregation (Ayala et al. 2008; Winton et al. 2008). GFP-TDP43ΔNLS was co-transfected with Hero proteins, Hsp40 proteins, or GST (glutathione S-transferase) control into HEK293T cells, and aggregation was assessed by the filter trap method (Fig. 1A). In agreement with our previous results, an 11 kDa highly positively charged Hero protein, Hero11 (also known as the L10K protein or C19orf53), strongly suppressed TDP-43 aggregation, while the KR→G charge mutant, in which all 21 lysine and six arginine residues were mutated to neutral glycine, failed to prevent aggregation (Fig. 1B−D), suggesting the importance of the net charge for this anti-aggregation activity, as shown previously (Tsuboyama et al. 2020). Of the tested Hsp40s, DNAJB8 and DNAJC8 did not appear to reproducibly suppress aggregation in the three experimental replicates, and notably DNAJB8 suppresses aggregation signals in microscope images but not in the filter trap assay. This reduction of GFP signal in microscope images may be attributable to denaturation of GFP or quenching of its fluorophore, which does not affect the size- and antibody-based filter trap assay. However, DNAJA2 most effectively and reproducibly suppressed the aggregation of co-transfected GFP-TDP43ΔNLS relative to the GST control in both microscope and filter trap assay (Fig. 1B−D). Given that DNAJA2 was recently demonstrated to selectively bind to and reduce the phase separation of TDP-43 LCDs (Carrasco et al. 2023), our results support DNAJA2 as a representative suppressor of TDP-43 aggregation. Thus, we chose DNAJA2 for further analysis alongside Hero11.
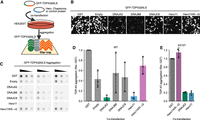
DNAJA2 and Hero11 suppress the aggregation of TDP-43 in HEK293T cells. (A) Schematic of the HEK293T cell-based filter trap assay for TDP-43 aggregation. Plasmids for GFP-TDP43ΔNLS and the protein indicated in (B) were cotransfected into HEK293T cells and incubated for 48 h. The cells were subsequently lysed and filtered through a 0.2 μm filter membrane under vacuum, on which aggregated proteins become trapped for detection via immunoblotting for GFP. (B) Representative microscope images of GFP-TDP43ΔNLS signals in HEK293T cells cotransfected with the indicated chaperones, Hero proteins or control at 20× optical magnification. Empty refers to the pCAGEN plasmid without any insert protein. (C) Immunoblots for aggregated GFP-TDP43ΔNLS in HEK293T cells detected with α-GFP antibody. For each filter trap membrane (from three independent experiments), each sample was loaded three times at twofold serial dilution. (D) Quantification of GFP-TDP43ΔNLS WT aggregation density in C. For each membrane, values are normalized to the aggregation in the GST cotransfection. Bar plots represent the mean and standard deviation as the bar height and error bar, respectively. Dots represent the values of individual experiments. (E) Quantification of GFP-TDP43ΔNLS A315T aggregation density normalized to aggregation in GST cotransfection for each membrane (from three independent experiments). Bar plots represent the mean and standard deviation as the bar height and error bars, respectively. Dots represent the values of individual experiments.
Many disease-associated mutations of TDP-43 have been found in the LCD, for example, A315T, which stabilizes amyloid fibrils (Guenther et al. 2018; Cao et al. 2019) and promotes its aggregation and toxicity (Guo et al. 2011). Thus, we next introduced the A315T mutant into GFP-TDP43ΔNLS (GFP-TDP43ΔNLS A315T) and co-transfected it with Hero11 or DNAJA2. Similar to the WT GFP-TDP43ΔNLS, DNAJA2 and Hero11, but not Hero11KR→G, suppressed the aggregation of A315T (Fig. 1E), suggesting that both of these proteins are effective suppressors of the pathogenic A315T mutant.
We next performed detailed microscopy analysis to investigate how Hero and DNAJA2 affect the morphology and dynamics of GFP-TDP-43ΔNLS aggregates in HEK293T cells. While large, irregularly shaped puncta of GFP-TDP43ΔNLS appeared in the cytoplasm of cells co-transfected with GST or Hero11KR→G, these puncta were absent in the DNAJA2 and Hero11 cotransfections, which instead contained diffuse cytoplasmic signals (Fig. 2A). To quantify this difference, we used an automated macro script to identify puncta signals from microscope images, from which puncta counts and areas were measured. Our image analysis pipeline revealed that cells co-transfected with GST and Hero11KR→G contained ∼10 μm2 of total puncta signal area on average, but DNAJA2 and Hero11 co-transfections reduced this area to ∼0.3 and ∼0.8 μm2, respectively (Fig. 2B).
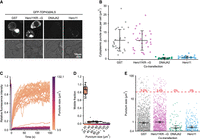
DNAJA2 and Hero11 suppress large immobile aggregates of TDP-43. (A) Representative microscope images of GFP-TDP43ΔNLS signals in HEK293T cells. Cells were cotransfected with plasmids for GFP-TDP43ΔNLS and the indicated proteins, and after 48 h imaged at 100× optical magnification. (Top row) GFP-TDP43ΔNLS signals. (Bottom row) Brightfield image. (B) Total area (µm²) of GFP-TDP43ΔNLS puncta in the cytoplasm per cell. For each image, total puncta area was measured and normalized by dividing over the number of cells. Each dot represents one image. The error bars represent the means and standard deviations calculated from the 30 images per cotransfection condition. (C) FRAP recovery curves of GFP-TDP43ΔNLS puncta. Cells were cotransfected with plasmids for GFP-TDP43ΔNLS and GST, and after 48 h FRAP was performed via bleaching of an area in the middle of each punctum. Each trace represents the recovery curve for a punctum from −5 sec prebleach to 150 sec postbleach (where the area within the punctum was bleached at 0 sec) and colored according to puncta size. (D) Punctum internal mobility binned according to punctum size. The mobile fractions were extracted from the fits of the exponential recovery functions to the FRAP recovery curves for each punctum. Each dot represents a punctum. Boxplots represent the median and interquartile range, and whiskers represent the 1.5× interquartile range. (E) Cytoplasmic punctum sizes in each of the cotransfections. Each dot represents a punctum. Error lines represent the median and 95% confidence intervals, chosen due to the asymmetrical distribution, calculated from all puncta of a cotransfection. The dotted line indicates 20 µm², and the red text indicates the percentage of aggregates in each cotransfection above this line. There are 1156, 1107, 79, and 281 puncta for the GST, Hero11KR→G, DNAJA2, and Hero11 cotransfections, respectively.
To understand the biophysical properties of these puncta, we performed fluorescence recovery after photobleaching (FRAP) of GFP-TDP-43ΔNLS bodies in the GST control. Under our experimental conditions, we observed a discontinuous relationship between the size of the puncta and internal mobility, where small puncta with areas <20 µm² tended to have recoveries >0.8, while larger bodies with areas ≥20 µm² had <0.1 recovery (Fig. 2C,D). This suggests that while smaller puncta tend to be highly fluid, bodies larger than 20 µm² are practically immobile. To understand how DNAJA2 and Hero11 reduce these puncta, we also quantified the sizes of individual puncta in the images (Fig. 2E). The sizes were unevenly distributed in all co-transfections, consisting of ∼50%–75% small areas ≤1 µm², for all four conditions we tested here. However, in the GST and Hero11KR→G co-transfections, puncta tended to be larger and more numerous compared to those in DNAJA2 and Hero11. Notably, while ∼3% of the puncta in the GST (35 out of 1156) and Hero11KR→G (38 out of 1107) co-transfections were larger than 20 µm², we observed no puncta above this size threshold out of 79 and 281 total puncta in the DNAJA2 and Hero11 transfections, respectively (Fig. 2E). Taken together, these findings suggest that both Hero11 and DNAJA2 efficiently suppress the transition of small liquid-like TDP-43 bodies into larger solid cytoplasmic aggregates, which may be toxic and cause disease (Maharana et al. 2018; Gasset-Rosa et al. 2019).
The TDP-43 LCD takes on heterogenous and compact conformations
Given the importance of the intrinsically disordered LCD for TDP-43 aggregation (Cao et al. 2019; Li et al. 2021; Arseni et al. 2022), we next sought to observe the conformational behavior of this region at the single-molecule level. TIRF-based smFRET is a powerful tool for isolating and collecting long-range conformational data of individual IDPs that are difficult to obtain by other methods (Borgia et al. 2018; Meng et al. 2018; Metskas and Rhoades 2020), resolving heterogeneity between molecules. Using genetic code expansion in HEK293T cells, we synthesized full-length TDP-43 with the unnatural amino acid endo-BCN-L-lysine (endoBCN-K) incorporated around the LCD via the mutation of R268 six amino acids before and in a linker six amino acids after the LCD (Supplemental Fig. S1). We then performed site-specific dye labeling at these two positions with tetrazine-coupled fluorescent dyes Cy3 (donor) and ATTO647N (acceptor) (Nikić et al. 2015, 2016; Tsuboyama et al. 2018). This dual-labeled TDP-43 was immobilized onto PEG-biotinylated glass using an N-terminally encoded HaloTag, isolating individual molecules across the glass surface, which can be illuminated via TIRF to observe the conformational behavior of the TDP-43 LCD on these molecules (Fig. 3A,B). Additionally, we used an alternating-laser excitation (ALEX) scheme, where two lasers alternately excite the donor and acceptor dyes, to assess dye stoichiometry and one-step photobleaching to select molecules dually labeled with one Cy3 dye and one ATTO647 dye (Fig. 3C; Kapanidis et al. 2004; Tsuboyama et al. 2018). FRET efficiency informs on the conformation of the LCD where high FRET occurs when the fluorophores are in close proximity, corresponding to the collapse of the LCD, while low FRET occurs when the fluorophores are distant, corresponding to extension of the LCD (Fig. 3D). Under incubation in 0.3 mg/mL BSA control, we observed a broad range of FRET signals, with a slight peak at ∼0.8, suggesting high heterogeneity in the distribution of LCD conformations (Fig. 3E), in agreement with its disordered nature and tendency to aggregate (Johnson et al. 2009; French et al. 2019). We also introduced the A315T mutation into the genetic code expanded TDP-43 for single-molecule analysis. Unlike the WT LCD, we observed a strong high FRET peak (∼0.9) for the A315T mutant LCD when incubated in the control BSA-containing buffer (Fig. 3F), indicating that the A315T mutation induces more collapsed conformations than WT LCD.
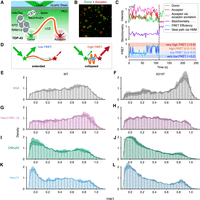
Hero11 and DNAJA2 promote extended conformations of the TDP-43 LCD. (A) Schematic of TIRF-smFRET observation of the LCD (orange) on full-length TDP-43. HaloTag-TDP43 was labeled with Cy3 dye (Donor, green) and ATTO 647N dye (Acceptor, red) around the LCD and immobilized via NeutrAvidin to biotin-PEG on a quartz glass surface. Note that donor and acceptor dyes are randomly incorporated at the two sites, but only molecules dually labeled with one donor and one acceptor were selected for analysis (see Materials and Methods), of which the case where the donor is before and acceptor after the LCD is represented here. (B) Representative smFRET microscope image (from DNAJA2 incubation) of molecules tethered to the glass surface. Donor (green) and acceptor (red) emission signals are overlaid here, where candidate single molecules are highlighted in yellow circles. (C) Example FRET trace selected for analysis (from Hero11 incubation). The top plot shows the corrected fluorescence intensities of the Cy3 donor (green) and ATTO647N acceptor (red) signals upon excitation of the donor dye. The fluorescence intensity of the ATTO647N acceptor signal under excitation of the acceptor dye (from alternating-laser excitation) is shown in magenta. The middle plot shows the dye stoichiometry (purple), where roughly constant signals at ∼0.4 are attributed to single molecules dually labeled with one donor and acceptor dye. The bottom plot shows the FRET efficiency (cyan), with the ideal path from an HMM (hidden Markov model) (blue) overlaid. The shaded background in this plot corresponds to the binning used in the dynamics analyses in Figure 4. The vertical dotted line shows when the first single step photobleaching event occurred. In this case, the acceptor dye bleaches, resulting in complete loss of acceptor signal in both donor and acceptor excitations, recovery of donor signal in absence of FRET, and loss of ∼0.4 dye stoichiometry. (D) Schematic of how FRET signals provide information on LCD conformation. Upon excitation (green downward arrow), the donor dye Cy3 (green) may fluoresce (green upward arrows) or transfer resonance energy to the acceptor dye, ATTO 647N dye (red) via FRET (blue arrow), exciting the acceptor dye, in turn allowing it to fluoresce (red upward arrows). The transfer efficiency depends on the sixth power of the dye-to-dye distance, resulting in a steep distance dependence for the FRET signal (Supplemental Fig. S4A). (Left) Low FRET occurs when the dyes are far apart, corresponding to extended LCD, and is observed as more donor signals compared to acceptor. (Right) High FRET occurs when the dyes are near, corresponding to collapsed LCD, and is observed as less donor signals compared to acceptor. (E–L) FRET efficiency distributions of TDP-43 LCD WT or TDP-43 LCD A315T incubated with 0.3 mg/mL BSA (E,F), Hero11KR→G (G,H), DNAJA2 (I,J), or Hero11 (K,L), respectively. The density plots represent the mean ± SEM (the solid lines and shaded areas, respectively) of three repeated experiments. Histograms contain all the observations. The total numbers of molecules in each histogram are (E), 150; (G), 160; (I), 178; (K), 168; (F), 101; (H), 255; (J), 357; and (L), 216. Note that values <0 and >1 arise from background corrections applied uniformly across molecules of an experiment and from the kernel in the density plot, and still correspond to valid observations (see Materials and Methods).
Hero11 and DNAJA2 promote extension of the TDP-43 LCD
Since previous TIRF-smFRET studies of bacterial Hsp40s showed that they stabilize conformationally expanded states of natively folded client proteins such as luciferase and rhodanese (Kellner et al. 2014; Marzano et al. 2022), we investigated whether eukaryotic DNAJA2 was capable of eliciting this effect on the intrinsically disordered client TDP-43 LCD. In accordance with these studies, incubation of TDP-43 with DNAJA2 resulted in a very low FRET peak at ∼0.0 (Fig. 3I), which indicated extension of the LCD conformation. Strikingly, the addition of Hero11 also caused a similar very low FRET peak (Fig. 3K). In contrast, Hero11KR→G mutant did not cause apparent changes in the FRET distribution compared with the BSA control (Fig. 3G), consistent with its inability to suppress TDP-43 aggregation in cells (Fig. 1D). To account for the concentration dependence of these effects, we repeated this experiment at 1/4th lower protein concentration (Supplemental Fig. S2). While lowering the concentration of Hero11KR→G (Fig. 2A) or DNAJA2 (Fig. 2B) from 0.3 mg/mL to 0.075 mg/mL did not notably alter their effects on LCD conformational distributions, lowering the concentration of Hero11 did modestly weaken the ∼0 low FRET peak (Fig. 2C). However, the LCD conformational distribution in 0.075 mg/mL Hero11 was nonetheless similar to DNAJA2 at 0.3 mg/mL (and 0.075 mg/mL). Given that Hero11 is ∼1/4th the molecular weight of DNAJA2, this suggests that equimolar amounts of Hero11 and DNAJA2 show similar effects on LCD conformation. Nonetheless, these proteins are still expected to be in excess compared to TDP-43, which are isolated as single molecules across the glass surface.
Similarly, consistent with their effectiveness in suppressing the aggregation of the A315T mutant in cells (Fig. 1E), both Hero11 and DNAJA2 promoted very low FRET peaks (∼0.0) in the FRET distribution of the A315T LCD (Fig. 3J,L). Unlike the WT LCD, where its influence on conformational distribution was indistinguishable from that of the BSA control, incubation with Hero11KR→G resulted in loss of the very high FRET peak (∼0.9), resulting in a flat conformational distribution of the A315T LCD (Fig. 3H). This suggests that the KR→G mutant can reduce the population of LCD molecules trapped in very high FRET states, but unlike DNAJA2 and Hero11 WT, did not cause a shift to a low FRET peak. Altogether, this suggests that DNAJA2 promotes extended conformations of the aggregation-prone intrinsically disordered WT and A315T TDP-43 LCD, and that Hero11, despite lacking specific tertiary structures such as those of DNAJA2, is capable of eliciting a similar effect in a manner dependent on its net charge.
Hero11 and DNAJA2 stabilize conformationally dynamic extended states of the LCD
We next investigated the detailed conformational dynamics of TDP-43 LCD in the presence of the aggregation suppressors. To this end, we idealized the dynamic FRET trajectories into discrete FRET states via a hidden Markov model (HMM), allowing for quantitative analysis of conformational dynamics (Fig. 3C; Preus et al. 2015; Tsuboyama et al. 2018). To understand how DNAJA2 and Hero11 change transition dynamics, FRET states were classified into four bins based on FRET efficiency: very low (<0.2), low (0.2–0.5), high (0.5–0.8), and very high (>0.8). Then, we counted transition events between these FRET bins for all possible combinations, summarizing the frequency of transition events occurring between FRET bins (Fig. 4A). While there were some weak transition patterns in BSA (between low and high bins and vice versa) and Hero11KR→G (from very low to high) incubations, there was no clear overall pattern in the effects of these proteins on transition events. In contrast, we observed that most transition events (∼20%) occurred within the very low FRET bin for the DNAJA2 and Hero11 incubations, with little pattern elsewhere. This suggests that both DNAJA2 and Hero11 can maintain the dynamic transitions of the LCD around very low FRET (i.e., the extended state of the LCD as in Fig. 3I,K).
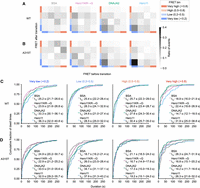
DNAJA2 and Hero11 stabilize the dynamic and extended states of LCD. (A,B) Transition density plots of the WT (A) or A315T (B) LCD, under incubation in the indicated protein, from left to right: BSA, Hero11KR→G, DNAJA2, and Hero11. Idealized FRET traces were obtained from HMM from which FRET states were obtained and binned by FRET efficiency: very low (<0.2), low (0.2–0.5), high (0.5–0.8), and very high (>0.8), as in Figure 3C. Then, the number of transition events between the FRET bins were counted. The ratio of transition events between the FRET state bins is indicated by shading. (C,D) Dwell times of FRET states as represented by empirical cumulative distribution functions for the WT (C) or A315T (D) LCD grouped by the FRET state bin. From the idealized FRET traces, the dwell times were measured as the duration of each FRET event and grouped by the FRET bin as in Figure 3C, and further grouped by incubation condition as indicated by the color. For each bin, the dwell times under each incubation condition were fitted to single exponential models (see Supplemental Fig. S3). From the fitted models, the estimated dwell time half-lives (s), t1⁄2, are displayed, and uncertainties reported as 95% credible intervals in parentheses.
For the A315T mutant (Fig. 4B), the transition density histograms in the BSA control display most of the transition events occurring between the high- and very high-FRET bins. Incubation with Hero11KR→G results in evenly distributed FRET state transitions from very low to very high bins, consistent with its flat conformational distribution (Fig. 3H). In contrast, for Hero11 or DNAJA2, transition events occurred more frequently within the <0.2 FRET bins, suggesting the dynamic behavior of molecules in the very low FRET peak promoted by these proteins (Fig. 3J,L). Taken together, the effects of BSA, Hero11, Hero11KR→G, and DNAJA2 on the transition dynamics of the A315T mutant LCD were generally consistent with their effects on the WT LCD.
We next measured the dwell times of the FRET states (duration spent in a certain FRET state before transitioning away to another state) for the four bins (very low to very high, as shown in Fig. 4A,B), summarized as empirical cumulative distribution functions (Fig. 4C,D). Because transitions between the four FRET bins are expected to be governed by single-step processes, we used a Bayesian approach to fit single exponential distribution models to each of the dwell time distributions to quantitatively sample/estimate the kinetic rate constant (reported as the dwell time half-life, t½; see Supplemental Fig. S3 for fitting accuracy).
For the WT LCD (Fig. 4C), Hero11 and DNAJA2 clearly extended the dwell times of the very low FRET states of the LCD compared to BSA and Hero11KR→G (median t1⁄2 ∼33–36 sec vs. ∼24–25 sec, for Hero11 and DNAJA vs. BSA and Hero11KR→G, respectively). Similarly, Hero11 and DNAJA2 also extended the dwell times of the very low FRET states of A315T compared to BSA and Hero11KR→G (Fig. 4D; median t1⁄2 ∼33 sec vs. ∼23–25 sec, respectively). Additionally, this extension of dwell time also occurred for the low-FRET states of A315T (median t1⁄2 ∼34–38 sec vs. ∼19–26 sec for Hero11 and DNAJA2 vs. BSA and Hero11KR→G, respectively). This suggests that Hero11 and DNAJA2 stabilize the extended conformations of both the WT and A315T LCD.
Taken together, our detailed dynamics analyses indicate that Hero11 and DNAJA2 both stabilized the dwell times of the lowest FRET states (Fig. 4C,D) while biasing for transition events between these lowest FRET states (Fig. 4A,B) of the WT and A315T LCDs. For DNAJA2, this effect is consistent with the stabilization of unfolded client proteins by Hsp40s (Kellner et al. 2014; Jiang et al. 2019; Marzano et al. 2022). We also found that Hero11 has similar effects despite the lack of the structural features comparable to Hsp40 necessary for interaction with TDP-43 LCD (Jiang et al. 2019; Carrasco et al. 2023). Thus, despite differences in structural features, these results indicate that Hero11 and DNAJA2 have surprisingly similar effects on the dynamics of the TDP-43 LCD.
DISCUSSION
Overall, our results orchestrally support that conformational modulation of the LCD is a key to the pathological aggregation process of TDP-43. Although it is currently almost impossible to directly observe conformation within aggregates via smFRET, we envision that these compact conformations, which are amenable to extension, may represent precursors to stably aggregated states. In support of this, we estimate the very high FRET ∼0.9 peak corresponds to an ∼3.3 nm mean end-to-end distance for our dye pair, labeled at residues 268 and 420 six amino acids before and after the LCD (Supplemental Fig. S4A), which is roughly compatible with the distances in collapsed LCD conformations observed in amyloid fibril structures of the in vitro–formed full LCD (7KWZ [PDB code]: F276–M414, 1.716 nm) (Li et al. 2021). This suggests the A315T mutation induces more compact conformations of LCD at the single-molecule level in addition to its role in stabilizing the amyloid fibril structure through intra- and interstrand interactions (Guenther et al. 2018; Cao et al. 2019).
In contrast, we observed that DNAJA2 stabilized extended conformations of the TDP-43 LCD and suppressed its aggregation. This finding is in line with reports that Hsp40s stabilize nonnative unfolded conformations of structured client proteins, leading to native-state folding (Rüdiger et al. 2001; Kellner et al. 2014; Jiang et al. 2019; Marzano et al. 2022), and reports that DNAJA2 binds to the LCD (Carrasco et al. 2023). However, the distinction here is that the client protein is an otherwise collapsed LCD. We also found that Hero11 stabilized the extended conformations of the TDP-43 LCD similarly to DNAJA2. In support of this, small but increasing numbers of Hero11 molecules lead to an increased radius of gyration for LCD molecules in molecular dynamics simulations (Tan et al. 2023). The very low FRET ∼0 peak observed in the presence of Hero11 and DNAJA2 should contain conformations from 6.80 nm (0.1 FRET) to wider than 10.2 nm (0.01 FRET) mean end-to-end distance (∼0.01 FRET), which is comparable or more extended than the ∼7.34 nm mean distance expected for a “native” state of the LCD, estimated by a wormlike chain model (Supplemental Fig. S4A,B; see Materials and Methods). Together, these support conformational modulation of the LCD as a determinant of TDP-43 aggregation, where extended conformations, promoted by the intervention of DNAJA2 or Hero11, are excluded from progressing further toward aggregation, as expected for “holdase”-type Hsp40 chaperoning (de Graff et al. 2020; Hall 2020; Mitra et al. 2022).
Despite the similar effects on TDP-43 LCD conformation, a key difference between DNAJA2 and Hero11 is that DNAJA2 extensively uses its structural features, including multivalent binding at multiple sites across the surfaces of its C-terminal domains across the dimer, in its chaperoning of client proteins (Jiang et al. 2019). In contrast, Hero11 is unlikely to have a solid tertiary structure or bind to TDP-43 LCD in a defined conformation. Nonetheless, it is possible that Hero11 interacts with the TDP-43 LCD via a partial alpha-helical secondary structure on both IDPs, as demonstrated in molecular dynamics simulations (Tan et al. 2023). Notably, such interactions between Hero11 and the LCD made up a large fraction of the intermolecular contacts in these simulations (Tan et al. 2023). The transient alpha-helical structure in the LCD is also selectively bound by DNAJA2 (Carrasco et al. 2023), which may serve as an anchoring interaction for stabilizing LCD conformation. Alternatively, but not mutually exclusively, this stabilization effect may occur based on the biophysical or compositional properties of the Hero11 chain regardless of structure because exclusion of this alpha-helical structure did not substantially affect the overall results of the simulations (Tan et al. 2023). As demonstrated in designed random polymers mimicking IDPs (Panganiban et al. 2018), the conformational flexibility and composition of Hero11 may maximize stabilizing interactions with the surfaces of client proteins to prevent aggregation. Notably, the highly positively charged property of Hero11 is important for its interaction with the LCD, as the charge composition mutant Hero11KR→G failed to elicit stabilization of the extended conformations nor suppress aggregation. Compositional charge may be a requirement for this effect as other positively charged Hero proteins, Hero45 and Hero7 (pI values 8.66 and 10.44, respectively) were also effective suppressors of TDP-43 aggregation, while negatively charged Hero proteins, Hero9, Hero20, and Hero13 (pI values 4.13, 4.57, and 5.31, respectively) were poor suppressors (Tsuboyama et al. 2020). Thus, we speculate that the combination of transient interactions and the compositional properties of Hero11 enable it to influence client protein conformation.
Moreover, these biophysical properties of Hero11 may enable it to suppress phase separation of the LCD (and presumably subsequent aggregation) according to molecular dynamics simulations (Tan et al. 2023). This curiously mirrors how DNAJA2 suppresses LCD phase separation, where cationic residues of DNAJA2 are thought to supply similar repulsive effects (Carrasco et al. 2023). However, one key difference is that DNAJA2 is a co-chaperone of Hsp70 (Rosenzweig et al. 2019; Carrasco et al. 2023), allowing for recruitment of TDP-43 toward the greater chaperoning network, whereas such activity is still unknown for Hero11. Nonetheless, overexpression of Hero11 has been demonstrated to bolster the fitness of cultured cells and Drosophila (Tsuboyama et al. 2020), presumably by reducing the burden of immediately harmful misfolded proteins on the canonical chaperoning system.
Overall, these results validate that the overexpression of Hero11 is an effective strategy to suppress the aggregation of TDP-43, with conformational and aggregation-suppressing effects comparable to canonical chaperone DNAJA2. It is important to note that these results are limited to the exogenous introduction of Hero11, which may differ from its endogenous expression and roles. Nonetheless, understanding the downstream mechanistic details of Hero protein-mediated aggregation suppression will be important not only from a basic science perspective but also for their biotechnological and therapeutic applications.
MATERIALS AND METHODS
HEK293T cell culture and lysate preparation
HEK293T cells were maintained in Dulbecco's Modified Eagle Medium (DMEM; Sigma QJ-D6429) supplemented with 10% FBS in a 5% CO2 atmosphere at 37°C. Naive HEK293T cell lysates were produced as previously described (Tsuboyama et al. 2020). Briefly, HEK293T cells were grown to confluency in 10–20 100 mm plates (Corning), harvested and resuspended in 1 μL 1× hypotonic lysis buffer [10 mM HEPES KOH, 10 mM KOAc 1.5 mM Mg(oAc)2] containing 1× cOmplete EDTA-free Protease Inhibitor Cocktail (Roche) and 1 mM DTT on ice to lyse cells, and lysate collected as the supernatant from 20 min 17,000g centrifugation at 4°C.
Plasmids for recombinant protein production in Escherichia coli
Plasmids for recombinant Hero proteins and the controls, pColdI_ Hero11-FLAG-6×His, Hero11KR→G-FLAG-6×His, and GST-FLAG-6×His, were previously described (Tsuboyama et al. 2020). The recombinant plasmid used for the chaperone pColdI_6×His-DNAJA2 was previously described (Naruse et al. 2018).
Plasmids for HEK293T cell-based assays and protein production
For transfection into HEK293T cells, pCAGEN_6×His-DNAJA2-HA was generated via PCR of the ORF from pColdI_6×His-DNAJA2 and inserted into EcoRI-digested pCAGEN plasmids using NEBuilder HiFi DNA Assembly Master Mix (NEB). This plasmid was subsequently used to produce pCAGEN_3×FLAG-DNAJA2 in a similar manner. The plasmids used for the Hero protein and the controls pCAGEN_3×FLAG-Hero11, pCAGEN_3×FLAG-Hero11KR→G, and pCAGEN_3×FLAG-GST were previously described (Tsuboyama et al. 2020). The plasmids used for the chaperones pCAGEN_3×FLAG-DNAJB8 and pCAGEN_3×FLAG-DNAJC8 were generated as previously described (Iwasaki et al. 2015). The plasmids used for genetic code expansion, pCAGEN_U6tRNAUCmut × 4_NESPylRS-Afmut and pCAGEN_U6tRNAUCmut × 4_eRF1EDmut, were previously described (Tsuboyama et al. 2018, 2020). The plasmid used for the expression of GFP-tagged TDP-43 in HEK293T cells and TDP43ΔNLS was previously described (Tsuboyama et al. 2020). The plasmid for incorporating unnatural amino acids into TDP-43, pCAGEN_3×FLAG-TEV-HALO-TDP43_R268Amb-F420Amb-2×HA, was created first by PCR of the ORF from pCAGEN_eGFP-TDP43 and insertion into NotI-digested pCAGEN_FLAG-tev-HALO-Ago2 (Tsuboyama et al. 2018). Then, an ochre mutation of the final stop codon after 2×HA, and amber mutations around the TDP-43 LCD at R268 and F420, were introduced by PCR-based site-directed mutagenesis, as previously described. To test the A315T mutation, pCAGEN_eGFP-TDP43_A315TΔNLS and pCAGEN_FLAG-TEV-HALO-TDP43_R268Amb-A315T-F420Amb-2×HA were created from the A315T mutation of pCAGEN_eGFP-TDP43_ΔNLS and pCAGEN_FLAG-TEV-HALO-TDP43_R268Amb-F420Amb-2×HA, respectively, via PCR-based site-directed mutagenesis.
Protein purification of His-tagged proteins from pColdI plasmids.
Recombinant Hero proteins, charge mutants and DNAJA2 were purified as previously described (Naruse et al. 2018; Tsuboyama et al. 2020). Briefly, pColdI plasmids for C-terminally FLAG-6×His-tagged proteins were transfected into Rosetta2 (DE3) cells, which were subsequently grown at 37°C to an O.D. of 0.4−0.6. The proteins were induced with 1 mM isopropyl-β-D-thiogalactoside (IPTG) overnight at 15°C and snap-frozen with liquid nitrogen. Cells were lysed by probe sonication in His A buffer [30 mM HEPES-KOH pH 7.4, 200 mM KOAc, 2 mM Mg(OAc)2, 5% glycerol] supplemented with cOmplete EDTA-free Protease Inhibitor Cocktail (Roche), cleared by centrifugation, purified over Ni-NTA resin (Roche) and eluted with His B buffer (HisA with 400 mM imidazole). The proteins were buffer-exchanged into 1×PBS using PD-10 columns (Cytiva), and the concentration was determined by a BCA assay (Pierce) before supplementation to 1 mM DTT. The proteins were snap-frozen in aliquots and stored at −80°C.
Protein purification via genetic code expansion
Genetic code expansion was performed as described previously (Nikić et al. 2015, 2016; Tsuboyama et al. 2018). HEK293T cells were seeded and transfected after 24 h with pCAGEN plasmids in medium supplemented with EndoBCN-K (SiChem SC-8014) and harvested 48 h after transfection. The cells were lysed by sonication via Bioruptor II (BM Bio), snap-frozen with liquid nitrogen, and stored at −80°C. The proteins were purified with FLAG-functionalized Dynabeads Protein G (Invitrogen), dye-labeled on beads with tetrazine-functionalized Cy3 and ATTO647N (Jena Bioscience, CLK-014-05 and CLK-012-02), functionalized with the HaloTag Biotin ligand (Promega, G8281), eluted in naive HEK293T cell lysate with TurboTEV Protease (Accelagen, T0102S), and snap-frozen in liquid nitrogen and stored at −80°C. Fluorescent dye labeling was verified via SDS–PAGE via detection of fluorescence at the indicated wavelengths with an Imager 600 (Amersham).
Cell-based aggregation assays
Cell-based aggregation assays were performed as previously described (Tsuboyama et al. 2020). HEK293T cells were seeded in 12-well plates (Corning) at a density of 6 × 10⁴ cells/mL, and after 24 h cotransfected with 200 ng of the pCAGEN plasmid for TDP-43 and 1000 ng of the pCAGEN plasmid for the other protein using Lipofectamine 3000 Transfection Reagent (Invitrogen, L3000001). After 48 h, cells were imaged using a FLUOVIEW FV3000 confocal laser scanning microscope (Evident) and then lysed with Bioruptor II (BM Bio) in 1×PBS supplemented with 1× cOmplete Protease Inhibitor Cocktail (Roche) in Protein LoBind Tubes (Eppendorf). Total protein amounts were quantified via Bradford assay (Bio-Rad) normalized to the lowest concentration sample. Samples were solubilized in equal volumes of 1×PBS with 1% SDS and run through a 0.2 μm Whatman OE66 cellulose acetate membrane filter (GE Healthcare, 10404180), using a suction pump (Air Liquide) at a vacuum of around 10 kPa, to capture aggregated proteins. TDP-43 aggregation was checked using a GFP fluorescence signal, and for the final figures, detected via immunoblotting for GFP using an α-GFP (B-2) primary antibody (Santa Cruz Biotechnology, sc-9996) and an α-mouse IgG secondary antibody (MBL), both at 1:10,000.
Microscopy of GFP-TDP43ΔNLS in cells
HEK293T cells were seeded at a density of 6 × 10⁴ cells/mL onto 35 mm glass bottom dishes (MatTek, P35G-1.5-14-C) pretreated with poly-L-lysine (Sigma-Aldrich, P4707), and after 24 h were transfected with 1000 ng of pCAGEN_GFP-TDP43ΔNLS and 1500 ng of pCAGEN-3×FLAG-DNAJA2, Hero11, Hero11KR→G, or GST using Lipofectamine 3000 Transfection Reagent (Invitrogen, L3000001). After 48 h, cells were stained with Hoechst 33342 (Invitrogen, H3570) for imaging on a FLUOVIEW FV3000 confocal laser scanning microscope (Evident), using a 100× oil-immersion lens controlled with FV31S-SW Viewer software (Evident). All images were captured using the same laser power and settings, chosen as to avoid saturation of pixels. For each image, reference images with saturation of pixels were also captured.
For FRAP experiments, cells were transfected with 1000 ng of pCAGEN_GFP-TDP43ΔNLS or 1500 ng of pCAGEN-3×FLAG-GST without Hoechst staining using the LSM stimulation mode. Zoomed-in videos of a single cell were taken at 1 sec per frame. After five prebleaching frames, 100% power laser stimulation was applied to a small circular area within the puncta for 500 msec, and an image was taken as the bleach frame, followed by 150 additional recovery frames.
Single-molecule FRET microscopy
Single-molecule assays were conducted as previously described (Sasaki et al. 2018; Tsuboyama et al. 2018), with modifications to minimize aggregation. Briefly, aliquots of dye-labeled HALO-TDP43 were prediluted in 1× lysis buffer (30 mM HEPES-KOH pH 7.4, 100 mM KOAc, 2 mM Mg(OAc)2) and then diluted in naive HEK293T cell lysate with 1×ATP regeneration system (1 mM ATP, 25 mM creatine monophosphate [Sigma], 0.03 U/μL creatine kinase [Calbiochem], 0.1 U/μL RNasin Plus RNase Inhibitor [Promega], in lysis buffer) and incubated at 37°C for 30 min to enable aggregation-clearing chaperone activities. Note that the use of high-quality HEK293T cell lysates generated via the hypotonic lysis method was crucial, as lysates prepared via sonication failed to sufficiently remove aggregates. The mixture was subsequently centrifuged at 18,000g for 15 min at 25°C, after which the supernatant was collected to remove the aggregated proteins in the pellet. Observation chambers were prepared as previously described from biotin-PEG- and PEGylated glass slides (Sasaki et al. 2018; Tsuboyama et al. 2018), infused with neutravidin for 2 min, and washed with 1× lysis buffer. The supernatant was added to the chamber, which was incubated for 2 min, washed twice with wash buffer (1× lysis buffer containing 1% Triton X-100 and 800 mM NaCl), four times with wash buffer supplemented with 10 mM ATP, and four times with 1× lysis buffer. These stringent washes are necessary to remove nonspecific interactions and oligomerization of TDP-43 with tethered TDP-43 molecules. The final observation buffer containing 0.3 mg/mL BSA or recombinant protein in 1× PBS with 1 mM DTT, an O2 scavenger system (7.1 mM PCA [3,4-dihydroxybenzoic acid, 37580, Sigma]), 29 nM PCD (protocatechuate 3,4-dioxygenase, P8279, Sigma) (Aitken et al. 2008), and 2 mM Trolox (6-hydroxy-2,5,7,8-tetramethylchroman-2-carboxylic acid, 238813, Sigma) was flowed into chamber, after which the chamber was mounted onto a custom microscope for smFRET observation. For the experiments at 0.075 mg/mL, 0.075 mg/mL of the recombinant protein was supplemented with BSA for a final total protein concentration of 0.3 mg/mL. Three five-minute videos were taken of each slide using alternating-laser illumination of 1 sec each. We emphasize that these procedures are uniquely practical for TIRF-smFRET experiments, which, by tethering dye-labeled molecules, allow for buffer exchange and minimization of aggregation for an extremely small sample.
Data analysis and visualization software
Image analyses of cells were performed using the Fiji distribution of ImageJ (Schindelin et al. 2012). The data analysis was performed in Python 3.7.10 using compatible versions of pandas, NumPy, SciPy, Matplotlib, and seaborn in addition to the standard library via Jupyter notebooks implemented with Spyder-notebook in Spyder IDE version 5.
Analysis of aggregation assays
Images from bulk aggregation filter trap assays were taken using an Amersham ImageQuant 800 Imager (Amersham) in TIFF image format. For quantification, images were analyzed using ImageJ Fiji using a simple macro script in a manner similar to dot blots, first with background subtraction via the “Subtract Background” tool, with a rolling ball radius of 50 pixels. Circular areas of 125 pixels diameter were then selected around the highest concentration wells to obtain integrated densities for each sample and saved in CSV file format. These measurements were imported into Python for analysis, where integrated densities were divided by the GST co-transfection well in each blot to quantify aggregation relative to GST and visualized.
Microscope image analysis
The HEK293T cell images in the figures were prepared via the QuickFigs plugin for Fiji (Mazo 2021). For puncta counting and measurement analyses, images were analyzed through an automated ImageJ macro that used base macro functions to threshold, clean, and identify areas of interest. These created masks for cell areas, nuclei areas, and puncta areas, and image calculator operations were performed to identify overlapping areas. Cell area masks were defined using the saturated images to identify cells with any expression of GFP, including diffuse background signals. Nuclei areas masks were defined using the using nuclei that were contained in the cell area mask and were also used as an accurate count of cells of interest. Puncta area masks were defined using masks that detected local areas of high and moderate GFP signals and thresholding against the low background signal. Using these masks cytoplasmic puncta were defined in order to count and measure areas and signals of these puncta in the original image and exported to CSV for analysis and visualization in Python.
FRAP analysis of large aggregates
For FRAP analysis, an interactive macro was used to allow for partially automatic selection of regions of interest via local
maxima and thresholding of the bleach spot, the puncta area, the cell area, and a background area, and were used for FRAP
analysis. These regions were interpolated over the video to account for movement of the puncta and cells and were subsequently
measured to determine mean signal in the area and exported to csv for analysis in Python. The measurements for each recovery
curve were background corrected and double normalized to the average maximum intensity prebleach and minimum intensity postbleach
(Ishikawa-Ankerhold et al. 2014), and visualized. A single exponential, exponential equation (Equation 1) was fitted to each recovery curve using nonlinear least squares via SciPy for determination of the mobile fraction (1 −
If). (1)
where the intensity at time t, I(t), is described by the rate parameter k and If is the plateau recovery intensity.
(1)
where the intensity at time t, I(t), is described by the rate parameter k and If is the plateau recovery intensity.
Analysis of smFRET assays
The smFRET videos were imported to iSMS implemented in MATLAB for image channel alignment, peak localization, FRET-pair identification, photobleaching and blinking identification, drift correction, and correction factor determination and application as previously described (Hwang et al. 2009; Preus et al. 2015; Tsuboyama et al. 2018). Note that background correction, applied uniformly by experiment, sometimes results in negative FRET values close to 0. FRET efficiency traces were selected based on single step photobleaching, a stoichiometry of ∼0.4 via ALEX and anticorrelation. The FRET distribution analysis data were exported as TXT files from iSMS. Visualization was conducted through python to load TXT files, and density histograms were plotted using the combined data for each condition with 25 bins. Average density plots were created by estimating the probability density functions for each independent experiment via Gaussian kernel density estimation with 0.05 bandwidth, and the values of each curve were evaluated for determination of means and standard errors along the entire range. The mean density and standard error of the mean for each condition were plotted over the histograms.
Analysis of smFRET dynamics
For dynamics analysis, a HMM with variational Bayesian expectation maximization (VBEM) implemented in iSMS was used to extract
ideal traces, as previously described (Preus et al. 2015; Tsuboyama et al. 2018), as TXT and imported into python for analysis. Traces were denoised for counting transition events and dwell times and visualized.
Single exponential distributions were fitted to the dwell time distributions using Bayesian modeling implemented in PyMC 5.9.
A normally distributed (μ = 0, σ = 10) prior was used for the log of the λ parameter (λ, equivalent to the rate parameter,
k) for the exponential model and combined with the observed dwell time distribution in the likelihood function to run Markov
chain Monte Carlo (MCMC) stochastic simulations with the No U-Turn Sampler (NUTS) algorithm, taking 100 samples after 100
tuning samples from one chain. We reported median and 95% credible interval estimates of the posterior distribution of the
fitted parameters. These were visualized as cumulative distribution functions (Equation 2). (2)
where the cumulative distribution function f(t) is described by the rate parameter k.
(2)
where the cumulative distribution function f(t) is described by the rate parameter k.
Interdye distance estimations from FRET efficiencies
To approximate theoretical end-to-end distances from FRET efficiencies, we used community-provided values of the Förster radius
R0 for FRET between Cy3 and ATTO 647 N (Lambert 2019) following Förster's equation for the relationship between FRET efficiency and distance.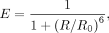 (3)
where the FRET efficiency, E, is proportional to the inverse sixth power of the distance between fluorophores, R.
(3)
where the FRET efficiency, E, is proportional to the inverse sixth power of the distance between fluorophores, R.
Wormlike chain model
To approximate the end-to-end distance, we assumed that the LCD polymer behaves according to the wormlike chain (WLC) model
(Schuler et al. 2005; Sahoo et al. 2006; Miyazono et al. 2010). (4)
where r is the distance between the polymer ends, L is the polymer contour length, P(r) is the probability of the polymer having an end-to-end distance of r, lp is the persistence length of the polymer (describing bending), and C is the normalization factor. For simplicity, we considered a one-dimensional distribution with a contour length of 47.94
nm (141 amino acids × 0.34 nm per amino acid). A persistence length of 0.8 nm was chosen to describe random coils, as experimentally
observed for polyglycine (or glycine–serine repeats) (Sahoo et al. 2006).
(4)
where r is the distance between the polymer ends, L is the polymer contour length, P(r) is the probability of the polymer having an end-to-end distance of r, lp is the persistence length of the polymer (describing bending), and C is the normalization factor. For simplicity, we considered a one-dimensional distribution with a contour length of 47.94
nm (141 amino acids × 0.34 nm per amino acid). A persistence length of 0.8 nm was chosen to describe random coils, as experimentally
observed for polyglycine (or glycine–serine repeats) (Sahoo et al. 2006).
SUPPLEMENTAL MATERIAL
Supplemental material is available for this article.
COMPETING INTEREST STATEMENT
Y.T. and K.T. have patent applications related to this work. H.T. and A.Y.W.L. declare no competing interests.
ACKNOWLEDGMENTS
We thank all members of the Tomari laboratory for critical comments on the manuscript. This work was supported in part by JSPS KAKENHI Grant-in-Aid for Transformative Research Areas (A) 21H05278 (to Y.T.), Grant-in-Aid for Scientific Research (S) 18H05271 (to Y.T.), and Grant-in-Aid for JSPS Fellows 22J11678 (to A.Y.W.L.).
Footnotes
-
Article is online at http://www.rnajournal.org/cgi/doi/10.1261/rna.080165.124.
- Received June 26, 2024.
- Accepted July 27, 2024.
This article is distributed exclusively by the RNA Society for the first 12 months after the full-issue publication date (see http://rnajournal.cshlp.org/site/misc/terms.xhtml). After 12 months, it is available under a Creative Commons License (Attribution-NonCommercial 4.0 International), as described at http://creativecommons.org/licenses/by-nc/4.0/.
REFERENCES
MEET THE FIRST AUTHOR

Meet the First Author(s) is an editorial feature within RNA, in which the first author(s) of research-based papers in each issue have the opportunity to introduce themselves and their work to readers of RNA and the RNA research community. Andy Lam is the first author of this paper, “DNAJA2 and Hero11 mediate similar conformational extension and aggregation suppression of TDP-43.” Andy is a PhD student at the Tomari Lab at the University of Tokyo. In this work, he and his coworkers investigated the effects of heat-resistant obscure (Hero) proteins on transactive response DNA-binding protein 43 kDa (TDP-43).
What are the major results described in your paper and how do they impact this branch of the field?
TDP-43 is one of many RNA-binding proteins (RBPs) that also contains a low-complexity domain (LCD) with prion-like properties. Using single-molecule FRET, we were able to see that TDP-43 LCDs behave as a heterogenous mixture of different relatively collapsed conformations, which could be altered when adding a chaperone protein, or introducing a disease-associated mutation. Most interestingly, Hero11, an intrinsically disordered protein (IDP) that can suppress TDP-43 aggregation, stabilized extended conformations of the TDP-43 LCD, just like a Hsp40 chaperone. This suggests that some IDPs may have effects that are more chaperone-like than appreciated.
What led you to study RNA or this aspect of RNA science?
So many RNA-binding proteins have these prion-like domains that seem to precariously exist between functional assembly and dysfunctional misfolding and aggregation. It's weird that such abundant and essential RBPs have these seemingly dangerous domains, especially when they are involved in fatal neurodegenerative diseases like ALS. I wanted to take a close look at one of these, TDP-43, and how it can be maintained in a “healthy” state, and what we can do when cells fail to maintain this “healthy” state.
During the course of these experiments, were there any surprising results or particular difficulties that altered your thinking and subsequent focus?
Single-molecule FRET, especially of highly aggregation prone TDP-43, is really hard because it would rather aggregate than stay as single molecules. Much of this work involved tediously optimizing the protocol in order to get reasonable numbers of single molecules. Moreover, the resulting data were not exactly intuitive, either. I had to reexamine in detail the differences between my own assumptions and what I actually understood about these biomolecules. I learned that some things are inherently hard, and you have to work even harder to make it work. This also made me learn to appreciate when things were easy.
What are some of the landmark moments that provoked your interest in science or your development as a scientist?
An important moment for me personally was when I got my first experience in a research lab, working with biomolecules with a goal in mind, in contrast to learning about them in textbooks. I think it marks the point at which I transitioned from being satisfied with just “knowing the name of something” to wanting to measure and fundamentally understand them in order to actually “know something.” A collective landmark moment I think I share with everyone is the COVID-19 pandemic, which taught us the role of researchers in society, and the impact research has on “real life.”
If you were able to give one piece of advice to your younger self, what would that be?
Don't work on an empty stomach, and don't think without adequate rest.




