


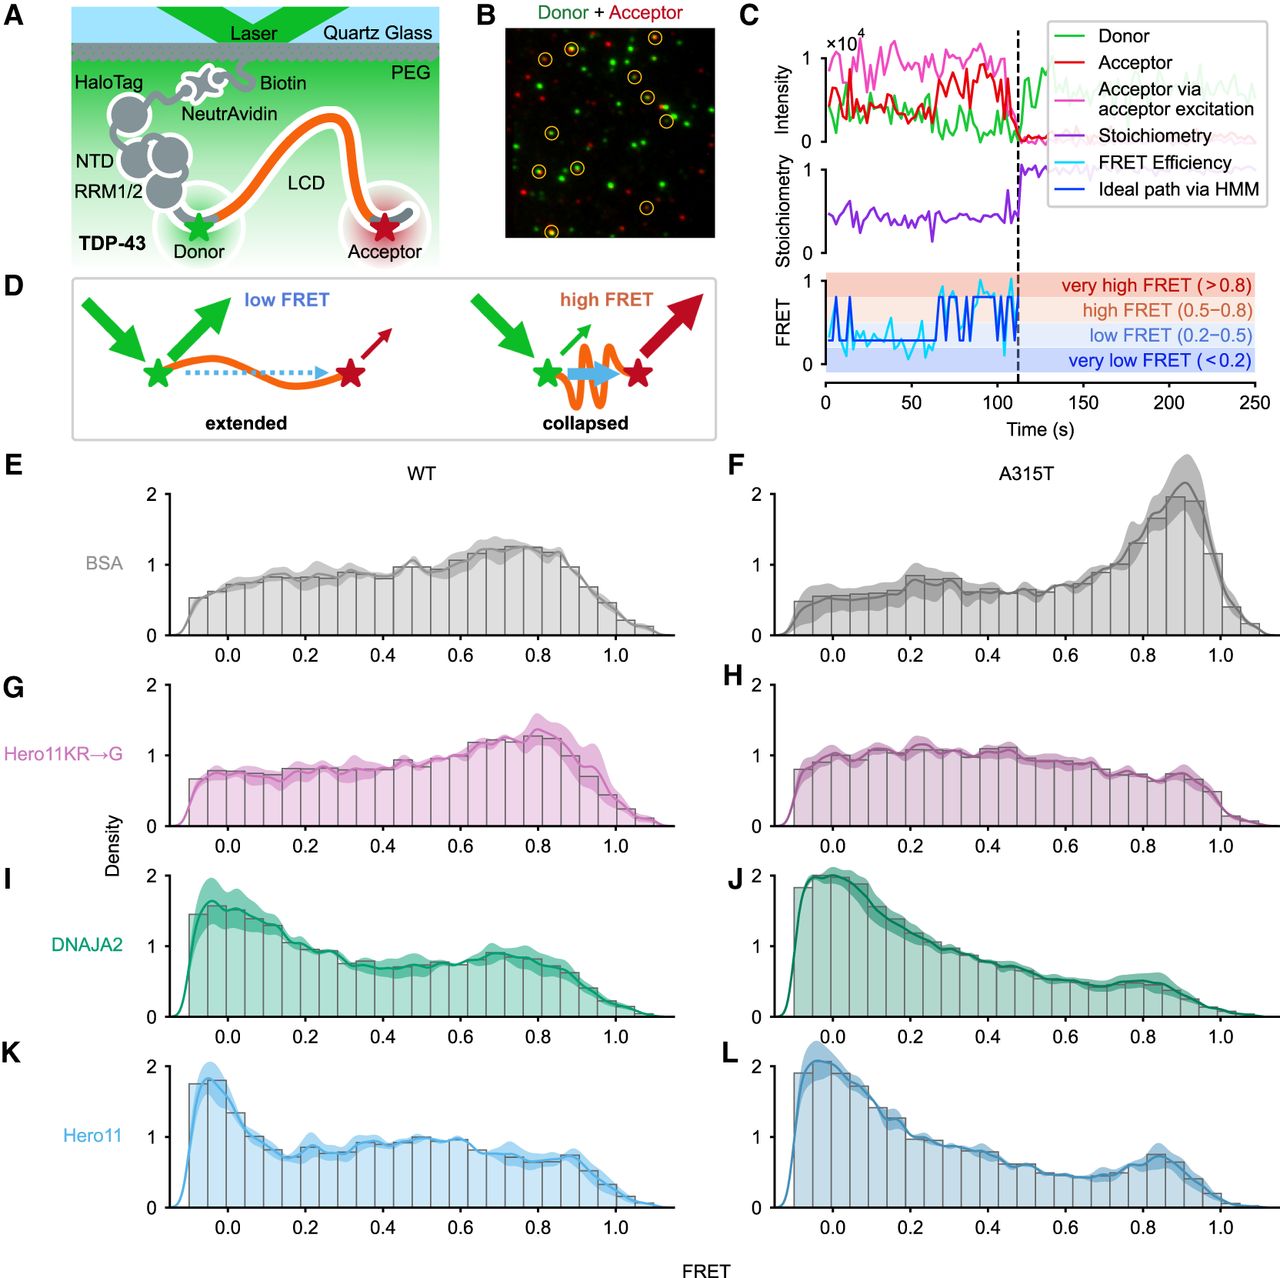
Hero11 and DNAJA2 promote extended conformations of the TDP-43 LCD. (A) Schematic of TIRF-smFRET observation of the LCD (orange) on full-length TDP-43. HaloTag-TDP43 was labeled with Cy3 dye (Donor, green) and ATTO 647N dye (Acceptor, red) around the LCD and immobilized via NeutrAvidin to biotin-PEG on a quartz glass surface. Note that donor and acceptor dyes are randomly incorporated at the two sites, but only molecules dually labeled with one donor and one acceptor were selected for analysis (see Materials and Methods), of which the case where the donor is before and acceptor after the LCD is represented here. (B) Representative smFRET microscope image (from DNAJA2 incubation) of molecules tethered to the glass surface. Donor (green) and acceptor (red) emission signals are overlaid here, where candidate single molecules are highlighted in yellow circles. (C) Example FRET trace selected for analysis (from Hero11 incubation). The top plot shows the corrected fluorescence intensities of the Cy3 donor (green) and ATTO647N acceptor (red) signals upon excitation of the donor dye. The fluorescence intensity of the ATTO647N acceptor signal under excitation of the acceptor dye (from alternating-laser excitation) is shown in magenta. The middle plot shows the dye stoichiometry (purple), where roughly constant signals at ∼0.4 are attributed to single molecules dually labeled with one donor and acceptor dye. The bottom plot shows the FRET efficiency (cyan), with the ideal path from an HMM (hidden Markov model) (blue) overlaid. The shaded background in this plot corresponds to the binning used in the dynamics analyses in Figure 4. The vertical dotted line shows when the first single step photobleaching event occurred. In this case, the acceptor dye bleaches, resulting in complete loss of acceptor signal in both donor and acceptor excitations, recovery of donor signal in absence of FRET, and loss of ∼0.4 dye stoichiometry. (D) Schematic of how FRET signals provide information on LCD conformation. Upon excitation (green downward arrow), the donor dye Cy3 (green) may fluoresce (green upward arrows) or transfer resonance energy to the acceptor dye, ATTO 647N dye (red) via FRET (blue arrow), exciting the acceptor dye, in turn allowing it to fluoresce (red upward arrows). The transfer efficiency depends on the sixth power of the dye-to-dye distance, resulting in a steep distance dependence for the FRET signal (Supplemental Fig. S4A). (Left) Low FRET occurs when the dyes are far apart, corresponding to extended LCD, and is observed as more donor signals compared to acceptor. (Right) High FRET occurs when the dyes are near, corresponding to collapsed LCD, and is observed as less donor signals compared to acceptor. (E–L) FRET efficiency distributions of TDP-43 LCD WT or TDP-43 LCD A315T incubated with 0.3 mg/mL BSA (E,F), Hero11KR→G (G,H), DNAJA2 (I,J), or Hero11 (K,L), respectively. The density plots represent the mean ± SEM (the solid lines and shaded areas, respectively) of three repeated experiments. Histograms contain all the observations. The total numbers of molecules in each histogram are (E), 150; (G), 160; (I), 178; (K), 168; (F), 101; (H), 255; (J), 357; and (L), 216. Note that values <0 and >1 arise from background corrections applied uniformly across molecules of an experiment and from the kernel in the density plot, and still correspond to valid observations (see Materials and Methods).




