


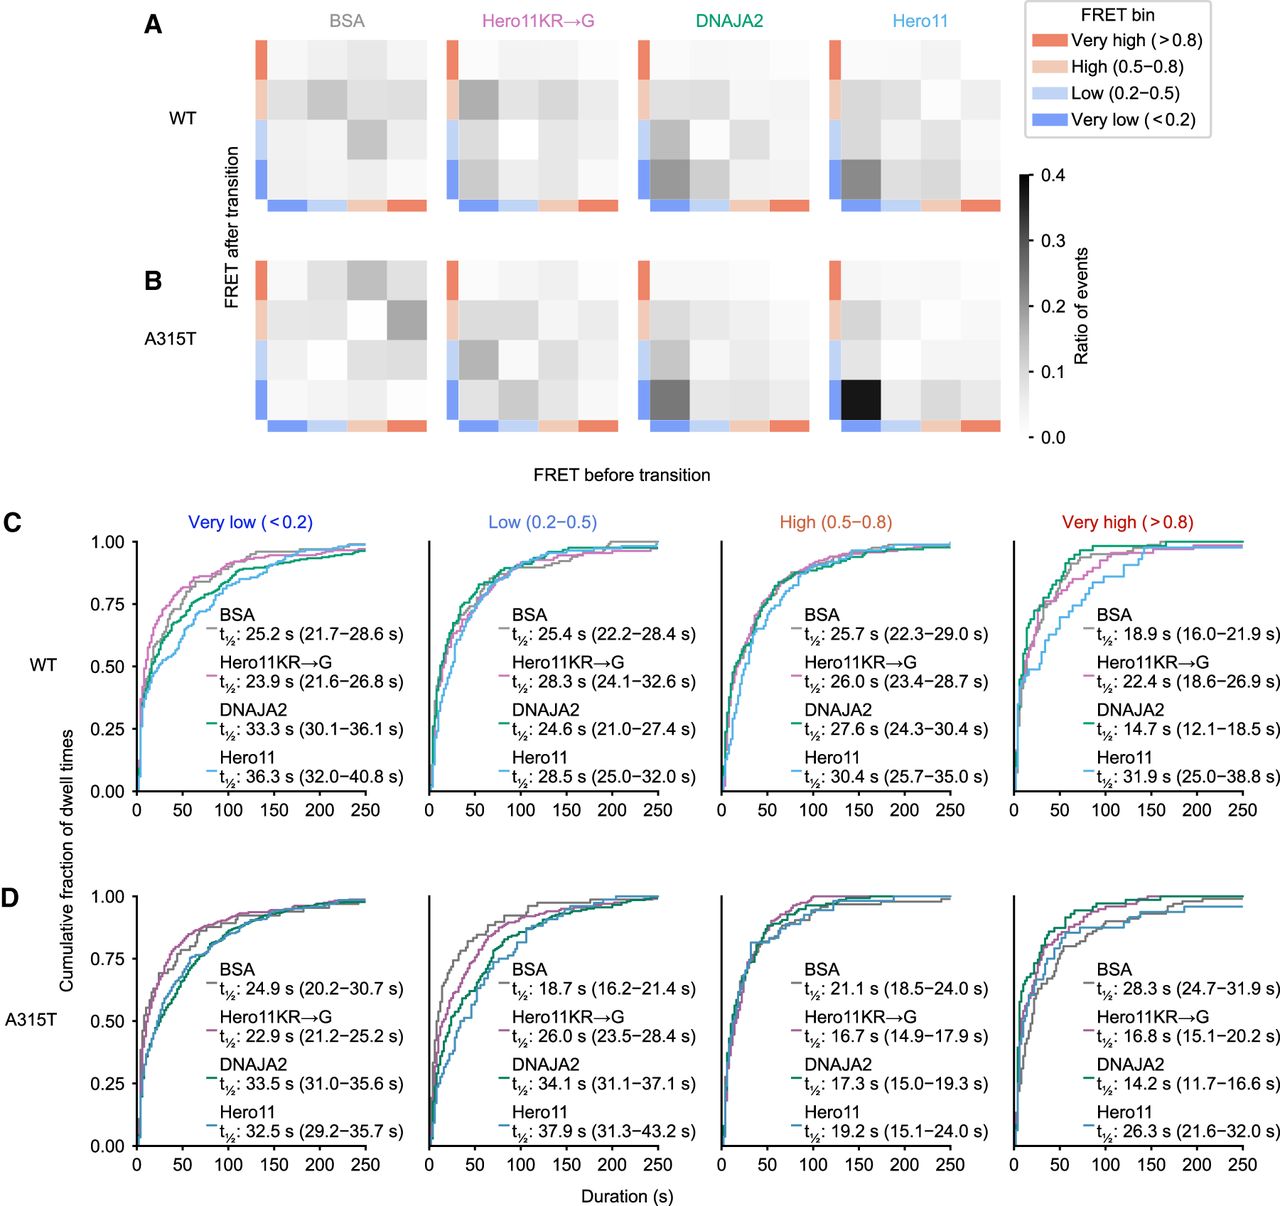
DNAJA2 and Hero11 stabilize the dynamic and extended states of LCD. (A,B) Transition density plots of the WT (A) or A315T (B) LCD, under incubation in the indicated protein, from left to right: BSA, Hero11KR→G, DNAJA2, and Hero11. Idealized FRET traces were obtained from HMM from which FRET states were obtained and binned by FRET efficiency: very low (<0.2), low (0.2–0.5), high (0.5–0.8), and very high (>0.8), as in Figure 3C. Then, the number of transition events between the FRET bins were counted. The ratio of transition events between the FRET state bins is indicated by shading. (C,D) Dwell times of FRET states as represented by empirical cumulative distribution functions for the WT (C) or A315T (D) LCD grouped by the FRET state bin. From the idealized FRET traces, the dwell times were measured as the duration of each FRET event and grouped by the FRET bin as in Figure 3C, and further grouped by incubation condition as indicated by the color. For each bin, the dwell times under each incubation condition were fitted to single exponential models (see Supplemental Fig. S3). From the fitted models, the estimated dwell time half-lives (s), t1⁄2, are displayed, and uncertainties reported as 95% credible intervals in parentheses.




