


Nanopore sequencing of internal 2′-PO4 modifications installed by RNA repair
- Department of Biochemistry and Molecular Genetics, RNA Bioscience Initiative, University of Colorado School of Medicine, Aurora, Colorado 80045, USA
- Corresponding author: jay.hesselberth{at}cuanschutz.edu
Abstract
Ligation by plant and fungal RNA ligases yields an internal 2′-phosphate group on each RNA ligation product. In budding yeast, this covalent mark occurs at the splice junction of two targets of ligation: intron-containing tRNAs and the messenger RNA HAC1. The repertoire of RNA molecules repaired by RNA ligation has not been explored due to a lack of unbiased approaches for identifying RNA ligation products. Here, we define several unique signals produced by 2′-phosphorylated RNAs during nanopore sequencing. A 2′-phosphate at the splice junction of HAC1 mRNA inhibits 5′ → 3′ degradation, enabling detection of decay intermediates in yeast RNA repair mutants by nanopore sequencing. During direct RNA sequencing, intact 2′-phosphorylated RNAs on HAC1 and tRNAs produce diagnostic changes in nanopore current properties and base calling features, including stalls produced as the modified RNA translocates through the nanopore motor protein. These approaches enable directed studies to identify novel RNA repair events in other contexts.
Keywords
INTRODUCTION
RNA ligases play a key role in the repair of endonuclease-damaged RNA (Amitsur et al. 1987). In fungi and plants, Trl1 joins the exons of intron-containing tRNAs after intron excision by the tRNA splicing endonuclease (Phizicky et al. 1992). The prokaryotic and metazoan RNA ligase RtcB catalyzes repair of endonuclease-cleaved tRNAs to effect tRNA splicing (Tanaka et al. 2011), and like Trl1, activates the unfolded protein response in animals (Sidrauski et al. 1996; Kosmaczewski et al. 2014). Although RtcB and Trl1 act on a shared set of RNA substrates with identical end chemistry, the biochemistry of ligation differs between the two enzymes. While RtcB ligation yields a 3′–5′ phosphodiester linkage (Chakravarty et al. 2012), plant and fungal ligases produce a 2′-phosphate at the ligation junction, marking the site of RNA repair (Greer et al. 1983). Despite extensive mechanistic study of these two ligases, the complete repertoire of RNA substrates repaired by either of these two enzymes has not been explored due to a lack of unbiased approaches for detecting RNA ligation products.
The 2′-phosphate products of Trl1 ligation are removed by the 2′-phosphotransferase Tpt1 (Culver et al. 1997); in the absence of this enzyme, 2′-phosphates are a persistent and site-specific indicator of RNA repair. To investigate the role of RNA repair in eukaryotes, we previously generated a genetic bypass of S. cerevisiae TRL1 and TPT1 by expressing intronless versions of all ten intron-containing yeast tRNAs (Cherry et al. 2018), and used these cells to investigate how RNA repair enzymes regulate the non canonical splicing of HAC1, a messenger RNA encoding a transcription factor that activates the unfolded protein response (UPR) (Sidrauski et al. 1996). We showed that the 2′-phosphate on ligated HAC1 mRNA in xrn1Δ tpt1Δ cells protects its 3′-exon from degradation by Xrn1, raising the possibility that the 2′-phosphates produced by Trl1 ligation might directly inhibit this exonuclease (Cherry et al. 2019).
Nanopore sequencing enables simultaneous analysis of the sequence and modifications of native RNA molecules. In budding yeast, this approach has been used to identify sites of methylation (m6A and 2′-O-methylation) and pseudouridylation in mRNAs, rRNA, and some noncoding RNAs (Liu et al. 2019; Begik et al. 2021; Leger et al. 2021; Stephenson et al. 2022). Technical hurdles associated with direct RNA sequencing of tRNA, the most highly modified class of RNA, were recently overcome by a strategy used to sequence E. coli tRNA (Thomas et al. 2021). Here, we apply nanopore direct RNA sequencing of exonuclease-resistant RNAs, tRNAs, mRNA, and modified synthetic oligonucleotide standards, generating proof of concept for detecting 2′-phosphates directly in nanopore sequencing. This strategy can be leveraged to identify 2′-phosphorylated RNAs produced by RNA phosphorylation or during RNA repair.
RESULTS AND DISCUSSION
2′-phosphate modifications are sufficient to inhibit 5′ → 3′ exoribonucleases
Our studies of HAC1 mRNA processing in the UPR revealed that 2′-phosphorylated RNA processing intermediates are resistant to 5′ → 3′ exonucleolytic degradation by Xrn1 (Fig. 1A; Cherry et al. 2019), resonating with the previous finding that 2′-phosphates inhibit a bacterial 3′ → 5′ exonuclease (Munir et al. 2018). This effect is generalizable to the other known substrates of Trl1, intron-containing tRNAs, as Xrn1 digestion of total RNA results in the accumulation of the spliced tRNA intermediates solely in a strain where Trl1 is active but the 2′-phosphotransferase Tpt1 is absent. These tpt1Δ cells, which have been genetically bypassed with the 10x intronless tRNA plasmid (“10x”), accumulated spliced, endogenous tRNAs marked by a 2′-phosphate at the site of ligation, which protects their 3′-exons from Xrn1 digestion (Fig. 1B). We reconstituted 2′-phosphate-mediated exonuclease stalling in vitro by digesting synthetic RNAs with 2′-phosphate (Lackey and Damha 2008) or 2′-O-methyl modifications with recombinant 5′ → 3′ exonucleases (Fig. 1C,D; Chapman et al. 2014; MacFadden et al. 2018), confirming that 2′-phosphates are sufficient to inhibit multiple 5′ → 3′ exonucleases, and provide more protection than a 2′-O-methyl group. DxoI and RNase J1 stall 1–3 nt upstream of the 2′-phosphorylated site, while Xrn1 is capable of digesting an RNA up to the 2′-phosphorylated nucleotide (Supplemental Fig. S1a,b). We found that these 5′,2′-phosphorylated RNAs are poor substrates for ligation (Supplemental Fig. S1c), precluding a standard approach to identify 5′-ends (Harigaya and Parker 2012).
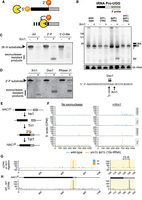
In vitro digestion with recombinant exonucleases reveals sites of 2′-phosphorylation. (A) Digestion of 2′-phosphorylated RNA by Xrn1 yields a product that inhibits further degradation. (B) The 2′-phosphate on tRNA-Pro-UGG can be detected by northern blotting for 3′-exon in total RNA from RNA repair strains treated with and without recombinant Xrn1 in vitro. In the lower panel, the same membrane has been stripped and reprobed for 5S rRNA as a loading control. Asterisks correspond to previously described but uncharacterized Pro-TGG splicing intermediates (Spinelli et al. 1997; Cherry et al. 2018). (C) Unmodified, 2′-phosphorylated, and 2′-O-methylated RNA substrates show varying levels of resistance to Xrn1 after a 2 h digestion and imaging on a stained denaturing gel. (D) A 2′-phosphate inhibits decay by the 5′ → 3′ exonucleases Xrn1, Dxo1, and RNase J1. Enzymatic digestion intermediates were interrogated as in C, with multiple exonucleases. The location of the 2′-phosphorylated linkage is indicated by the red “G” in the substrate at right, with inferred stalling sites for each exonuclease marked with arrows. (E) In budding yeast, the unfolded protein response (UPR) initiates a noncanonical splicing event on the mRNA HAC1 during which the endonuclease Ire1 excises the HAC1 intron (thin line), followed by exon ligation by Trl1 (black and gray boxes), generating an internal 2′-phosphate at the splice junction that is subsequently removed by the 2′-phosphotransferase Tpt1. (F) RNA from WT and xrn1Δ tpt1Δ (10×-tRNA) cells was treated with DMSO or tunicamycin (Tm) and left untreated (left panel) or enzymatically digested (right panel) followed by nanopore sequencing. 5′-end alignments of reads are expressed in counts per million reads (CPM). (G) Subtraction of undigested background 5′-end signal in F from the corresponding signal in the Tm-treated, rXrn1-digested libraries in F, yields a predominant single nucleotide peak on HAC1s at the splice junction (yellow box). At right, an enhanced view of this region shows that the major peak in wild-type cells is located precisely at the exon–exon junction (position 727), whereas the end signal in the mutant is 13 nt downstream, an offset consistent with premature termination of base calling when a bona fide 5′ RNA end exits a nanopore. (H) The wild-type rXrn1 enrichment scores above have been subtracted from the mutant scores at each nucleotide position.
Nanopore sequencing of Xrn1-degraded RNA identifies 2′-phosphates produced during HAC1 splicing
We asked whether Xrn1 treatment of total RNA could enhance the 5′-end signal on Trl1 substrates in RNA sequencing libraries. We treated wild-type and xrn1Δ tpt1Δ cells with either DMSO or tunicamycin (Tm), which inhibits N-linked glycosylation and induces the UPR, triggering the endonuclease Ire1 to excise the intron from unspliced, cytoplasmic HAC1 pre-mRNA (HAC1u) (Fig. 1E). The exon halves are ligated by Trl1 (Sidrauski et al. 1996), yielding a spliced mRNA molecule (HAC1s) bearing an internal 2′-phosphate at the ligation junction (nucleotide 727 in HAC1s) that is removed by the 2′-phosphotransferase Tpt1 (Culver et al. 1997). In tpt1Δ cells, the 2′-phosphate stabilizes HAC1s against 5′ → 3′ exonucleolytic degradation (Cherry et al. 2019).
We treated total RNA with mRNA decapping enzyme (Paquette et al. 2018) to generate 5′-monophosphate ends, digested these RNAs with recombinant Xrn1 (rXrn1), and prepared libraries for direct mRNA nanopore sequencing (Supplemental Tables S1, S2). After base calling, 5′-read ends from each library were aligned to a budding yeast transcriptome containing both HAC1u and HAC1s. Consistent with previous results (Cherry et al. 2019), HAC1 3′-exon termini accumulate in xrn1Δ tpt1Δ cells even in the absence of tunicamycin and are enriched upon Xrn1 treatment (Fig. 1F). Comparative analysis of signal from tunicamycin-treated samples confirmed this enrichment is strongly dependent on genotype; the largest change in 5′-end coverage occurs in the xrn1Δ tpt1Δ mutant, and this single nucleotide peak is located 13 nt downstream from the HAC1 splice junction (Fig. 1G), an offset consistent with premature termination of base calling when a bona fide 5′-end exits the pore (Ibrahim et al. 2021). Subtracting the wild-type control from the mutant signal (Fig. 1H) showed that the largest genotype-specific change in 5′-end signal upon exonuclease treatment is the peak at nucleotide 740, consistent with 2′-phosphate mediated inhibition of Xrn1 degradation with single nucleotide resolution.
RNA repair generates localized base calling errors on HAC1
We next asked whether we could directly detect 2′-phosphates produced during HAC1 splicing without the use of exonuclease treatment. In principle, direct RNA sequencing can be used to detect any RNA modification that produces an alteration in current as the modified nucleotide passes through the nanopore sensor (Garalde et al. 2018). These distortions affect the accuracy of base calling, generating base calling “errors” in the form of mismatches at or near the modified position. However, detection and discrimination of modified nucleotides can be strongly affected by (i) the RNA modification type, (ii) the sequence context in which the modification occurs, and (iii) the stoichiometry of the modification (Begik et al. 2021; Leger et al. 2021).
Inspection of all reads aligning to HAC1s from tunicamycin-treated cells identified several positions with high rates of mismatched nucleotides, suggesting the presence of an RNA modification (Fig. 2A). While several of these exceed rates of 20% mismatching (e.g., 20% of reads spanning a site contain a mismatch at that position) in both the wild-type and mutant sample, a unique pattern of base calling errors occurs in the xrn1Δ tpt1Δ mutant, and is centered on the HAC1s splice junction. At this location, the 2′-phosphorylated guanosine is miscalled 3% of the time, but mismatch rates for the four flanking nucleotides in the 5mer centered on this position range from 14%–29% (Fig. 2B; Supplemental Fig. S2). These high rates of mismatching were specific to the 2′-phosphate accumulating mutant, and subtracting these rates at a per-nucleotide level yields a strong signal at nucleotides flanking the splice junction (Fig. 2C,D). When this change in mismatching between both samples is converted to a mean change across a 5 nt window, the predominant signal on HAC1s is a peak centered at the 2′-phosphorylated nucleotide (Fig. 2E,F). This signal was accompanied by a localized drop in the per-nucleotide quality score at the HAC1s ligation junction (Fig. 2G), with the lowest values at the 2′-phosphorylated guanosine (position 727, red asterisk) in xrn1Δ tpt1Δ cells, indicating the base caller's reduced confidence in its ability to correctly identify the nucleotides in this region.
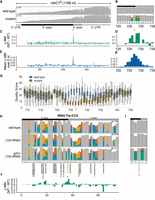
Nanopore sequencing enables direct detection of known 2′-phosphates deposited by Trl1 ligation in vivo. (A) Coverage of reads from Tm-treated, undigested mRNA libraries from wild-type and xrn1Δ tpt1Δ (10×-tRNA) cells (“mutant”) aligned to HAC1s. Bar heights quantify read coverage (y-limits, upper left). Colored bars represent positions with >20% mismatching to the reference base; gray bars indicate positions that did not exceed this threshold. (B) An enhanced view of the splice junction at right shows mutant-specific mismatches at nucleotides flanking the 2′-phosphorylated guanosine. (C) Difference in percent of reads aligned to HAC1s between the strains above shows the highest differences in mismatching flanking the splice junction (orange asterisk), as seen in the enhanced view in panel D. (E) Plotting the mean Δ mismatch value over a 5 nt window yields a peak centered at the 2′-phosphorylated position, enhanced in panel F. (G) Base calling quality scores over this region show a reduction in base calling in mutant RNA centered on the 2′-phosphorylated position (orange asterisk). (H) The 2′-phosphate on tRNA-Trp-CCA can be detected by anticodon-proximal mismatches in tRNA sequencing reads mapping to the mature tRNA reference. Each colored bar represents a position with >20% mismatching to the reference base; gray bars indicate positions which did not exceed this threshold. Modified positions reported in MODOMICS (Boccaletto et al. 2022) are annotated below the reference sequence, with the 2′-phosphate indicated in red text. Values in brackets represent the range of coverage in raw read counts across the entire tRNA. (I) Close-up of the 5 nt centered on the 2′-phosphorylated adenosine (*) located at the tRNA-Trp-CCA splice junction. (J) Difference in percentage of reads aligned to tRNA-Trp-CCA between tpt1Δ (10×) cells and w303 cells expressing the 10×-tRNA plasmid. 2′-phosphorylated positions are indicated with asterisks across these figure panels.
Complex modifications of tRNA complicate detection of RNA repair signals
We wondered whether such signals were present on intron-containing tRNAs ligated by Trl1. Budding yeast tRNAs contain an average of 13 modifications per tRNA species deposited across 36 different modified positions (Phizicky and Hopper 2010). The nucleotide immediately 3′ of the tRNA anticodon, termed the “hypermodified base,” is modified >55% of the time in budding yeast (Boccaletto et al. 2022); on intron-containing tRNAs, this same nucleotide is also 2′-phosphorylated during tRNA splicing (Supplemental Fig. S3a). Our examination of the modifications present within all ten intron-containing budding yeast tRNAs in the 5 nt window surrounding this position found that only tryptophan tRNAs lack an annotated modification at the hypermodified base (Supplemental Fig. S3b,c); therefore, we focused on Trp-CCA to determine whether it was possible to directly detect 2′-phosphates on tRNAs. We adapted a method (Thomas et al. 2021) to ligate adapters to purified tRNA in preparation for direct RNA sequencing. While the average spliced tRNA in our tRNA sequencing libraries contained >28 positions where mismatch rates exceeded 20% (Supplemental Fig. S3d), we observed a clear TPT1-dependent base calling error signature on Trp-CCA tRNA (Fig. 2H,I), consisting of a genotype-specific increase in mismatching at nucleotides flanking the 2′-phosphorylated splice junction (Fig. 2J).
Although splicing of intron-containing tRNAs is an absolute requirement for their use in translation, the reasons why some tRNAs have introns and others do not remain unclear. tRNA introns have been systematically removed in S. cerevisiae, demonstrating that introns are dispensable for cell survival, but as expected, tRNAs in these cells lose tRNA modifications that are deposited on intron-containing pre-tRNAs prior to splicing (Hayashi et al. 2019). Such modifications include pseudouridylation of Ile-UAU at nucleotides 34 and 36, which is catalyzed by the pseudouridine synthetase Pus1 specifically on pre-tRNAs (Szweykowska-Kulinska et al. 1994; Motorin et al. 1998). In the absence of an intron, Ile-UAU tRNAs lose pseudouridylation at intron-dependent sites, and nucleotide 34 is instead modified to 5-carbamoylmethyluridine (Hayashi et al. 2019). Thus, the process of tRNA splicing likely plays an important role not only in regulating the deposition of specific modifications, but also in preventing mis-modification of tRNAs, with implications for both tRNA stability and translational fidelity.
Previous nanopore sequencing of E. coli tRNAs identified base calling errors in the form of mismatches at or near several known modified nucleotides (Thomas et al. 2021). However, some known tRNA modification sites lacked detectable miscalling signatures, and more generally, the specific signals produced by many of the >170 known RNA modifications in direct RNA sequencing data remain uncharacterized (White and Hesselberth 2022). The analysis of tRNA modifications by direct RNA sequencing is complicated by the fact that current nanopore analysis approaches are inadequate to capture combinations of multiple modification types within the same RNA (Begik et al. 2022). However, recent efforts to classify RNA nucleotides as either modified or unmodified (independent of modification type) has shown some success, especially when paired with genetic deletion or perturbation of modification enzymes (Bailey et al. 2022).
We took a similar approach to explore modification signals within our tRNA sequencing data, comparing the per-nucleotide frequency of mismatching on each intron containing tRNA across multiple mutants in budding yeast (Fig. 3). This enabled us to ask whether rates of alignment at known sites of tRNA modification—particularly modifications that are specifically deposited before or after tRNA intron removal—are altered in cells where tRNA splicing has been bypassed via expression of intronless tRNAs. Subtracting wild-type mismatch signal from the equivalent signal in wild-type cells expressing only the 10x-tRNA plasmid yields a negative value at a pseudouridine modification whose deposition is dependent on the presence of an intron (nucleotide 37 on Tyr-GUA tRNA). In contrast, nucleotide 34 of Ile-UAU, which is pseudouridylated in the presence of an intron but 5-carbamoylmethyluridylated in its absence (Hayashi et al. 2019), has a higher frequency of mismatching when prespliced tRNAs are expressed from a plasmid in addition to the genomically encoded intron-containing tRNAs. This signal may reflect this known mis-modification event (5-carbamoylmethyluridylation) and/or 2′-phosphorylation of nucleotide 37. Furthermore, known tRNA modifications that are deposited on mature tRNAs after splicing but which can also be deposited on intronless tRNAs in vitro, such as 2′-O-methylation of cytidines 31 and 33 on Trp-CCA tRNAs (Jiang et al. 1997; Pintard et al. 2002), do not show major changes in mismatching, consistent with the expectation that prespliced tRNAs expressed from the 10x-tRNA plasmid should be appropriately modified at these positions. Cells expressing prespliced tRNAs also showed decreased mismatching at nucleotides flanking the site of a 5-methylcytidine modification that is deposited on intron-containing pre-tRNA Phe-GAA prior to splicing, but the situation is less clear at a second intron-dependent 5-methylcytidine on Leu-CAA; together, these results are consistent with mismatch signatures observed at 5mC RNA modifications by Begik et al. (2021), which were more likely to affect neighboring nucleotides and showed greater dependence on sequence context than pseudouridine signals.
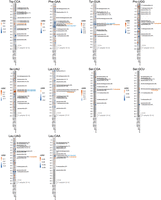
Changes in mismatch frequency across tRNA processing mutants identify modifications associated with tRNA splicing. Comparison of mismatch frequency (ΔMM) from cells expressing only genome-encoded tRNAs or a combination of fully or partially processed genome-encoded tRNAs and “prespliced” tRNAs from the 10×-tRNA plasmid. Strain comparisons are indicated at the bottom of the heat map for each tRNA, with modified positions reported in MODOMICS (Boccaletto et al. 2022) annotated at right, with specific modifications known to be dependent on the presence/removal of a tRNA intron highlighted alongside. Positive values (red boxes) indicate mismatch signals (and by extension, candidate tRNA modifications) whose abundance increases when tRNA splicing is perturbed, while negative values (blue boxes) are produced by an analogous drop in mismatching, as might be produced by intron- or splicing-dependent tRNA modifications. Gray boxes indicate nucleotides with <20 reads aligning in at least one library; no mismatch frequency has been calculated at these low coverage positions.
We further compared mismatch rates across tRNAs from tpt1Δ, xrn1Δ tpt1Δ, and xrn1Δ cells expressing prespliced tRNAs from the 10x-tRNA plasmid, taking advantage of the fact that xrn1Δ cells accumulate unstable and often hypomodified tRNAs that would otherwise be degraded by the rapid tRNA decay pathway (Whipple et al. 2011). As previously discussed, accumulation of 2′-phosphates on Trp-CCA tRNAs results in a higher frequency of nucleotides that do not match the reference sequence, and on this tRNA isodecoder, there are no additional known modifications at the tRNA splice junction (nt 36). In addition, several other tRNAs with potential confounding modifications also show a similar pattern, including Ile-UAU, Lys-UUU, and Ser-GCU. Interestingly, Ser-CGA and Ser-GCU tRNAs were some of the least abundant isodecoders recovered in the tpt1Δ strain, and thus could only be analyzed in the xrn1Δ tpt1Δ (10x) library, suggesting that either prespliced serine tRNAs, 2′-phosphorylated tRNAs or both may be unstable. Consistent with this interpretation of our data, hypomodified Ser-CGA and Ser-GCU are known substrates of the Xrn1-mediated rapid tRNA decay pathway (Chernyakov et al. 2008; Kotelawala et al. 2008; Dewe et al. 2012).
Excluding putative 2′-phosphate signals, the only other site-specific increases in mismatching (Δ mismatch) across multiple strain comparisons occurred at known pseudouridylation sites within the TΨC loop of Phe-GAA and Tyr-GUA tRNAs. In this analysis, positive changes in mismatch frequencies (indicated in red on the heat maps) across all strain comparisons can be interpreted as RNA modifications whose abundance increases when tRNA splicing is altered via expression of prespliced tRNAs and/or TPT1 bypass. These single nucleotide increases in mismatching (primarily U-to-C mismatches) are visible when wild-type mismatch frequency is subtracted from the same signal in cells also expressing prespliced tRNAs and become more dramatic in tpt1Δ cells. Pseudouridylation of tRNA nucleotide 55 is conserved across species and is deposited by the PUS4 synthetase (TRUB1 in mammals) (Becker et al. 1997; Mukhopadhyay et al. 2021). This result suggests a potential role for tRNA splicing in modulating the levels of this conserved tRNA modification.
The converse signal, a negative Δ mismatch value, was far more abundant on all tRNAs examined. For these strain comparisons, a negative change in mismatch frequencies is consistent with an RNA modification whose abundance decreases when tRNA splicing is perturbed. In addition to the validation of the intron-dependent pseudouridylation and methylation signals mentioned above, several sites of tRNA modification not known to be dependent on tRNA splicing also display signals that may be consistent with lower modification stoichiometries when cells are expressing intronless tRNAs, and lower still when tRNA splicing is disrupted in the context of TPT1 bypass. In particular, the signals at pseudouridine sites on three tRNAs (Trp-CCA nt 64, Phe-GAA nt 39, and Lys-UUU nt 1) all represent candidate intron-dependent modifications. These and other signals with more complex patterns of mismatching merit further investigation. While future improvements to nanopore sequencing and analysis approaches may refine our ability to deconvolute multiple RNA modifications within the same molecule, these data provide proof of concept for leveraging nanopore base calling errors to explore the complex biology of tRNA modification.
Covalent marks of RNA repair produce distortions in nanopore signal intensity
While base calling errors are commonly used to detect modifications from direct RNA-seq data, a more direct method is to examine the effects of RNA modifications on raw nanopore signal intensity. Both of these approaches have been exploited in the development of computational tools to detect and quantify RNA modifications (Furlan et al. 2021). We used Nanopolish (Loman et al. 2015) to annotate the reads aligning to HAC1s with the level of ionic current observed as individual ribonucleotides pass through the center of the nanopore sensor. The largest difference in mean current intensity between our wild-type and mutant samples was located precisely at the 2′-phosphorylated guanosine (Fig. 4A). Plotting per-read signal revealed substantial divergence in current intensity within a 15 nt window surrounding the HAC1s splice junction (Fig. 4B). Principal component analysis of the per-read current intensities over this region and a density plot of all current intensities within the same window show significant differences between the wild-type and mutant signals (Fig. 4C,D) indicating that deviation in current intensity provides useful information to detect 2′-phosphate modifications.
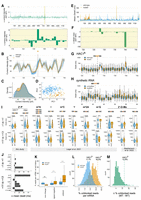
Current and base calling features of 2′-phosphorylation and other RNA modifications. (A) Change in mean current intensity across the spliced HAC1s transcript (upper panel) and at the splice junction (lower panel, 2′-phosphorylated position marked with asterisk). (B) Per-read current intensities at the HAC1s splice junction. The dotted gray lines define a 15 nt window corresponding to the approximate footprint of the nanopore and docked motor protein when the 2′-phosphorylated nucleotide (vertical dashed black line, position 727) is centered in the reader head of the nanopore. (C) Distribution of current intensities across all reads within this 15 nt window. (D) Principal components analysis of current intensity values across the 15 nt window surrounding the splice site. (E) Mean dwell time in milliseconds for each nucleotide across HAC1s. (F) Difference in dwell time between WT and mutant samples within the region surrounding the HAC1 splice junction. (G) Distribution of per-read dwell times in WT and mutant samples over this same region, with the HAC1 splice junction indicated by a vertical dashed line. (H) Difference in dwell time on reads aligning to a synthetic RNA within the region surrounding the 2′-phosphorylated or unmodified position (vertical dashed line). (I) Violin plots of the distribution of per-read dwell times within a 3 nt window surrounding a modified position (upper row) or a 3 nt window +11 nt in the 3′ direction on the same RNA substrates. Overlaid box plots define the median and interquartile range. Above each stacked pair of plots, the sequence context(s) for each modification are indicated with the modified nucleotide in red. (J) The difference in dwell times for all modifications in I was calculated by subtracting the mean dwell for modified RNA versus the mean dwell from the unmodified libraries, over the same 3 nt windows. 2′-phosphate, m6A, and 2′-O-methyl means were calculated across multiple sequence contexts. (K) Box plots showing the percent of aligned reads per mRNA in UPR-stressed cells that did not report a successful positive signal at termination, with the alternative end reasons on the x-axis. (L) Histogram displaying the percent of reads per mRNA in WT or mutant libraries with the “unblock” end status. In this plot, only mRNAs with ≥30 total reads are visualized. Vertical dashed blue and orange lines indicate the percent of unblocked reads aligning to HAC1s in the WT and mutant samples, respectively. (M) For each mRNA in L, the percent of unblocked reads in the WT sample was subtracted from the corresponding percentage in the mutant sample. The location of HAC1s on this histogram is indicated with a vertical dashed green line.
RNA repair generates detectable stalls during pore translocation
An additional direct output of nanopore sequencing is dwell, the residence time of an individual nucleotide within the nanopore sensor. Previous reports described varying utility of dwell time for detecting specific RNA modifications (Begik et al. 2021; Fleming et al. 2021; Leger et al. 2021; Stephenson et al. 2022). In xrn1Δ tpt1Δ cells, we observed a >150 millisecond increase in dwell 13 nt 3′ of the HAC1s ligation junction (Fig. 4E,F). As RNA is threaded into the nanopore in the 3′ → 5′ direction by a helicase, we infer that this stalling occurs before the 2′-phosphate has entered the nanopore channel and reflects interactions between the modification and the motor protein, similar to 2′-O-methyl and pseudouridine modifications (Fleming et al. 2021; Stephenson et al. 2022). To validate this finding, we examined the distribution of dwell times in RNA sequencing reads over the HAC1 splice junction (Fig. 4G), and performed direct RNA-seq on a synthetic RNA substrate, which also showed a 128 millisecond increase in mean dwell at position +11 nt (Fig. 4H; Supplemental Figs. S4, S5).
To contextualize the magnitude and specificity of this effect, we reanalyzed nanopore dwell times on modified and unmodified oligonucleotides (Leger et al. 2021) and at select modified sites on native budding yeast rRNA versus an in vitro transcribed control (Stephenson et al. 2022). Among eight different RNA modifications, only 2′-phosphorylation, N6,N6-dimethylation (m62A), and 2′-O-methylation produced statistically significant changes in dwell times at 3′ distal sites located +11–13 nt from the RNA modification (Fig. 4I). 2′-phosphates generated the largest increases in mean dwell time of all modifications analyzed (Fig. 4J), suggesting that dwell time is a robust signal for the detection of RNA repair events. While this analysis covers only a small repertoire of sequence contexts, our results suggest that approaches for de novo detection of RNA modifications in direct RNA-seq data may be improved by incorporation of distal stalling signals produced as RNA modifications traverse the nanopore motor protein (Supplemental Fig. S6).
Nanopore sequencing devices can manipulate individual nanopores wherein nucleic acids become stalled by reversing the local electric potential in an attempt to eject the stalled molecule. Figure 4K shows the percentage of aligned reads per mRNA that terminated unexpectedly. We found a statistically significant increase in reads terminated due to negative signal and unblocking events in xrn1Δ tpt1Δ cells treated with tunicamycin, suggesting additional products of RNA repair. To explore this further, we selected mRNAs with sufficient coverage, and calculated the percent of reads per mRNA with this “unblock” status. We found a 14% increase in reads aligning to HAC1s that terminated in an unblocking event in xrn1Δ tpt1Δ cells compared to wild-type (Fig. 4L). We calculated the strain-specific difference in percent of reads terminated by unblocking for all remaining mRNAs, and found 45 mRNAs with a higher proportion of unblocked reads than HAC1s (Fig. 4M; Supplemental Table S3). Such RNAs could represent candidate RNAs that are ligated upon unfolded protein stress. However, further inspection of base calling error, quality score, dwell time, and current intensity across these mRNAs did not identify any combined set of signals (e.g., an increase in dwell time accompanied by offset changes in base calling error or current intensity) consistent with site-specific 2′-phosphorylation.
This sequencing approach allowed us to characterize 2′-phosphate signals on RNAs known to be ligated by Trl1 in budding yeast, but did not identify novel mRNA candidates ligated by Trl1. However, there are several caveats in applying this method to the detection (or exclusion) of de novo RNA repair events. First, in the absence of Tpt1, all spliced HAC1 mRNAs (and spliced tRNAs) retain a 2′-phosphate, meaning that 100% of reads aligning to these RNAs are predicted to be modified. However, this 100% modification stoichiometry cannot be assumed when attempting to identify or rule out the presence of additional unknown RNA targets of Trl1. To test our ability to identify repaired RNAs in a mixed population of repaired and unrepaired RNA substrates, we sequenced an equimolar pool of unmodified and 2′-phosphorylated reads and compared the observed dwell times (Supplemental Fig. S7), since dwell produced the most dramatic signals of 2′-phosphorylation on 100% modified RNAs. Although this 50/50 pool still produced statistically significant differences in dwell compared to an unmodified sample, the median dwell time at the 3′-distal peak dropped from 92 msec in the 100% modified sample to 21 msec in the 50% modified sample, as compared to 18 msec in the unmodified control (Supplemental Fig. S7b). A second, equally important caveat is while Trl1's ligation of HAC1 and tRNAs is site-specific, this eukaryotic RNA ligase efficiently joins the 5′-hydroxyl and 2′,3′-cyclic phosphate products of RNA cleavage without further substrate specificity beyond RNA end chemistry (Nandakumar et al. 2008). Thus, the ligation of distributed (as opposed to nucleotide-specific) RNA cleavage events might also mask 2′-phosphorylation signals in direct RNA sequencing data. Finally, as the number of known RNA repair events are limited and this modification cannot be installed by in vitro transcription or routinely synthesized, we are limited in our ability to evaluate the generalizability of these nanopore signals to RNA repair events in different sequence contexts, and by extension, develop a computational approach to predict these modifications de novo. As several of these hurdles are not unique to 2′-phosphates, addressing these combined challenges to de novo modification detection is the subject of future investigation both in our laboratory and for the broader RNA community.
In principle, 170 RNA modifications (Boccaletto et al. 2022) are detectable by direct RNA sequencing. However, the specific signals produced by a modification in all RNA sequence contexts and the threshold of detection for a given modification require synthetic and genetic controls, as well as high depth sequencing coverage (Leger et al. 2021). Even high stoichiometry modifications (e.g., rRNA 2′-O-methylation) produce strong current intensity distortions in some sequence contexts but not in others (Begik et al. 2021). Accordingly, the development of tools capable of integrating and comparing multiple types of direct RNA-seq signals is an area of active investigation (Furlan et al. 2021). In this work, we define a collection of signals produced by 2′-phosphates in nanopore sequencing that represent a diagnostic signature of RNA repair by fungal ligase on the mRNA HAC1, and report the first direct RNA sequencing of eukaryotic tRNA. The recent finding that 2′-phosphates can also be deposited via phosphorylation (Ohira et al. 2022) and the unknown role of animal 2′-phosphotransferase (Harding et al. 2008) highlight the potential for characterizing this RNA modification in additional biological contexts.
MATERIALS AND METHODS
Exonuclease digestion of synthetic RNA substrates
All exonucleases were purified as described in MacFadden et al. (2018). Equimolar amounts of the 26 nt synthetic oligo substrates bearing a 2′-phosphate (ChemGenes), 2′-O-methyl (IDT) or no modification (IDT) in Supplemental Table S4 were resuspended in 20 µL reactions containing either 1 µL of water or 1 µL of recombinant exonuclease at the following concentrations: RNaseJ1 = 1.1 mg/mL; Xrn1 = 0.8 mg/mL; Dxo1 = 0.68 mg/mL. These digestion reactions were incubated at 37°C for 2 h in a standard buffer containing 100 mM NaCl, 50 mM Tris, 2 mM MgCl2 pH 7.9, and 1 mM DTT. An equal volume of 2× formamide loading dye was added to quench the reactions before running on a precast 15% TBE-urea acrylamide gel for 20 min at 125V, followed by 25 min at 175V. Gels were stained with SybrGold (Thermo Fisher) and visualized on a BioRad Gel Doc imager.
Yeast cell culture and RNA isolation
All cultures were inoculated from single colonies in synthetic drop-out media supplemented with relevant amino acids to maintain plasmid selection. Cells were grown at 30°C to mid-log phase (OD600 = 0.3–0.8) and, where indicated, treated for 2 h with tunicamycin (Sigma-Aldrich, final concentration of 2.5 µg/mL) or an equal concentration of DMSO. After centrifugation, total RNA was isolated by hot acid phenol extraction. All yeast strains used in this study are listed in Supplemental Table S5.
Exonuclease-digested tRNA northern blots
Total RNA (15 µg) was digested in 100 mM NaCl, 50 mM Tris, 2 mM MgCl2 pH 7.9, and 1 mM DTT in 11 µL reactions containing 1 µL of rXrn1 at 1.1 mg/mL or 1 µL of DEPC H20 for 18 h at 37°C, and reactions stopped by addition of an equal volume of formamide loading dye. An amount of 5 µg of this total RNA input was loaded onto a precast 10% TBU acrylamide urea gel (Novex/Thermo Fisher) and electrophoresed at 120 V for 15 min, followed by 170 V for 60 min. After staining and imaging, the gel was transferred at 3 mA/cm2 for 35 min to a charged nylon membrane (Hybond N+, GE) and UV crosslinked with a 120 mJ dose at 254 nm. The membrane was then blocked in Ambion ULTRAhyb-Oligo Buffer before incubating for 18 h with a 5′-32P-labeled probe (Supplemental Table S3) designed to hybridize to the 3′-exon of intron-containing tRNAs. After four 15 min washes with 2× SSC/0.5% SDS washing buffer, the membrane was wrapped in plastic, exposed on a phosphor-imager screen, and subsequently imaged on a Typhoon 9400 (GE Healthcare). To reprobe, the membrane was washed twice in 2% SDS at 80°C for 30 min per wash, reblocked, and then incubated with a new probe as before.
Preparation of exonuclease-degraded RNA for mRNA-seq
To prepare exonuclease-degraded mRNA, 200 µg of total RNA was decapped with mRNA decapping enzyme (New England Biolabs) for 1 h at 37°C, ethanol precipitated, resuspended, and split into two 20 µL reactions in the buffer described above, with or without 2 µL of recombinant Xrn1 (1.1 mg/mL). Decapped RNA was incubated at 37°C for 5–18 h, and degraded samples with RIN scores ranging from 1.5–4.5 as measured by TapeStation using an Agilent High Sensitivity ScreenTape were selected for further library preparation. The resulting samples were treated with phenol chloroform and ethanol precipitated before poly(A) selection using Dynabeads Oligo (dT)25 mRNA isolation beads (Thermo Fisher Scientific). Yields were assayed by Nanodrop, and 500 ng of the resulting poly(A) selected RNA was used as input for direct RNA-seq (Oxford Nanopore, SQK-RNA002).
Direct mRNA-seq Nanopore libraries
The remaining mRNA-sequencing libraries were prepared as above, without a decapping or exonuclease degradation step. Select mRNA-seq libraries were ligated to the four custom barcoded DNA adapters described in Smith et al. (2020) in lieu of the commercial RTA adapter from Oxford Nanopore. Libraries were pooled after reverse transcription and subsequent AMPure XP bead cleanup to prevent cross-ligation of barcodes. Following sequencing and base calling, all reads were assigned to one of the four barcodes or an unknown barcode bin using the DeePlexiCon software (Smith et al. 2020), and FASTQ files were separated by barcode. Reads with a confidence score of 95% or higher probability of correct barcode assignment were used for downstream analysis.
Synthetic RNA libraries
We used a splinted ligation strategy (Supplemental Fig. S4A) to generate 2′-phosphate-containing synthetic RNA substrates for nanopore sequencing. We designed a DNA splint to ligate the 2′-phosphorylated or unmodified 26 nt synthetic oligo substrates to the 5′ oligo AB (to prevent 5′-end signal artifacts near the modified position) and to the 3′ oligo CD, which contains a polyadenylated end competent for ligation by the ONT RTA adapter. Ligation with T4 RNL2 (New England Biolabs) was performed at a threefold molar excess of RNA substrates to DNA splint, DNase I treated, and then run on a 16 cm × 16 cm × 0.75 mm 10% denaturing gel before staining, imaging, and tight excision of the 86 nt product, which was extruded through a hole punctured in a 0.5 mL centrifuge tube and eluted overnight at 4°C with rotation in a buffer of 300 mM sodium acetate, 1 mM EDTA, and 0.1% SDS, followed by filtration through a 0.22 µM pore Costar Spin-X centrifuge tube filter and ethanol precipitation. Purified RNAs (300–400 ng) were used as input for direct RNA sequencing. All oligos aside from the 26 mers described previously were purchased from Integrated DNA Technologies and are detailed in Supplemental Table S4.
tRNA sequencing
Saccharomyces cerevisiae tRNAs were size-selected by gel purification from 100 µg of total RNA. The 60–100 nt fraction was excised from an 8% TBU acrylamide gel, extruded through a hole punctured in a 0.5 mL centrifuge tube, and eluted overnight at 4°C with rotation in a buffer of 300 mM sodium acetate, 1 mM EDTA, and 0.1% SDS, followed by filtration through a 0.22 µM pore Costar Spin-X centrifuge tube filter and ethanol precipitation. Pellets were resuspended in 10 µL of DEPC H20 and quantified by Nanodrop before ligating 1 µg of tRNA to splint adapters as previously described (Thomas et al. 2021). Ligation products (120–180 nt) were gel-purified, resuspended in 23 µL of DEPC H20 and ligated to the Nanopore RMX adapter. The remaining steps of the library prep were carried out as described in the Oxford Nanopore direct RNA sequencing protocol, using 500 ng of adapter-ligated tRNA as input. However, these libraries experienced rapid drops in translocation time possibly due to sample overloading and premature depletion of ATP fuel. To address this, half of each prepared library was loaded directly onto the MinION flow cell, and the remaining half stored at 4°C. After the number of actively sequencing pores on the flow cell dropped to <50% of the initial run state, the run was paused and the second half of the library loaded; this transiently restored the translocation speed, thereby increasing yield. While the yields from these libraries provided sufficient coverage on yeast tRNAs for the analyses described herein, subsequent discussion with ONT applications scientists suggested an input of ∼50 femtomoles might be more appropriate for tRNA sequencing libraries and improve throughput.
Sequencing run conditions and base calling
Direct RNA-seq libraries were loaded onto R9.4.1 flow cells in a MinION sequencer connected to a laptop running MinKNOW software version 21.10.4. Runs were performed with live base calling turned on to monitor read quality and translocation speed in real time. All libraries were subsequently base called with Guppy version 5.0.16 with default CPU parameters using the high accuracy model (rna_r9.4.1_70bps_hac.cfg).
Alignment references and mapping parameters
Poly(A) selected mRNA libraries were mapped to an S. cerevisiae transcriptome reference (Mangkalaphiban et al. 2021), which contains both pre- and post-spliced mRNA references (https://github.com/Jacobson-Lab/yeast_transcriptome_v5). Reads were aligned using Minimap2 (Li 2018) in a splice-aware fashion with specific parameters (minimap2 -ax splice -uf -k14). tRNA sequencing libraries were mapped to a custom S. cerevisiae tRNA reference containing a consensus sequence for each cytoplasmic tRNA species in budding yeast, available at https://github.com/hesselberthlab/RNARePore. Consensus sequences are largely derived from the first predicted tRNA in each anticodon family as listed on gtRNAdb (e.g., tRNA-Phe-GAA-1-1) (Chan and Lowe 2016). All tRNAs in this reference have had CCA added to their 3′ ends, tRNA splint adapter sequences appended and prepended, and (where applicable) introns removed in silico. tRNA alignments and alignments to the splint ligated synthetic RNA reference were performed as described in Thomas et al. (2021) using BWA-MEM version 0.7.16a (Li 2013) with the parameters bwa mem -W 13 -k 6 -x ont2d.
Analysis of base calling differences and quality scores
Aligned reads and per-nucleotide mismatches were visualized in IGV version 2.11.2. tRNA reads were visualized in IGV and annotated with all modifications present for each S. cerevisiae tRNA species in MODOMICS (Boccaletto et al. 2022). We used EpiNano-RMS (https://github.com/novoalab/nanoRMS/tree/master/epinano_RMS) (Begik et al. 2021) to extract the frequency of mismatch, insertion, and deletion rates per position, as well as per nucleotide base calling quality scores.
Analysis and visualization of raw Nanopore signals
We used the Nanopolish (Loman et al. 2015) eventalign module to reannotate our aligned sequencing reads with raw signal information from FAST5 format. While Nanopolish has been previously described as less effective at annotating signals from sequencing reads containing modified RNA (Begik et al. 2021), a commonly used alternative software tool, Tombo, is restricted to Minimap2 alignments (Stoiber et al. 2017), making it incompatible with short read sequencing from our synthetic oligonucleotide standards and tRNA libraries. We therefore extracted positional current intensity and dwell time information with Nanopolish on a per-read basis. As the resulting Nanopolish outputs can be quite large, these files were preprocessed with custom bash scripts to select specific regions of interest for further analysis in R.
We used the same approach to reanalyze published sequencing data from modified RNA oligonucleotide standards (Leger et al. 2021) and ribosomal RNA (Stephenson et al. 2022). For this analysis, we realigned each publicly available fastq data set to its published reference sequence, and then annotated the aligned reads with their dwell times from the corresponding FAST5 files using Nanopolish. We used this information to interrogate the distribution of dwell times over a 3 nt window centered at position 0 (the modified nucleotide) and a second 3 nt window centered at position 12, and performed two-sided Kolmogorov–Smirnov testing to determine whether there was a statistically significant difference in the distribution of dwell times between each pair of samples.
In the process, we observed an important nuance in the default behavior of Tombo and Nanopolish when annotating positional current and dwell information. While Nanopolish outputs signals in kmer-space, assigning them to the 5′ end of the 5 nt window centered on the base called nucleotide, Tombo outputs the same signals in nucleotide-space, with both tools beginning their count from position zero. We added three nucleotides to the position of all signals output by Nanopolish in our analysis to correctly position this signal in one-based sequence space (Supplemental Fig. S8). This explains the discrepancy between the original reported dwell signal at the +10 position in (Stephenson et al. 2022) and our reanalysis, which places the peak dwell on the same 2′-O-methylated rRNA sites at +11 nt.
Analysis of read termination status
Sequencing reads that do not terminate with the expected increase in observed current caused by a nucleic acid strand exiting the pore (“signal positive”) are assigned one of three alternative end reasons by the ONT MinKNOW software, depending on whether they were terminated during a routine scan of the flow cell (“mux change”), terminated due to an unexpected drop in observed current (“signal negative”), or terminated after a MinKNOW-initiated attempt to remove the obstruction (“unblock mux change”). These end reasons are stored in the MinKNOW-produced sequencing_summary.txt files. We analyzed these data from tunicamycin-treated cells to annotate sequencing reads aligned with Minimap2 with the reason that each read terminated, and calculated the proportion of reads aligning to each mRNA assigned to each of these end statuses.
DATA DEPOSITION
Raw data (fast5 and fastq files from all sequencing runs) have been deposited at NCBI SRA under BioProject accession number PRJNA910992, and scripts for data analysis are available at https://github.com/hesselberthlab/RNARePore.
SUPPLEMENTAL MATERIAL
Supplemental material is available for this article.
ACKNOWLEDGMENTS
We thank N. Mukherjee for comments on the manuscript. This work was supported by the National Institutes of Health (R35 GM119550 and T32 GM136444), the Molecular Biology Program, the Bolie Family Foundation (L.W.), and the RNA Bioscience Initiative (L.W.).
Footnotes
-
Article is online at http://www.rnajournal.org/cgi/doi/10.1261/rna.079290.122.
- Received June 4, 2022.
- Accepted February 9, 2023.
This article is distributed exclusively by the RNA Society for the first 12 months after the full-issue publication date (see http://rnajournal.cshlp.org/site/misc/terms.xhtml). After 12 months, it is available under a Creative Commons License (Attribution-NonCommercial 4.0 International), as described at http://creativecommons.org/licenses/by-nc/4.0/.
REFERENCES
MEET THE FIRST AUTHOR

Meet the First Author(s) is an editorial feature within RNA, in which the first author(s) of research-based papers in each issue have the opportunity to introduce themselves and their work to readers of RNA and the RNA research community. Laura White is first author of this paper, “Nanopore sequencing of internal 2′-PO4 modifications installed by RNA repair.” Laura completed this work as a graduate student in Jay Hesselberth's laboratory at the University of Colorado School of Medicine, and has since defended and transitioned into a new role as an RBI Informatics Fellow at the RNA Bioscience Initiative. The RBI fellows support RNA focused research projects across the CU Anschutz campus. Laura's work is focused on long read sequencing, split 50/50 between computational analysis and method development for direct RNA sequencing and RNA modification detection.
What are the major results described in your paper and how do they impact this branch of the field?
2′-phosphates are a unique covalent mark produced by RNA ligases. In this work, we developed two complementary approaches to detect these modifications using nanopore sequencing, and validated these on all known classes of RNA ligation substrates. In the process, we also report the first direct RNA sequencing of eukaryotic tRNAs. In benchmarking the various signals produced by 2′-phosphorylation, we determined that the most robust signal of RNA repair is stalled translocation as the modification is passing through the nanopore motor protein. We compare this signal to other direct RNA sequencing data sets and showed that this property is shared by some, but not all other RNA modifications, suggesting that integrating positional signals produced as modifications transit through a nanopore could improve de novo detection of RNA modifications.
What led you to study RNA or this aspect of RNA science?
As an undergraduate at Emory University, I had the privilege of working in Dr. Anita Corbett's laboratory, where I got my first taste of RNA biology. After moving to Colorado, I took on a PhD rotation project focused on tRNA splicing, which in fungi uses the same 2′-phosphate depositing ligase we focus on in this manuscript. The level of complexity in tRNA biology is fascinating to me—the combination of multiple anticodons for the same amino acid, multiple isodecoders with the same anticodon, and RNA modifications means the number of unique molecular species of tRNAs in a single cell could potentially be in the millions! Understanding the extent of this complexity will require improvements in high-throughput methods to study tRNA molecules.
During the course of these experiments, were there any surprising results or particular difficulties that altered your thinking and subsequent focus?
Direct RNA sequencing was one of several methods we tried to detect 2′-phosphates. While it gave us a strong signal at known sites of RNA ligation, one thing we realized in the course of this work is that de novo detection of RNA modifications by nanopore sequencing is still in its infancy. Dr. Oguzhan Begik and colleagues wrote a great review of this (published in RNA last year) that lays out the grand challenge for the field of generating appropriate sequencing data sets of modified RNAs in many different sequence contexts in order to train machine learning models to identify and quantify RNA modifications from nanopore sequencing.
What are some of the landmark moments that provoked your interest in science or your development as a scientist?
During the first year of my PhD, the University of Colorado School of Medicine invested $20 million in RNA research with the founding of the RNA Bioscience Initiative. This meant I got a front row seat to a cluster hire of RNA researchers, each of whom now has an established research program at CU. Having a critical mass of RNA scientists on one campus is just plain fun. We have a vibrant and highly collaborative community, and I've really enjoyed watching it grow as I myself have grown up here as a scientist.
If you were able to give one piece of advice to your younger self, what would that be?
I have a bad habit of taking on too many projects due to my own enthusiasm for exploring biological unknowns. My advice to myself as a junior graduate student would be to try to focus more on one primary project, and not let side projects take up more than 20% of my research time. That said, I'm not sure younger me would have listened to that advice.
Are there specific individuals or groups who have influenced your philosophy or approach to science?
My PhD mentor Dr. Jay Hesselberth gave me a tremendous amount of freedom to explore new ideas during graduate school, while still being game to get into the weeds and troubleshoot even the smallest details of experiments. Jay also somehow convinced me as a 6th year PhD student to try a totally new technology (nanopore sequencing) to see if we could detect a 2′-phosphate signal. His can-do attitude toward sequencing method development has strongly shaped my own development as a scientist.
What are your subsequent near- or long-term career plans?
Since defending my thesis, I've taken on several new collaborations focused on applying direct RNA sequencing to the detection of different RNA modifications and to the analysis of mammalian tRNA populations. I'm not sure what direction my career will take just yet, but I expect to be actively involved in refining both computational and sequencing methods in order to make these kinds of experiments more straightforward and more accurate.




