


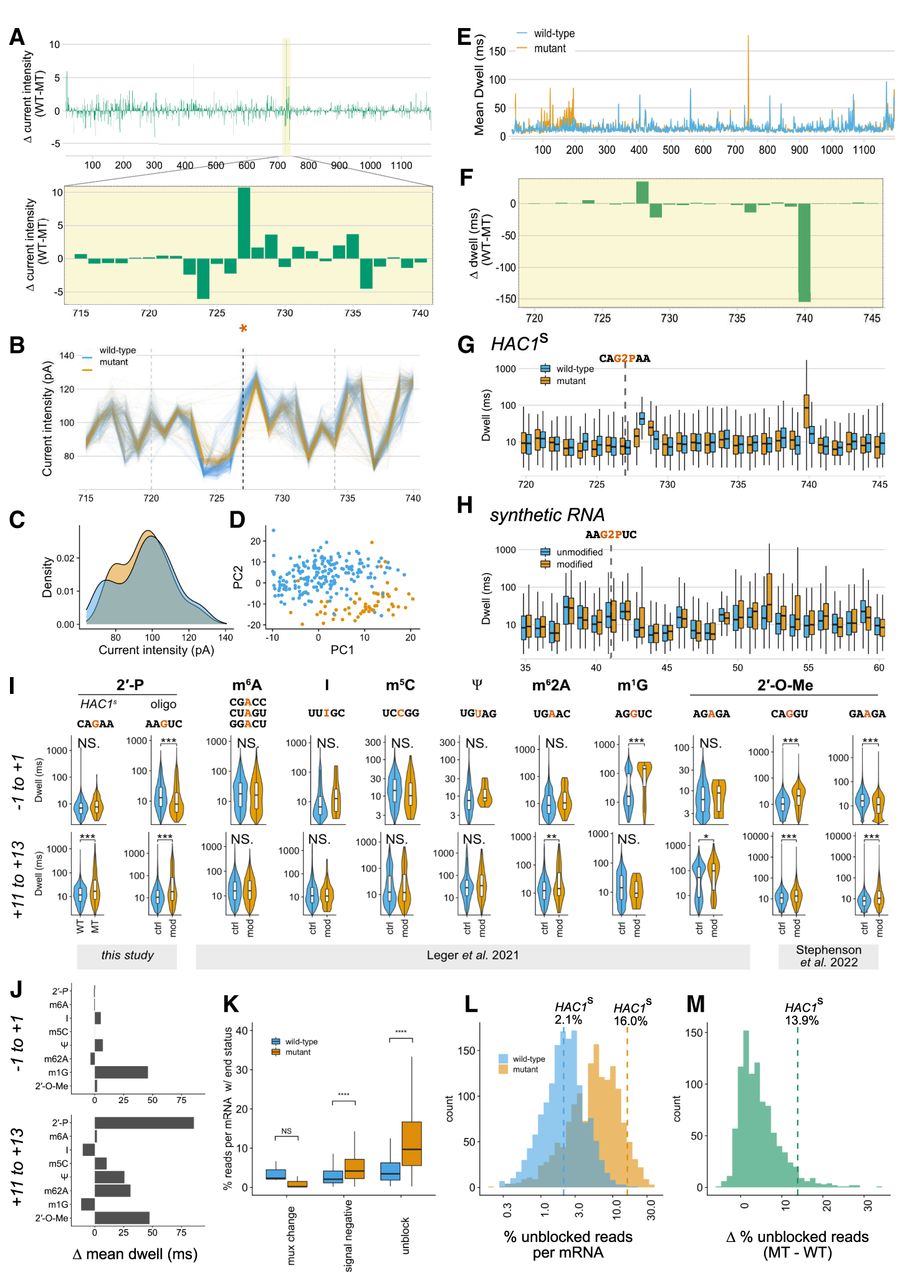
Current and base calling features of 2′-phosphorylation and other RNA modifications. (A) Change in mean current intensity across the spliced HAC1s transcript (upper panel) and at the splice junction (lower panel, 2′-phosphorylated position marked with asterisk). (B) Per-read current intensities at the HAC1s splice junction. The dotted gray lines define a 15 nt window corresponding to the approximate footprint of the nanopore and docked motor protein when the 2′-phosphorylated nucleotide (vertical dashed black line, position 727) is centered in the reader head of the nanopore. (C) Distribution of current intensities across all reads within this 15 nt window. (D) Principal components analysis of current intensity values across the 15 nt window surrounding the splice site. (E) Mean dwell time in milliseconds for each nucleotide across HAC1s. (F) Difference in dwell time between WT and mutant samples within the region surrounding the HAC1 splice junction. (G) Distribution of per-read dwell times in WT and mutant samples over this same region, with the HAC1 splice junction indicated by a vertical dashed line. (H) Difference in dwell time on reads aligning to a synthetic RNA within the region surrounding the 2′-phosphorylated or unmodified position (vertical dashed line). (I) Violin plots of the distribution of per-read dwell times within a 3 nt window surrounding a modified position (upper row) or a 3 nt window +11 nt in the 3′ direction on the same RNA substrates. Overlaid box plots define the median and interquartile range. Above each stacked pair of plots, the sequence context(s) for each modification are indicated with the modified nucleotide in red. (J) The difference in dwell times for all modifications in I was calculated by subtracting the mean dwell for modified RNA versus the mean dwell from the unmodified libraries, over the same 3 nt windows. 2′-phosphate, m6A, and 2′-O-methyl means were calculated across multiple sequence contexts. (K) Box plots showing the percent of aligned reads per mRNA in UPR-stressed cells that did not report a successful positive signal at termination, with the alternative end reasons on the x-axis. (L) Histogram displaying the percent of reads per mRNA in WT or mutant libraries with the “unblock” end status. In this plot, only mRNAs with ≥30 total reads are visualized. Vertical dashed blue and orange lines indicate the percent of unblocked reads aligning to HAC1s in the WT and mutant samples, respectively. (M) For each mRNA in L, the percent of unblocked reads in the WT sample was subtracted from the corresponding percentage in the mutant sample. The location of HAC1s on this histogram is indicated with a vertical dashed green line.




