


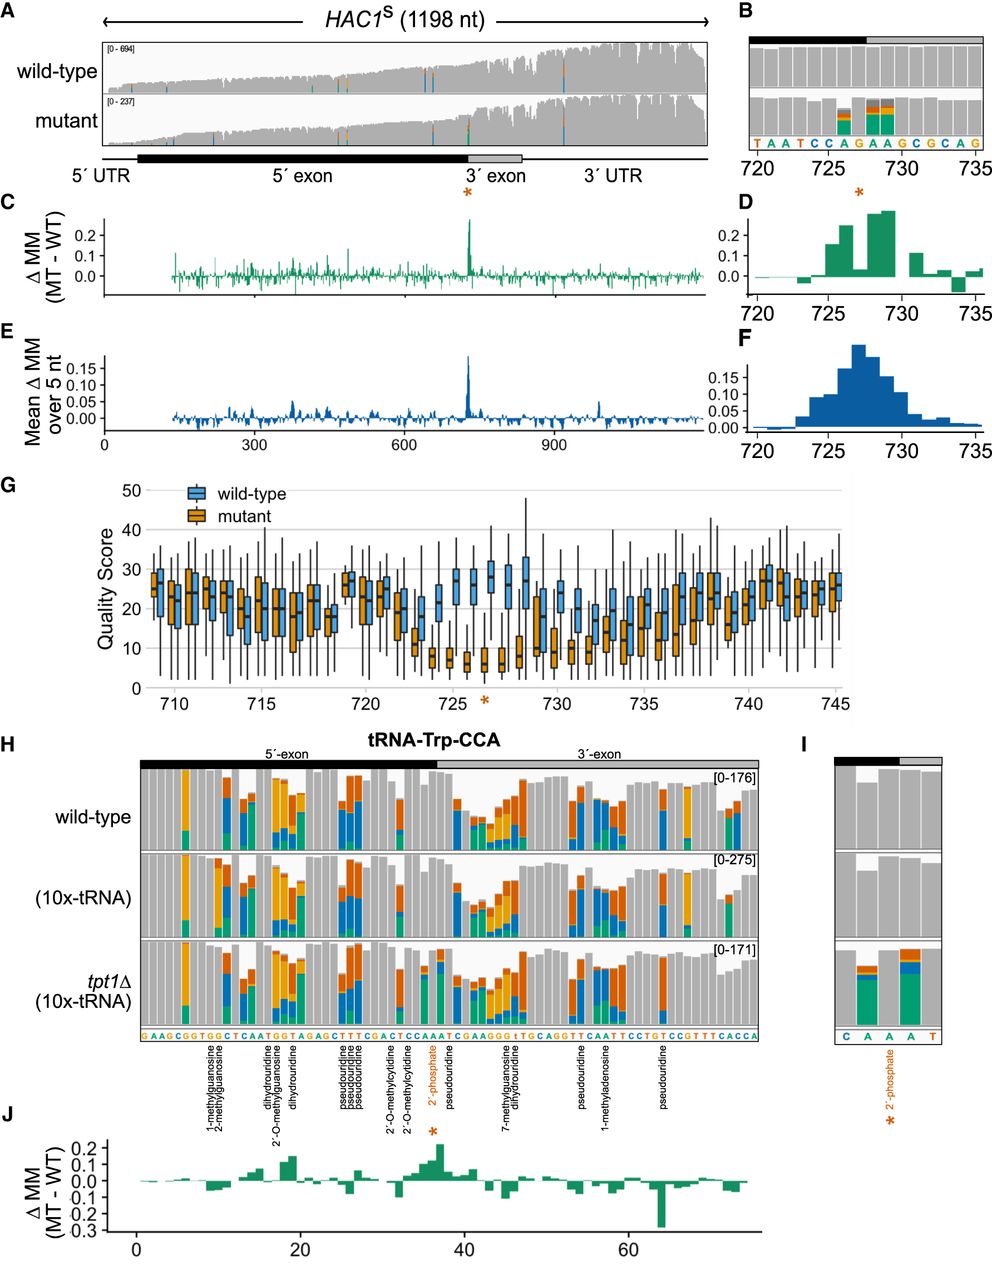
Nanopore sequencing enables direct detection of known 2′-phosphates deposited by Trl1 ligation in vivo. (A) Coverage of reads from Tm-treated, undigested mRNA libraries from wild-type and xrn1Δ tpt1Δ (10×-tRNA) cells (“mutant”) aligned to HAC1s. Bar heights quantify read coverage (y-limits, upper left). Colored bars represent positions with >20% mismatching to the reference base; gray bars indicate positions that did not exceed this threshold. (B) An enhanced view of the splice junction at right shows mutant-specific mismatches at nucleotides flanking the 2′-phosphorylated guanosine. (C) Difference in percent of reads aligned to HAC1s between the strains above shows the highest differences in mismatching flanking the splice junction (orange asterisk), as seen in the enhanced view in panel D. (E) Plotting the mean Δ mismatch value over a 5 nt window yields a peak centered at the 2′-phosphorylated position, enhanced in panel F. (G) Base calling quality scores over this region show a reduction in base calling in mutant RNA centered on the 2′-phosphorylated position (orange asterisk). (H) The 2′-phosphate on tRNA-Trp-CCA can be detected by anticodon-proximal mismatches in tRNA sequencing reads mapping to the mature tRNA reference. Each colored bar represents a position with >20% mismatching to the reference base; gray bars indicate positions which did not exceed this threshold. Modified positions reported in MODOMICS (Boccaletto et al. 2022) are annotated below the reference sequence, with the 2′-phosphate indicated in red text. Values in brackets represent the range of coverage in raw read counts across the entire tRNA. (I) Close-up of the 5 nt centered on the 2′-phosphorylated adenosine (*) located at the tRNA-Trp-CCA splice junction. (J) Difference in percentage of reads aligned to tRNA-Trp-CCA between tpt1Δ (10×) cells and w303 cells expressing the 10×-tRNA plasmid. 2′-phosphorylated positions are indicated with asterisks across these figure panels.




