


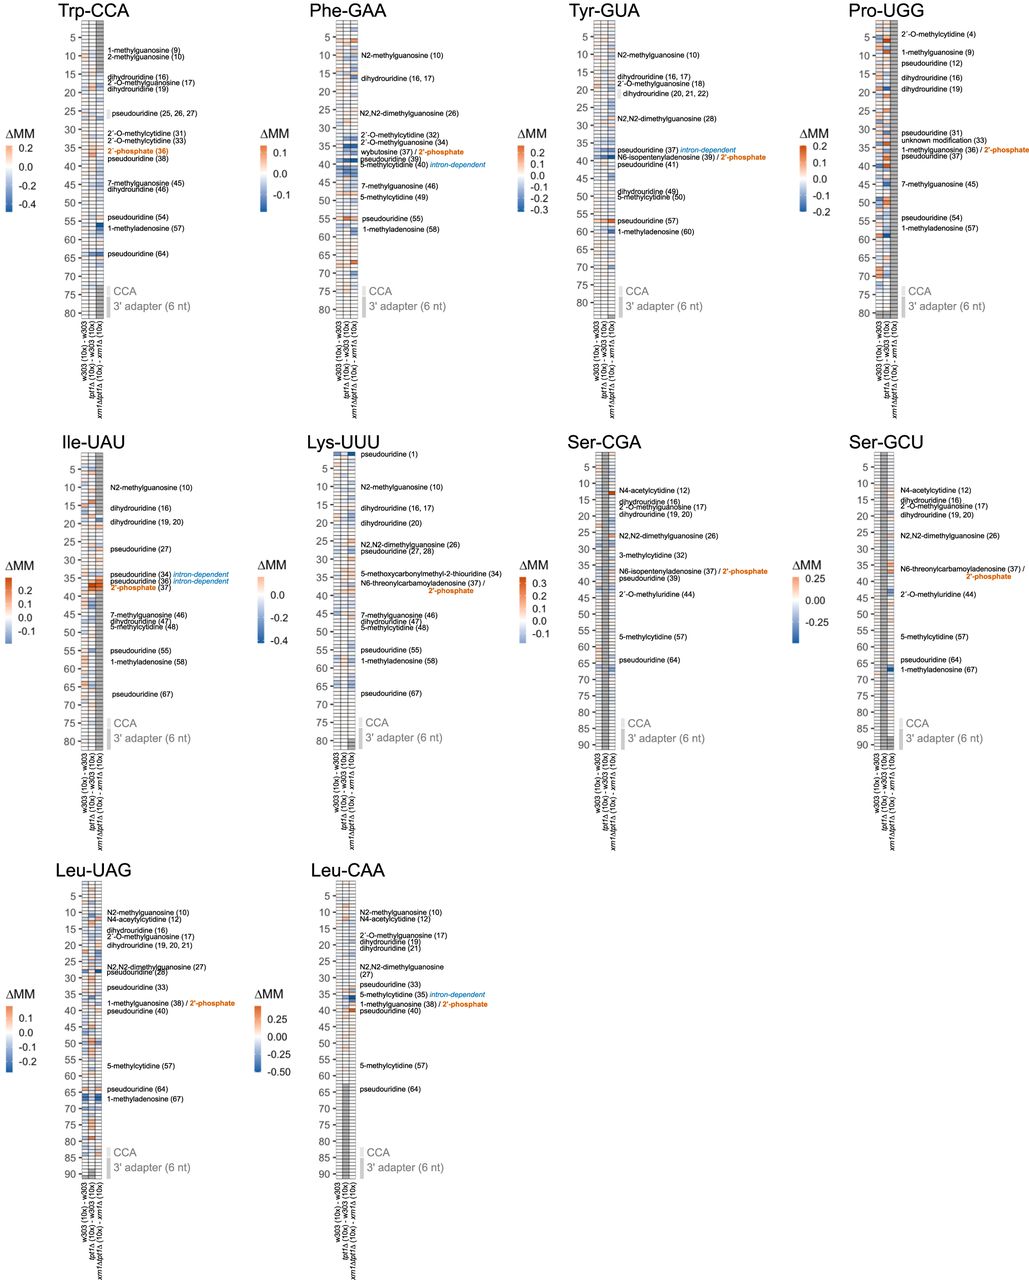
Changes in mismatch frequency across tRNA processing mutants identify modifications associated with tRNA splicing. Comparison of mismatch frequency (ΔMM) from cells expressing only genome-encoded tRNAs or a combination of fully or partially processed genome-encoded tRNAs and “prespliced” tRNAs from the 10×-tRNA plasmid. Strain comparisons are indicated at the bottom of the heat map for each tRNA, with modified positions reported in MODOMICS (Boccaletto et al. 2022) annotated at right, with specific modifications known to be dependent on the presence/removal of a tRNA intron highlighted alongside. Positive values (red boxes) indicate mismatch signals (and by extension, candidate tRNA modifications) whose abundance increases when tRNA splicing is perturbed, while negative values (blue boxes) are produced by an analogous drop in mismatching, as might be produced by intron- or splicing-dependent tRNA modifications. Gray boxes indicate nucleotides with <20 reads aligning in at least one library; no mismatch frequency has been calculated at these low coverage positions.




