


The importance of m6A topology in chicken embryo mRNA: a precise mapping of m6A at the conserved chicken β-actin zipcode
- Francis Baron1,2,5,
- Mi Zhang1,
- Nathan Archer3,
- Eleanor Bellows1,
- Helen M. Knight4,
- Simon Welham1,
- Catrin S. Rutland3,
- Nigel P. Mongan3,
- Christopher J. Hayes2,
- Rupert G. Fray1 and
- Zsuzsa Bodi1
- 1School of Biosciences, The University of Nottingham, Sutton Bonington Campus, Leicestershire LE12 5RD, United Kingdom
- 2School of Chemistry, The University of Nottingham, Nottingham NG7 2RD, United Kingdom
- 3School of Veterinary Medicine and Science, The University of Nottingham, Sutton Bonington Campus, Leicestershire LE12 5RD, United Kingdom
- 4Faculty of Medicine and Health Sciences, Queen's Medical Center, Nottingham NG7 2UH, United Kingdom
- Corresponding authors: rupert.fray{at}nottingham.ac.uk, chris.hayes{at}nottingham.ac.uk, zsuzsanna.bodi{at}nottingham.ac.uk
Abstract
N6-methyladenosine (m6A) in mRNA regulates almost every stage in the mRNA life cycle, and the development of methodologies for the high-throughput detection of methylated sites in mRNA using m6A-specific methylated RNA immunoprecipitation with next-generation sequencing (MeRIPSeq) or m6A individual-nucleotide-resolution cross-linking and immunoprecipitation (miCLIP) have revolutionized the m6A research field. Both of these methods are based on immunoprecipitation of fragmented mRNA. However, it is well documented that antibodies often have nonspecific activities, thus verification of identified m6A sites using an antibody-independent method would be highly desirable. We mapped and quantified the m6A site in the chicken β-actin zipcode based on the data from chicken embryo MeRIPSeq results and our RNA-Epimodification Detection and Base-Recognition (RedBaron) antibody-independent assay. We also demonstrated that methylation of this site in the β-actin zipcode enhances ZBP1 binding in vitro, while methylation of a nearby adenosine abolishes binding. This suggests that m6A may play a role in regulating localized translation of β-actin mRNA, and the ability of m6A to enhance or inhibit a reader protein's RNA binding highlights the importance of m6A detection at nucleotide resolution.
Keywords
- RedBaron method
- β-actin localization
- m6A site verification
- MeRIPSeq
- m6A site-specific quantification
INTRODUCTION
Among more than 100 modified RNA nucleotides, N6-methyladenosine (m6A) is the most abundant internal modification in eukaryotic mRNA. m6A regulates almost every stage of the mRNA life cycle, with important regulatory roles in splicing (Xiao et al. 2016), polyadenylation (Ke et al. 2015), nuclear export (Roundtree et al. 2017; Lesbirel et al. 2018), stability (Wang et al. 2014), translation (Meyer et al. 2015; Wang et al. 2015; Zhou et al. 2015), and degradation (Wang et al. 2014; Du et al. 2016). m6A is essential for normal development of eukaryotic organisms (Zhong et al. 2008; Geula et al. 2015), and abnormal levels of m6A have been associated with diseases including various types of cancer (Zhang et al. 2016; Lu et al. 2017; Chen et al. 2018).. Transcriptome-wide, between 0.2 and 0.4% of adenosines are m6A modified (Dominissini et al. 2012; Meyer et al. 2012; Schwartz et al. 2014), depending on tissue or cell type. However, the modification is unevenly distributed in mRNA transcripts and is predominantly localized in the 3′ UTR near the stop codon (Dominissini et al. 2012; Meyer et al. 2012), usually within the consensus sequence motif DRACH (D = G/A/U, R = G/A, H = A/U/C).
There are a number of methods for the transcriptome-wide detection of m6A. The most commonly used methods are m6A Seq/MeRIP-Seq (Dominissini et al. 2012; Meyer et al. 2012; Schwartz et al. 2014) and miCLIP (Linder et al. 2015); however, these methods are unable to unambiguously distinguish m6A at specific nucleotide sites or to quantify the proportion of a particular gene's transcripts which contain the modification at a specific site. Both methods require the use of an anti-m6A antibody, and these antibodies can exhibit off target activities, targeting nonmethylated regions of the RNA, potentially resulting in false positives (Helm et al. 2019). Alternative methods of m6A mapping have been tested, including the use of reverse transcriptases (Harcourt et al. 2013; Wang et al. 2016; Aschenbrenner et al. 2018) and modified nucleotide triphosphates (Hong et al. 2018), as well as the use of inhibition of endoribonuclease MazF to cut RNA at ACA sites when methylated (Imanishi et al. 2017; Zhang et al. 2019). None of the above methods gives a representative picture of the whole methylome with high certainty. Third generation sequencing technologies such as Oxford Nanopore and single-molecule real-time (SMRT) sequencing are rapidly improving and show great promise (Vilfan et al. 2013; Liu et al. 2019) for m6A detection; however, these methods are also limited in their accuracy due to the lack of good synthetic training sets reflecting the biological diversity of m6A-contexts in vivo and antibody-independent verification methods.
There is a recognized need for a sensitive biochemical method for transcript-specific m6A detection and quantification. To date, there are only two methods capable of this, SCARLET and SELECT (Liu et al. 2013; Xiao et al. 2018). However, SCARLET is technically difficult, time consuming, and requires large quantities of input RNA. For these reasons, the SCARLET method is not routinely used. SELECT is claimed to be a very simple, low input, qPCR-based method. However, its accuracy is dependent on the very precise quantification of the input RNA concentrations. SELECT can be quantitative in determining m6A/A ratios at a specific site. However, for this purpose, a precise quantification of the target transcript in the input must be performed alongside a calibration curve for the m6A/A fractions in the sequence context of the assumed m6A position. These additional steps make SELECT more laborious than a “one tube” experiment, and potentially reduce accuracy.
Actin is one of the most conserved proteins within metazoans and its transcript is m6A methylated in human and mouse (Dominissini et al. 2012). Among the different isoforms, β-actin is a cytoplasmic actin that is highly regulated both spatially and temporally and plays an essential role during development. It is also involved in cell shape changes, protein trafficking, cell division, chromatin remodeling and regulation of transcription (Almuzzaini et al. 2016; Lehtimäki et al. 2017; Luxenburg and Geiger 2017; Viita and Vartiainen 2017; Vedula and Kashina 2018). β-actin mRNA has been shown to localize to the leading edge of chicken embryo fibroblasts and to the extending neuronal growth cones (Lawrence and Singer 1986; Zhang et al. 1999). The spatial targeting of β-actin mRNA is under the control of the zipcode sequence, located in the 3′ UTR of the transcript. The zipcode sequence is responsible for recruiting the highly conserved KH (hnRNP K homology) domain zipcode binding protein, ZBP1. The 28-nt zipcode contains the highly conserved GGACU sequence, and this motif is essential for the KH domain binding (Chao et al. 2010; Nicastro et al. 2017). This same sequence happens to be the canonical consensus sequence for m6A mRNA methylation in most eukaryotes, and is methylated in mouse and human (Dominissini et al. 2012; Liu et al. 2013). The conserved zipcode sequence between eukaryotes and the site of m6A at this position suggests a link between actin localization and mRNA methylation.
Here, we demonstrate that the chicken ACTB zipcode sequence has m6A sites which we accurately map and quantify using a low input, quantitative RNA-Epimodification Detection and Base-Recognition “RedBaron” verification method. We also demonstrate that the presence of m6A can either enhance or abolish ZBP1 binding in vitro depending on its precise site within the zipcode sequence.
RESULTS
Transcriptome-wide detection of m6A in Gallus gallus
The two core components of the m6A methylase writer complex, METTL3 and METTL14, are 78.23% and 93.94% identical, respectively, between chicken and mouse (Supplemental Data S1). Therefore, we were interested in testing how much m6A is present in the chicken transcriptome, and how it is distributed across the transcriptome compared to other vertebrates. Initially we measured the global levels of m6A in chicken poly(A) RNA from embryos and chicken embryonal fibroblast cells using the two-dimensional thin layer chromatography (TLC) method (Zhong et al. 2008). The m6A to A ratios (following a G) (Fig. 1A; Supplemental Fig. S1) were very similar to that of published values in mouse and human (Liu et al. 2020a,b).
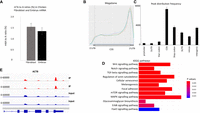
The topology of m6A in the chicken transcriptome. (A) m6A levels in chicken embryo (HH27) and chicken embryonal fibroblast. For each experiment, three biological replicates were used, and the difference between the fibroblast and embryo is not significant (t-test, P = 0.173, one-tailed). (B) mRNA metagene plot from the RNAmod analysis of the MeRIPSeq data from three biological replicates of chicken embryo (HH27). The y-axis represents the density distribution of coverages. (C) Modification sites/peak distribution on different gene features. The y-axis represents the frequency of peaks/sites (number of peaks/sites), whereas the x-axis represents different gene features. The error bars represent the standard deviations for three biological replicates. (D) KEEG pathway enrichment for three replicates shows the top 12 most enriched pathways (data are created using the RNAmod platform, http://61.147.117.195/RNAmod). The color scale represents the enrichment P-value. (E) Integrative Genomics Viewer (IGV) tracks of MeRIP-seq, upper panel and RNA-seq, lower panel read distribution of ACTB mRNA.
To determine the topology of m6A sites at the transcriptome level, we carried out a MeRIPSeq experiment on poly(A) fractions isolated from chicken embryos. m6A peaks were identified and functionally annotated using the RNAmod portal (http://61.147.117.195/RNAmod/) (Liu and Gregory 2019). Only m6A peaks with cut off values for significance P ≤ 0.05, and a fourfold increase in IP versus input were used (sample 1, 16,989 peaks; sample 2, 13,331 peaks; and sample 3, 9182 peaks). In the final gene matrix, 4332 peaks were identified which were represented in at least two replicates (Supplemental Fig. S2). The topology of the m6A deposition in the chicken transcriptome represented by the metagene analysis is very similar to mouse and human (Dominissini et al. 2012; Meyer et al. 2012). This analysis showed that most m6A peaks are concentrated around the 3′end of transcripts (Fig. 1B) The peak distribution frequency in the 5′ UTRs is 10-fold lower compared to those in CDS and in the stop codon–3′-UTR regions (Fig. 1C). The gene-type statistics showed that most of the peaks are found in protein-coding transcripts (Supplemental Fig. S3).
A pathway enrichment analysis using all significant methylation peaks with fourfold or greater increase indicated that several KEGG pathways characteristic for chicken stage HH27 (Hamburger and Hamilton 1951) were enriched in the m6A methylated transcript population (Fig. 1D). One of the most significantly enriched pathways identified was the “Regulation of actin cytoskeleton.” Twenty-two methylated transcripts, including ACTB, belong to this pathway (Supplemental Table S1). Furthermore, using a conserved set of transcripts between mouse and chicken, and only those transcripts that were methylated at 3′ ends in both species, we identified both ACTB (chicken) and Actb (mouse) homologs (Supplemental Data S2) The KEGG pathway enrichment for the chicken 3′-UTR methylated conserved transcripts also identified the “Regulation of actin cytoskeleton” as one of the top enriched pathways (Supplemental Table S2). The methylation peaks in chicken ACTB map within the zipcode binding sequence, immediately after the stop codon in the 3′ UTR (Fig. 1E). The GGACU site in the β-actin zipcode was previously found to be methylated in mouse and human (Dominissini et al. 2012; Liu et al. 2013). However, m6A peak summits from our three experimental repeats did not align exactly over the GGACU sequence in the β-actin 3′-UTR region, thus demonstrating the limitations of MeRIP data, which were unable to pinpoint the precise position of m6A in the zipcode sequence. Knowing the precise position of m6A is important, as the zipcode sequence contains several As that could be targets for methylation, and methylation at different sites might influence ZBP binding, and thus effect transcript fate, in different ways.
Effect of zipcode methylation on ZBP1KH3–KH4 binding
The presence of the zipcode sequence is necessary for the β-actin mRNA subcellular localization. β-actin is both structurally and functionally highly conserved between vertebrate species. Moreover, there is a conservation of the presence of m6A in the zipcode sequence of mouse, human (Dominissini et al. 2012; Meyer et al. 2012; Liu et al. 2013) and in chicken embryo β-actin transcripts (Fig. 1E). Thus, the conservation in the m6A topology at the zipcode sequence suggests this modification may be functionally important for the spatial expression of β-actin, facilitated by ZBP1 binding.
The presence of m6A in the zipcode was verified for human β-actin mRNA using the SCARLET method. The precise position of m6A modification was the central adenosine of the “GGACU” sequence motif (position 1216, HeLa β-actin mRNA), and 21% of As in this position were m6A (Liu et al. 2013). This motif is an essential sequence within the 28-nt zipcode (Fig. 2A) for binding and stabilizing of KH4, one of the four KH domains in the chicken ZBP1 protein, while an ACACCCC motif downstream from the GGACU is essential for KH3 binding (Fig. 2A,B; Chao et al. 2010; Nicastro et al. 2017). We hypothesized that methylation of the β-actin zipcode plays an important role in recruiting the ZBP1 protein. As the core ZBP1 binding chicken zipcode sequence contains several potential m6A sites, and it is not possible to unambiguously determine the precise position of m6A modifications from MeRIPSeq results alone (Helm et al. 2019), we wanted to test the effect of the m6A presence at several AC sites for their influence on ZBP1 binding.
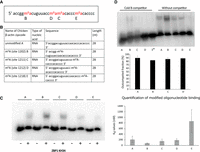
Methylation in the β-actin zipcode changes ZBP1 binding. (A,B) Positions and labeling of the assayed m6A sites in the chicken β-actin core zipcode sequence. (C) Binding assay of the ZBP1KH34 domain to the zipcode oligonucleotide containing m6A at the different positions. A–E refers to the m6A positions presented in A and B subfigures. The bar chart shows the Kd values for the different oligonucleotides. These values were calculated using three different concentrations for each oligonucleotide. The error bars represent the standard error from three replicates. B and E oligomers are significantly different from A oligomer (t-test, one-tailed, unequal variance for A–B, P = 0.05; A–E, P = 0.02; B–E, P = 0.015; A–C, P = 0.2; A–D, P = 0.4). (D) Competition assay using cold B oligonucleotide. The bar chart shows the percentage of outcompeted fractions where the error bars are representing standard deviation from three replicates for A and B oligomers and two replicates for C and D. (*) We were not able to quantitatively assess E oligonucleotide due to close to background level intensity of its shifted band in the absence of a competitor, and complete disappearance in the presence of cold B.
Thus, in the first instance, we synthetized a series of the core 28-nt zipcode RNA sequences in which we replaced candidate A sites with m6A (within nucleotides 1–28) (Fig. 2A,B). To test how m6A in different positions influences ZBP1 binding, we performed gel shift assays using synthetic zipcode RNA oligonucleotides as previously described (Chao et al. 2010). The truncated ZBP1protein containing only KH3 and KH4 domains maintains the binding properties of the full-length protein (Chao et al. 2010). Using this truncated KH3–KH4 ZBP1 in combination with different methylated versions of the zipcode sequence (Fig. 2A), we showed that replacing A with m6A in the GGACU motif resulted in a stronger ZBP1 binding (Fig. 2C,D). This result is supported by a similar observation from Huang et al. (2018) showing that IGF2BP1, the human homolog of ZBP1, is an m6A reader protein and stabilizes m6A harboring transcripts, although these authors were not looking at zipcode-specific binding and did not test the influence of m6A within a zipcode sequence context. All other m6A modifications in our synthetic zipcode oligonucleotides were neutral or negative in their effect on ZBP1 binding. When m6A replaced the A at position 22 in the ACACCCC (E oligonucleotide) sequence motif (Fig. 2C), the methylation almost completely abolished the ZBP1 binding to the core zipcode sequence. Both motifs were previously reported to be essential for ZBP1 binding (Chao et al. 2010). A cold competitor that had an m6A in position 6 (GGm6ACU) out-competed all methylated and nonmethylated zipcode sequences in the RNA–protein complexes (Fig. 2D), further demonstrating that m6A in the GGACU context has the strongest binding to ZBP1.
The RedBaron method for site-specific detection and quantification of m6A
We developed the RedBaron method as SCARLET is technically difficult, time consuming, and requires large quantities of input RNA. Likewise, the SELECT method requires several qPCR steps for determining target transcript concentrations and creating calibration curves for m6A to A ratios in the sequence context where the m6A mark is to be assayed. RedBaron has only three simple steps. First, a chimeric oligonucleotide directs RNase H cleavage, which is similar to SCARLET. However, unlike SCARLET, the site-specific hydrolysis of the phosphodiester bond is designed to occur immediately 3′ to the A/m6A candidate site, leaving a 3′ OH. Second, a 5′ 32P radiolabeled DNA oligonucleotide is splint ligated using the 3′OH of the A/m6A candidate nucleotide, forming a chimeric RNA–DNA oligonucleotide. Third, the chimeric nucleic acid is digested into 3′ nucleoside monophosphates and two-dimensional thin layer chromatography (2D-TLC) is used to quantify the relative levels of adenosine and m6A (Fig. 3). This method also avoids gel purification, dephosphorylation and labeling of all exposed RNA 5′ ends (which are required steps for SCARLET).
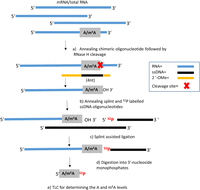
The RedBaron method of m6A detection: A chimeric oligonucleotide was used to target an RNase H cleavage of phosphodiester bond immediately 3′ to the A/m6A candidate site (A,B). A 32P radiolabeled single-stranded DNA oligonucleotide is ligated to the 3′ of the A/m6A candidate nucleotide (C). The RNA is digested into 3′ nucleoside monophosphates (D). The relative levels of m6A to adenosine are quantified by 2D-TLC (E).
To demonstrate that the RedBaron method is able to accurately detect m6A, we synthesized two oligonucleotides containing either A or m6A at a specific position (Fig. 4A). In the first instance we applied the RedBaron protocol to the synthetic m6A and A RNA oligonucleotides in two separate experiments. The 3′ nucleoside monophosphates (Ap and m6Ap) generated using the RedBaron method run slightly further in both the first and second dimension than the 5′ nucleoside monophosphates. For this reason, prior to the detection of radiolabeled nucleotides using the TLC method, we spiked in an equimolar mixture of pA, pG, pC, and pU nucleotides to determine the correct orientation of 3′ adenosine monophosphate and 3′ N6-methyladenosine monophosphate (Fig. 4B). This allows easy distinction between Ap and m6Ap and the spiked in 5′ nucleotides (Fig. 4B). Next, we tested the accuracy of the method for quantifying m6A amounts in a mixture of synthetic m6A modified and unmodified oligonucleotides. Using varying ratios of the unmodified and m6A modified oligonucleotides, we demonstrated that the RedBaron method is able to accurately measure levels of m6A across a wide range of input values to a minimum of 1% m6A being present at the specific site in 4 fmol RNA oligonucleotide (Fig. 4C). Thus, this method is quantitative and site-specific in a synthetic system.
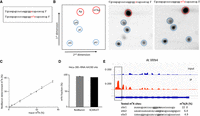
Detection and quantification specific sites using the RedBaron method. (A) Synthetic RNA oligonucleotides containing either A or m6A at position 19. (B) Two-dimensional TLC analysis is used to differentiate between the AP and m6AP nucleoside monophosphates (red) generated by the RedBaron method. (Left) Schematic picture of the TLC plate; (center) unmodified RNA template; (right) m6A modified RNA template. The 5′ nucleoside monophosphates (pA, pG, pC, and pU) are used as reference molecules (blue). (C) The m6A/A ratios from the TLCs are accurately representing the concentration ratios of the two synthetic oligonucleotide mixes. (D) The RedBaron analysis of HeLa 28S rRNA site A4190 showed an average of 99% m6A. This is similar to the SCARLET method's 96% reported in Liu et al. (2013). Error bars for the RedBaron method show the standard deviation from three replicates; the SCARLET value is the published data from Liu et al. (2013). (E) Site-specific quantification of three m6A in the A. thaliana XRN4 mRNA. The IGV image shows the methylation peak in the XRN4 3′ UTR. We used the data from Zhang et al. (2022). The three chosen sequences for the RedBaron assay were under the summit of the peak detected by MeRIPSeq.
Next, we chose the human 28S rRNA for testing the RedBaron method's sensitivity and accuracy within native RNA molecules. Human 28S rRNA contains only one significant m6A modification. Using the SCARLET method, Liu et al. (2013) observed 96% m6A at this site in HeLa RNA. Consistent with this result, we observed 99% m6A at this site in HeLa RNA using the RedBaron method (Fig. 4D). Over the three experimental repeats, we observed almost no variation in m6A levels. We also determined the methylation levels in the A. thaliana XRN4 mRNA, a low abundance transcript in root tissues (Winter et al. 2007). We quantified the m6A/A ratios for three candidate methylation sites from the region of previously detected methylation peaks in the 3′-UTR region (Zhang et al. 2022). We found that all three sites had m6A modification (Fig. 4E; Supplemental Fig. S4). However, site 1 GGACAU had higher detectable m6A levels (22%) than the two downstream sites AAACU and CGACU (site 2: 6.4%, site 3: 4.9%). Thus, we conclude that the RedBaron method is quantitative and accurate using cellular RNA samples from different organisms
Site-specific detection and quantification of m6A in β-actin mRNA
Current MeRIPSeq or miCLIP methods are unable to precisely and unambiguously identify specific m6A locations at nucleotide resolution, due to the intrinsic limitations of the anti-m6A antibody specificity on which such methods depend (Helm et al. 2019). This is particularly true for transcripts with low level m6A. Since we observed that ZBP1 binding is dependent on the topology of m6A in the zipcode oligonucleotides in vitro, we wanted to test the presence of m6A at different positions in embryos and in dividing cells. Therefore, we applied the RedBaron method for site-specific identification and quantification of m6A sites in the chicken β-actin zipcode region. We used poly(A) enriched mRNA from chicken embryos and from chicken embryonal fibroblast cells. In the first instance we tested the methylation status of the A in the GGACU context (Supplemental Fig. S5A). We found 13% m6A at this site in chicken embryos (Supplemental Fig. S5B) and this methylation disappeared when we depleted the ACTB transcript using streptavidin magnetic bead bound biotinylated oligonucleotide (Supplemental Table S3) complementary to a sequence at the 5′ end of the transcript (Supplemental Fig. S5C). The same methylation site tested in chicken fibroblasts gave a higher value of 26.5% (Supplemental Fig. S5B). As the global methylation levels are very similar between chicken embryo and fibroblast cells (Fig. 1A), the difference in m6A levels at the zipcode sequences suggests a functional importance. We also tested whether the m6A levels at the GGACU site would change when chicken embryo mRNA was diluted using Saccharomyces cerevisiae mRNA. A fivefold dilution of the chicken embryo mRNA gave the same m6A/A value of 13% as the undiluted. However, at 10-fold dilution (which would equate to 100-fold less transcripts compared with the SCARLET method), a detection limit is approached as the m6A spot is detectable, but with a tailing off of the m6A to A ratio (7% m6A/A) (Supplemental Fig. S5D). When we tested the ACACCCC (position 22, E oligonucleotide) position using the RedBaron method, we did not find any detectable m6A at this site (Supplemental Fig. S5B). Thus, we can conclude that this ZBP1-suppressive position is not methylated in vivo at the developmental stage tested in chicken embryo.
DISCUSSION
The importance of the m6A position for RNA binding proteins
MeRIPSeq data from chicken embryo revealed that the transcript of one of the most conserved genes among vertebrates, β actin, was methylated near the stop codon over the zipcode sequence, as is also seen in mammals. As the zipcode region determines the subcellular localization of actin mRNA via binding to ZBP1 (Chao et al. 2010), we tested how the presence of m6A influenced the binding properties of the ZBP1 KH3-KH4 domains that have previously been shown to be responsible for zipcode recognition (Chao et al. 2010). We used a series of synthetic oligonucleotides harboring m6A at different sites in the core 28-nt conserved chicken zipcode sequence. These experiments revealed that the presence of m6A in the zipcode GGACU sequence enhanced ZBP1 binding. Our results are supported by the study on the human homolog of ZBP1, the insulin-like growth factor-2 (IGF2) binding protein IGF2BP1-3, which has been characterized as an m6A reader and has a regulatory effect on MYC expression. However, in this earlier study, IGF2BP1-3 binding was tested not with the actin zipcode but with tandem repeats of GGACU which had multiple m6A modifications (Huang et al. 2018).
In addition, we found that replacing As with m6A at other sites within the 28-nt core zipcode sequence could also influence ZBP1KH3–KH4 binding. Out of three different positions, one (A16), did not change the ZBP1 binding compared to the unmodified zipcode. The two remaining positions had negative effects leading to a nearly complete loss of binding when m6A replaced the A in the ACACCCC (position 22, E oligonucleotide) motif. This motif is also an essential component for the ZBP1KH3–KH4 binding, as changing this adenosine to a guanosine (position 22) was previously shown to disrupt the ZBP1KH3–KH4–RNA complex formation (Chao et al. 2010). In a recent study, this sequence region was also shown to bind specifically to a KH3 domain, whereas the KH4 domain was responsible for binding to the GA in the GGACU motif (Nicastro et al. 2017). KH3 preferentially binds to AC-rich regions via the C in position 23. The A following the C in position 24 can be replaced with a C without significantly changing the Kd value. The effects of replacing A in position 22 was not examined in this study (Nicastro et al. 2017). The two previous studies (Chao et al. 2010; Huang et al. 2018) and our gel shift assays demonstrate that the zipcode domains ACACCCC and GGACU are important for ZBP1 binding. The m6ACACCCC decreases, while GGm6ACU increases, ZBP1 binding in vitro. Thus, we hypothesize that the presence of an m6ACACCCC motif may counteract the effect of GGm6ACU in vivo; this could have significant consequences for the regulation of β-actin expression and localization. However, we did not detect any m6A at the ACACCCC site and found that 13% of As were methylated at the GGACU position in chicken embryos. We also showed that the m6A is present at the GGACU position in embryonal fibroblast cells at a higher stoichiometry (26.5%). On the other hand, when we tested the A. thaliana XRN4 transcript, we identified three m6A sites in close proximity. The upstream site GGACAU was highly methylated (22%) while the two downstream sites AAACU and CGACU had lower levels of m6A (site 2: 6.4% and site 3: 4.9%). This is consistent with preferred plant m6A site consensus sites (Wan et al. 2015) and with the observation that alternate m6A sites are often found in close proximity (Ke et al. 2017).
The zipcode controlled localization of ACTB mRNA determines cell polarity and mobility in chicken embryonal fibroblast cell as well as other cell types (Shestakova et al. 2001). This process is facilitated by ZBP1 binding. Our results suggest that ZBP1 binding to the core zipcode sequence can be altered by differential m6A deposition. This highlights the importance of accurate m6A deposition by the writer complex and also of the maintenance of a dynamic equilibrium between the m6A writing and erasing in vivo. This also underlines the importance of knowing the precise topology of the m6A molecule at the single transcript level and emphasizes the need for utilizing RNA oligonucleotides with modifications at defined positions when carrying out RNA–protein binding assays, rather than RNA substrates generated by transcription in the presence of the modified nucleoside triphosphate, allowing a multiple but untargeted incorporation of m6A.
An improved method for m6A site verification and quantification
The presence of m6A is essential for the control and fine tuning of multiple cell differentiation and developmental processes in all eukaryotes where it has been studied. In most eukaryotes, multiple m6A sites are frequently observed at a single transcript level (Meyer et al. 2012), and the depletion of m6A can give rise to pleiotropic effects. Thus, m6A removal may result in a diverse, or no effect, on the function of a single mRNA molecule, depending on the position from where the m6A was removed. The topology of m6A at single nucleotide resolution, and its stoichiometry in a transcript population, are therefore fundamental to our understanding of the m6A functional consequences.
Unequivocal single nucleotide resolution is not possible from MeRIPSeq data as the peaks are broad and the peak summits do not always fall over the m6A position. Indeed, many m6A calling pipelines look for the nearest RRACH under or close to the peak summit (Schwartz et al. 2014). It was previously claimed that by increased fragmentation of the RNA and more refined bioinformatics approaches, a near single nucleotide resolution may be feasible (Schwartz et al. 2014). Increased resolution by simply refining bioinformatics is not possible without improved accuracy and specificity of m6A detection chemistry. Thus, development of antibody-independent biochemical verification methods are essential. Recent studies utilizing Oxford Nanopore sequencing show promise in detecting RNA modifications (Liu et al. 2019; Parker et al. 2020). However, such approaches are still in development, therefore these methods would benefit from an independent and unbiased approach to enable authentication of specific m6A positions by direct biochemical methods.
This study addresses the need for a biochemical method that detects and precisely and unambiguously identifies m6A in any RNA molecule with very high confidence. The antibody-independent SCARLET (Liu et al. 2013) can detect m6A sites specifically at the transcript level; however, this method has not been widely adopted for routine laboratory use. Despite its elegance, SCARLET requires lengthy preparatory steps and gel purification that substantially decreases the yield of the final product, and thus necessitates increased amounts of starting material that are not always feasible. Furthermore, SCARLET uses a targeted RNase H cleavage (Zhao and Yu 2004) at the m6A site, leaving an RNA fragment with an exposed 5′pA/pm6A end. The following steps require removal of this 5′ phosphate and addition of a labeled 5′ phosphate. This is followed by creating a DNA RNA chimera to enable gel purification of the target RNA fragments using T4 DNA ligase and a splint DNA specific to the ends of the labeled m6A RNA and DNA molecules. However, the activity of T4 DNA ligase is not blocked by the presence of gaps between the nucleic acid ends, and the enzyme is able to carry out the ligation process (Lohman et al. 2014). Thus, ends from misclevage by RNase H are likely to be labeled and gel purified. One of these ends could be the C following the A/m6A. This labeled C can be misinterpreted as m6A on the one-dimensional TLC used in the SCARLET method, as pC would run at a very similar Rf value to the pm6A under the applied conditions (buffer used for one-dimensional TLCs). The RedBaron method avoids these artifacts by using SplintRLigase that can only ligate if there is no gap in the double-stranded region between the 3′ and 5′ ends of contributing molecules. The RedBaron does not need gel purification and requires relatively low input amounts of RNA. We used 100 ng of poly(A) RNA for detecting m6A in the ACTB zipcode sequence. However, the method also works well when total RNA is used. Our method uses a 10-fold lower input compared to SCARLET. In addition, RedBaron uses two-dimensional TLC, thus giving unequivocal resolution of nucleotide spots and avoiding potential miscalling of nucleotides with similar Rf values in the first dimension buffer. The biochemical steps can be performed in a day, which is a significant improvement over more complex methods. RedBaron is also reproducible, accurate to 1% m6A/A ratio (in 4 fmol of RNA oligonucleotide) and a low-input method for m6A site verification. However, when m6A site verification is carried out in low abundance transcripts, the input RNA quantities may have to be increased or the target transcript enriched prior to assay. In addition, RedBaron, unlike SELECT, does not need an accurate quantification of the input RNA, or calibration curves and concentration of the target transcript for determining the m6A/A ratios.
In the field of m6A epitranscriptomics, much attention has been given to the conserved YT521-B homology (YTH) domain-containing proteins that preferentially bind m6A and act as “readers” of methylated transcripts. However, the work reported here and elsewhere shows that other proteins also act as m6A readers via their enhanced binding when the modification is present. Importantly, it also highlights that RNA binding can be abolished by the presence of m6A and furthermore, enhanced or inhibited RNA binding of a given protein can be m6A context dependent. Closely linked m6A sites on the same RNA molecule could thus influence reader protein binding in ways that could be hard to predict. Enhancement of ZBP1 binding to the GGm6ACU zipcode domain has been suggested to be the result of a more open structure facilitated by the presence of m6A (Sun et al. 2019), rather than direct binding of the m6A molecule. However, the structural results of Nicastro et al. (2017) demonstrate that there is a hydrogen bond formed between the N6 position of the A in the GGACU and the V523 in the KH4 domain, which suggests that ZBP1 binding could be directly influenced by m6A.
Plasticity of the actin cytoskeleton is important for many cell and developmental processes, including stem cell differentiation; and defective β-actin localization can promote cancer metastasis (Shestakova et al. 1999). Altered mRNA methylation has been associated with faulty cell differentiation and with cancer progression. We would like to suggest that the potential involvement of aberrant β-actin localization should be considered in some of these cases.
MATERIALS AND METHODS
Cells and tissues
Chicken embryonal fibroblast cells (DF1; a kind gift from Dr. Dylan Sweetman) were expanded in standard Dulbecco's Modified Eagle Medium (DMEM; Merck Life Science UK Limited) supplemented with 10% fetal bovine serum (FBS; Merck) and 5% penicillin/streptomycin (Merck). Cells were split at 80% confluence using trypsin-ethylenediaminetetraacetic acid (trypsin EDTA; Merck), spun at 200g for 5 min to pellet, and snap frozen in liquid nitrogen. Cell pellets were stored at −80°C. Fertile chicken eggs (Gallus gallus; Henry Stewart) were incubated, and the chicken embryos were collected after 5.5 d at Hamburger and Hamilton stage 27 (HH 27) (Hamburger and Hamilton 1951). The samples were snap frozen in liquid nitrogen and stored at −80°C. The work was performed within national (UK Home Office) and institutional ethical regulations with permission from the School of Veterinary Medicine and Science ethics committee (ethics number 2320 180612). The HeLa-S3-Cells total RNA was purchased from Agilent Technologies. Arabidopsis mRNA was prepared from root samples of 2-wk-old wild-type seedlings grown on ½ MS plates. Harvested samples were kept at −80°C until use.
RNA purification
Total RNA was prepared from cells and tissues using TRIzol reagent (Invitrogen). The poly(A) RNA was prepared using two rounds of oligo(dT) magnetic beads purification (New England Biolabs).
RedBaron method
The ssDNA oligonucleotide (Supplemental Table S3) (15 pmol) was mixed with ATP [γ-32P] (16 pmol, 48 µCi), and T4 Poly Nucleotide Kinase (10 U) (New England Biolabs) in a total volume of 30 µL PNK buffer A (1×). The solution was incubated at 37°C for 1 h, followed by 75°C for 5 min. The radiolabeled oligonucleotide was purified using a QIAquick Nucleotide Removal Kit and eluted in 100 µL H2O. An 18- to 22-nt chimeric nucleotide was designed to give an appropriate melting temperature, and in the center containing four DNA nucleotides covering the RNase H cut site.
Poly(A)+ RNA (100 ng) was mixed with the chimeric oligonucleotide (Supplemental Table S3) (1 pmol) in a volume of 27.5 µL Tris-HCl (30 mM, pH 7.5). The nucleic acid was annealed by incubating at 95°C for 1 min, followed by room temperature for 5 min. An amount of 1.5 µL PNK buffer (10×) (New England Biolabs) was added, and the solution was incubated at 44°C for 5 min. An amount of 1 µL RNase H enzyme (5 U) (New England Biolabs) was added and the solution was incubated at 44°C for 1 h. The solution was mixed with TRIzol Reagent (Invitrogen) (500 µL) and incubated at room temperature for 3 min. The solution was then mixed with chloroform (500 µL) and incubated at room temperature for 2 min. The solution was centrifuged at 13,000g for 15 min and the upper aqueous phase was mixed with an equal volume of ethanol. The RNA was purified using an RNA Clean & Concentrator-5 Kit (Zymo Research) and eluted into 10 µL H2O.
The RNase H treated RNA (10 µL) was mixed with the 5′ 32P radiolabeled ssDNA oligonucleotide (1.5 pmol, 4.5 µCi) and the splint oligonucleotide (Supplemental Table S3) (1 pmol) in a total volume of 26 µL Tris-HCl (30 mM, pH 7.5). The nucleic acid was annealed by incubating the solution at 75°C for 3 min followed by room temperature for 5 min. An amount of 3 µL SplintR Ligase buffer (10×) was added and the solution was incubated at 37°C for 5 min. An amount of 1 µL SplintR Ligase (25 U) (New England Biolabs) was added and the solution was incubated at 37°C for 1 h followed by 75°C for 5 min, and 5 min on ice. An amount of 2 µL FastAP Thermosensitive Alkaline Phosphatase (2 U) (Thermo Scientific) was added and the solution was incubated at 37°C for 20 min, followed by 75°C for 5 min. The nucleic acid was purified using an RNA Clean & Concentrator-5 (Zymo Research) and eluted in 7 µL H2O.
An amount of 7 µL of the nucleic acid was mixed with 1 µL BSA (10×), 1 µL micrococcal nuclease buffer (10×), and 1 µL micrococcal nuclease (2000 U) (New England Biolabs). The solution was incubated at 37°C for at least 3–4 h. An amount of 1 µL of the solution was spotted onto a TLC cellulose glass plate (20 × 20 cm). The TLC was resolved in two dimensions and imaged and quantified using a FX Phosphor Imager (Bio-Rad Laboratories) in combination with the QuantityOne 4.6.8 software. For the synthesis of 5′ 32P radiolabeled mononucleotide reference molecules, the in-house oligonucleotide synthesis, and the synthesis of 2′-OTBS-Bz-m6A-CE phosphoramidite, see Supplemental Material.
Depletion of ACTB mRNA
An amount of 60 µL of streptavidin magnetic beads (S-1421, New England Biolabs) was washed twice and resuspended in binding buffer (500 mM NaCl, 20 mM Tris-HCl pH 7.5, 1 mM EDTA), followed by adding 20 µL 100 µM biotinylated oligo complementary to the ACTB 5′ region (Supplemental Table S3). The mixture was incubated with occasional mixing at RT for 5 min. The beads were pulled away and washed twice with binding buffer. The streptavidin bound oligomers were resuspended in 50 µL of binding buffer, added to 450 ng heat denatured (72°C for 5 min) chicken embryo poly(A), and incubated for 30 min at RT. After binding, the beads were pulled away and the supernatant was kept and cleaned up using RNA Clean & Concentrator-5 (Zymo Research), eluted in 5 µL water, and 1 µL was used for RedBaron. The remaining beads were washed twice with the binding buffer followed by two washes with Tris-HCl (30 mM, pH 7.5) and were directly used for the RedBaron assay.
MeRIP-seq
Total RNA from three replicates of chicken embryos stage HH27 was isolated as previously described. This was followed by one round of poly(A) purification using oligo d(T) magnetic beads (New England Biolabs). A total of 1.5–2 µg of mRNA was fragmented to 100–150 nt using RNA Fragmentation Reagent (Thermo Fisher Scientific), followed by overnight ethanol precipitation. After centrifugation and washing, the pellets were resuspended in 10 µL H2O. An amount of 9 μL of the solution was used for the IP, and 1 µL for preparing the input libraries. The fragmented RNA was mixed with Protein G Magnetic Beads prebound monoclonal anti-m6A antibody (1 µL) from the EpiMark N6-Methyladenosine Enrichment Kit (New England Biolabs), resuspended in 300 µL EpiMark IP buffer supplemented with murine RNase inhibitor (New England Biolabs). All of the following steps were as described by the manufacturer. After the last wash, we carried out an extra washing step using H2O. We omitted the final elution step as we carried out the cDNA synthesis on the magnetic beads using a ScriptSeq v2 RNA-seq Library Preparation Kit (Illumina). The libraries were size selected using BluePippin DNA size selection system (Sage Science), and quality checked on Agilent High Sensitivity DNA Chips (Agilent Technologies). The pooled libraries were sequenced on Nextseq 500 (Illumina) DeepSeq at The University of Nottingham.
Sequencing analysis
Contaminating adapter sequences and low quality reads (phred scores <30) were removed using TrimGalore (v0.4.4). The processed fastq reads were aligned to the Ensembl annotated Chicken GRCg6a reference genome using STAR (v2.5.0), the resultant bam files were indexed using Samtools (v1.10, PMID:19505943), and m6A enriched regions were identified in m6A immunoprecipitated samples over inputs, using m6AViewer (v1.6.1) (PMID:28724534) (Antanaviciute et al. 2017). Bedtools (v2.27.1, PMID:20110278) was used to extend peaks by 100 bp upstream and downstream. Only those significant peaks represented in at least two replicates and fourfold enriched were taken forward for further analysis from the peak matrix data set generated in the RNAmod software (http://61.147.117.195/RNAmod) with default settings (Liu and Gregory 2019). Using the Peak matrix data set created by the RNAmod software, for single replicates a KEGG pathway enrichment analysis was carried out by this online tool. In addition, DAVID Bioinformatics Resources (Huang et al. 2009) (https://david.ncifcrf.gov/) was used for the KEGG pathway analysis of the 3′-UTR methylated chicken transcripts conserved between mouse and chicken. For finding conserved methylated transcripts between chicken and mouse, we downloaded the complete gene list of all vertebrate homologs from MGI (http://www.informatics.jax.org/homology.shtml) and the peak files for mouse embryoid bodies (Geula et al. 2015) from REPIC (https://repicmod.uchicago.edu/repic) (Liu et al. 2020b).
Gel shift assay
To assess the binding of the modified and unmodified zipcode RNA oligonucleotides to the recombinant ZBP1KH3–KH4 protein, we carried out gel shift assays. The RNA oligonucleotides (Supplemental Table S3) were end labeled using ATP [γ-32P] and T4 polynucleotide kinase, followed by purification using a QIAquick Nucleotide Removal Kit (QIAGEN) and eluted with H2O. The recombinant ZBP1KH3–KH4 (16 nM) and the RNA oligonucleotides (Supplemental Table S3) (2.5 nM) were incubated for 3 h at the same conditions described by Chao et al. (2010). The protein–RNA complexes were resolved on 5% TBE polyacrylamide precast gels (Bio-Rad Laboratories), and for imaging purposes were transferred onto Hybond-N membranes (GE Healthcare) followed by an exposure to phosphor screen (FUJI). The scanned images (FX scanner Bio-Rad Laboratories) were quantified using the QuantityOne 4.6.8 software (Bio-Rad Laboratories). For determining the Kd values, we used oligonucleotide concentrations 0.5, 1.5, and 2.5 nM, incubation time was on ice and more than 8 h. We calculated the equilibrium concentrations of the bound complex, the unbound oligonucleotide and protein. These values were used to calculate the Kd values for each concentration and oligonucleotides. Standard deviation was calculated for the three Kd values of each five oligonucleotides and P-values were calculated from t-test (one-tailed, unequal variance).
Protein expression
The PCR product of the truncated ZBP1KH3–KH4, 404–561 with a C terminal His tag added was cloned into the pMAL-c5x vector (New England Biolabs) and was transformed in E. coli (DH5α). The recombinant protein was induced with 2% ethanol and 0.4 mM IPTG and grown for 20 h at 18°C. The cells were pelleted by centrifugation and resuspended in Ni column equilibration buffer (20 mM Na3PO4; 300 mM NaCl; 10 mM Imidazole at pH 7.4) and lysed by sonication. ZBP1KH3–KH4 was purified using the gravity flow column with HisPur Ni-NTA resin (Fisher Scientific).
DATA DEPOSITION
All data are accessible from NCBI under the GEO accession number GSE185078.
SUPPLEMENTAL MATERIAL
Supplemental material is available for this article.
ACKNOWLEDGMENTS
Work in the laboratories of R.G.F., C.J.H., H.M.K., C.S.R., and N.P.M. was supported by the Biotechnology and Biological Sciences Research Council Doctoral Training Program (BB/I024291/1) to F.B. and E.B. N.P.M. was supported by the Prostate Cancer Foundation–John Black Charitable Foundation Challenge Award (20CHAL04) and R.G.F. by BBSRC (grant BB/K013637/1). Work in C.S.R.’s laboratory was supported by a Faculty of Medicine and School of Veterinary Medicine and Science, University of Nottingham strategic grant. N.A. is a Nottingham Research Fellow funded by the University of Nottingham.
Footnotes
-
Article is online at http://www.rnajournal.org/cgi/doi/10.1261/rna.079615.123.
-
Freely available online through the RNA Open Access option.
- Received January 31, 2023.
- Accepted February 6, 2023.
This article, published in RNA, is available under a Creative Commons License (Attribution-NonCommercial 4.0 International), as described at http://creativecommons.org/licenses/by-nc/4.0/.
REFERENCES
MEET THE FIRST AUTHOR

Meet the First Author(s) is an editorial feature within RNA, in which the first author(s) of research-based papers in each issue have the opportunity to introduce themselves and their work to readers of RNA and the RNA research community. Francis Baron is the first author of this paper, “The importance of m6A topology in chicken embryo mRNA: a precise mapping of m6A at the conserved chicken β-actin zipcode.” Francis completed his PhD at the University of Nottingham, in the UK, supervised by Christopher Hayes in the School of Chemistry and Rupert Fray in the School of Biosciences and continued this work during a brief post doc. This research focused on the study of modified nucleotides in RNA.
What are the major results described in your paper and how do they impact this branch of the field?
We developed a method for the detection and quantification of m6A in RNA at single nucleotide resolution and used this method to map and quantify an m6A site in the chicken β-actin zipcode. We demonstrated that methylation of this site enhances ZBP1 binding in vitro, while methylation of a nearby adenosine abolishes binding. This suggests that m6A may play a role in regulating localized translation of β-actin mRNA.
What led you to study RNA or this aspect of RNA science?
My interest in RNA was first sparked during my undergraduate degree. I am interested in the existence of modified nucleotides and the role they play in the regulation of gene expression. It is particularly exciting to work within such a rapidly developing area of molecular biology.
What are some of the landmark moments that provoked your interest in science or your development as a scientist?
The areas of research that initially sparked my interest in molecular biology were CRISPR gene editing, and the research into expanding the genetic code using unnatural amino acids, which first introduced me to the possibilities of molecular biology.




