


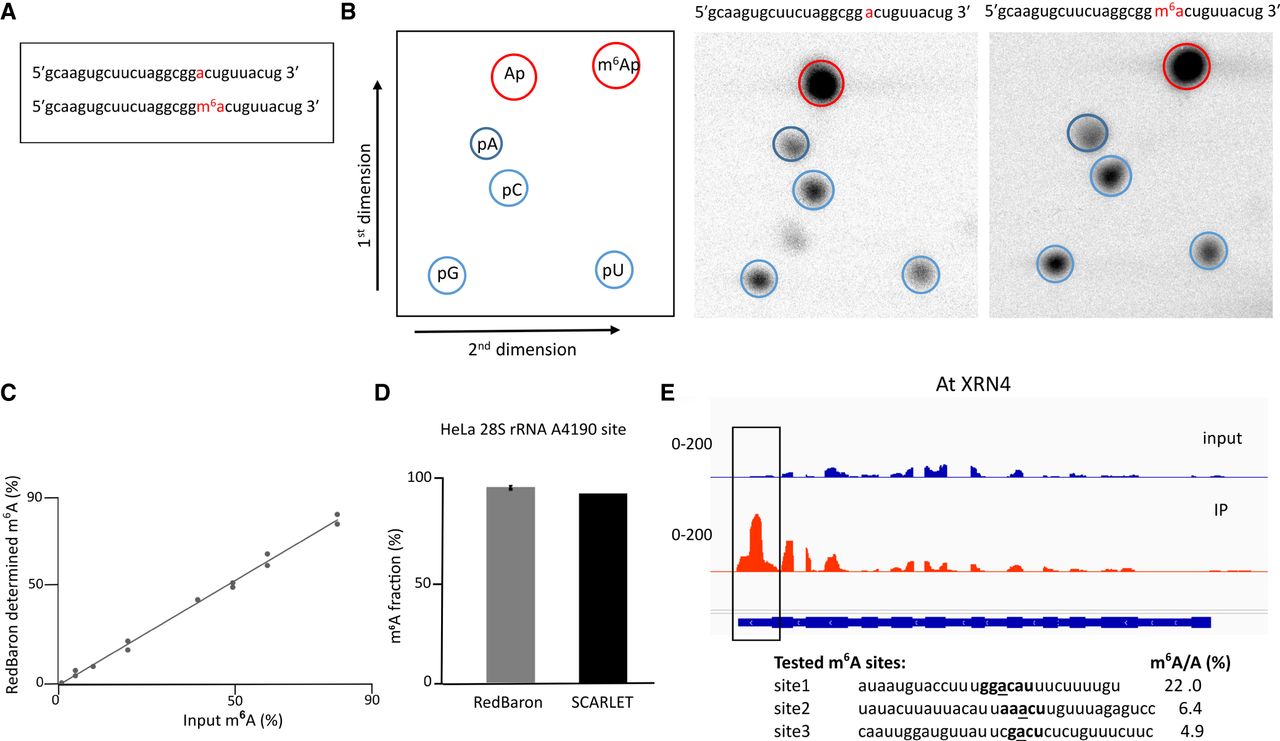
Detection and quantification specific sites using the RedBaron method. (A) Synthetic RNA oligonucleotides containing either A or m6A at position 19. (B) Two-dimensional TLC analysis is used to differentiate between the AP and m6AP nucleoside monophosphates (red) generated by the RedBaron method. (Left) Schematic picture of the TLC plate; (center) unmodified RNA template; (right) m6A modified RNA template. The 5′ nucleoside monophosphates (pA, pG, pC, and pU) are used as reference molecules (blue). (C) The m6A/A ratios from the TLCs are accurately representing the concentration ratios of the two synthetic oligonucleotide mixes. (D) The RedBaron analysis of HeLa 28S rRNA site A4190 showed an average of 99% m6A. This is similar to the SCARLET method's 96% reported in Liu et al. (2013). Error bars for the RedBaron method show the standard deviation from three replicates; the SCARLET value is the published data from Liu et al. (2013). (E) Site-specific quantification of three m6A in the A. thaliana XRN4 mRNA. The IGV image shows the methylation peak in the XRN4 3′ UTR. We used the data from Zhang et al. (2022). The three chosen sequences for the RedBaron assay were under the summit of the peak detected by MeRIPSeq.




