


E. coli 6S RNA complexed to RNA polymerase maintains product RNA synthesis at low cellular ATP levels by initiation with noncanonical initiator nucleotides
- Christopher D. Bonar1,2,
- Jonathan Han1,3,
- Robert Wang1,4,
- Shanker Shyam Sundhar Panchapakesan1,5 and
- Peter J. Unrau1
- 1Department of Molecular Biology and Biochemistry, Simon Fraser University, Burnaby, B.C. V5A 1S6, Canada
- 2Department of Chemistry and Biochemistry, University of Notre Dame, Notre Dame, Indiana 46556, USA
- 3Faculty of Medicine, University of British Columbia, Vancouver, B.C. V6T 1Z3, Canada
- 4Cheriton School of Computer Science, University of Waterloo, Waterloo, Ontario N2L 3G1, Canada
- 5Department of Molecular, Cellular and Developmental Biology, Yale University, New Haven, Connecticut 06520-8103, USA
- Corresponding author: punrau{at}sfu.ca
Abstract
The E. coli 6S RNA is an RNA polymerase (RNAP) inhibitor that competes with σ70-dependent DNA promoters for binding to RNAP holoenzyme (RNAP:σ70). The 6S RNA when bound is then used as a template to synthesize a short product RNA (pRNA; usually 13-nt-long). This pRNA changes the 6S RNA structure, triggering the 6S RNA:pRNA complex to release and allowing DNA-dependent housekeeping gene expression to resume. In high nutrient conditions, 6S RNA turnover is extremely rapid but becomes very slow in low nutrient environments. This leads to a large accumulation of inhibited RNAP:σ70 in stationary phase. As pRNA initiates synthesis with ATP, we and others have proposed that the 6S RNA release rate strongly depends on ATP levels as a proxy for sensing the cellular metabolic state. By purifying endogenous 6S RNA:pRNA complexes using RNA Mango and using reverse transcriptase to generate pRNA-cDNA chimeras, we demonstrate that 6S RNA:pRNA formation can be simultaneous with 6S RNA 5′ maturation. More importantly, we find a dramatic accumulation of capped pRNAs during stationary phase. This indicates that ATP levels in stationary phase are low enough for noncanonical initiator nucleotides (NCINs) such as NAD+ and NADH to initiate pRNA synthesis. In vitro, mutation of the conserved 6S RNA template sequence immediately upstream of the pRNA transcriptional start site can increase or decrease the pRNA capping efficiency, suggesting that evolution has tuned the biological 6S RNA sequence for an optimal capping rate. NCIN-initiated pRNA synthesis may therefore be essential for cell viability in low nutrient conditions.
Keywords
INTRODUCTION
The Escherichia coli 6S regulatory RNA binds to RNA polymerase holoenzyme (RNAP:σ70) and consequently suppresses σ70-dependent housekeeping gene expression (Wassarman and Storz 2000; Wassarman 2018). Precursor 6S RNA transcripts are transcribed from the ssrS gene, which has two promoters that allow for 6S RNA expression in a range of environmental conditions. The σ70-dependent Promoter 1 transcription start site (TSS) is located 9 bp upstream of the mature 5′ end of the 6S RNA sequence, whereas the σ38 and σ70-dependent Promoter 2 TSS is located 224 bp upstream (Fig. 1A). The resulting precursor transcripts are then shortened by 5′ and 3′ processing into the 184-nt-long 6S RNA (Kim 2004; Lee et al. 2013). A mature 6S RNA consists of an RNA hairpin containing a large central bulge (CB) that mimics an open DNA transcriptional bubble (Fig. 1B). Toward the upstream hairpin, two highly conserved bulges (LB1–LB2) (Barrick et al. 2005) are critical for RNAP:σ70-binding (Shephard et al. 2010) and induce a B-form helical conformation in the 6S RNA that mimics a −35 DNA promoter element able to bind the σ704 subdomain (Chen et al. 2017). RNAP is then able to utilize the 6S RNA as a template to synthesize a short product RNA (pRNA; 13- to 20-nt-long [Wassarman and Saecker 2006]), which canonically initiates with ATP at the well-conserved U44 transcriptional start site (Fig. 1C; Shephard et al. 2010). Synthesis of this pRNA uses the highly conserved lower arm of the downstream helix (DH) and downstream bulge regions RB1 and RB2 as template, enabling the upper arm of the DH to form a stem–loop with the conserved −10 sequence region. This hairpin destabilizes σ70 binding and facilitates the release of the 6S RNA from RNAP as a 6S RNA:pRNA complex (Fig. 1D; Beckmann et al. 2012; Panchapakesan and Unrau 2012; Chen et al. 2017).
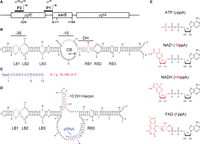
ssrS promoter structure, E. coli 6S RNA secondary structures, pRNA sequence and potential product RNA initiators. (A) Map of the ssrS gene. P1 refers to σ70-dependent Promoter 1, P2 refers to Promoter 2 dependent on both σ38 and σ70 (adapted from Kim 2004, by permission of Oxford University Press). (B) 6S RNA in its free state; resembles a DNA transcriptional bubble. “−35” and “−10” refer to DNA-like regions for RNAP interactions. Highly conserved residues present in the γ-proteobacteria are shown in pink (Shephard et al. 2010). The bubbles to the left (LB1; LB2; LB3) and to the right (RB1; RB2; RB3) of the large central bubble (CB) are noted together with the downstream helix (DH). The pRNA transcription start site (TSS, U44) is indicated by the arrow. (C) Expected 13 nt pRNA sequence for E. coli where X represents p (phosphate) for ATP, +N for NAD+, HN for NADH, or F for FAD initiator incorporation. (D) The 6S RNA:pRNA complex after release from RNAP:σ70 holoenzyme. An intramolecular hairpin (−10:DH hairpin) arises when pRNA elongates by at least 8 nt (Panchapakesan and Unrau 2012); X (shown in red) represents the potential for noncanonical initiation of the release pRNA as shown in panel C. (E) Chemical structures of the known pRNA transcriptional initiator ATP and potential initiators NAD+, NADH, and FAD. The adenosine diphosphate shared by all initiators is indicated in black with the differing functional groups shown in red.
Competition between the 6S RNA and housekeeping σ70-dependent DNA promoters continuously exists for RNAP-binding. As the release rate of 6S RNA is very sensitive to NTP concentrations, this competition is highly responsive to nutrient conditions. In high nutrient conditions where E. coli are in the exponential phase, the 6S RNA repeatedly binds to and rapidly releases from RNAP. However, the 6S RNA releases slowly in low nutrient conditions, when E. coli cells are in stationary phase, and accumulates to ∼10-fold higher levels (Wassarman and Storz 2000), effectively suppressing σ70-dependent housekeeping transcription. The accumulation of inhibited 6S RNA:RNAP:σ70 (RNA–protein) complex in stationary phase allows cells to rapidly resume transcription appropriate for exponential growth by releasing the 6S RNA from RNAP once high nutrient conditions are encountered (Wassarman and Saecker 2006). This global inhibition of transcription in stationary phase must be carefully balanced as expression of release-defective 6S RNA mutants significantly inhibits colony formation even in rich media (Oviedo Ovando et al. 2014).
ATP canonically initiates pRNA synthesis in E. coli (Wassarman and Saecker 2006; Cavanagh et al. 2011), but other initiation factors appear likely to replace ATP when ATP concentrations are low. E. coli RNAP:σ70 can capably initiate pRNA synthesis using GTP when the initiating TSS template residue is mutated from U to C (U44C) (Cabrera-Ostertag et al. 2013), implying that pRNA initiation with adenosine-diphosphate derivatives such as NAD(H) might be possible (Fig. 1C–E). We were therefore curious if this could indeed be the case. Several studies have demonstrated that bacterial mRNAs from housekeeping DNA promoters have 5′ pyrophosphate-bridged caps (Bird et al. 2016; Vvedenskaya et al. 2018). In eukaryotic cells, the process of adding a post-transcriptional 5′ cap to mRNA protects the RNA from degradation and is required for critical processes like translation initiation (Rottman et al. 1974; Shatkin 1976). Such capped RNAs possess a 7-methylguanosine linked to the penultimate nucleotide via a 5′–5′ triphosphate bridge. While such 5′ caps have been widely documented and investigated in eukaryotic and viral gene expression (Furuichi and Shatkin 2000), pyrophosphate-bridged nicotinamide caps have only been recently characterized. Interestingly, NAD(H)–RNAs are known to exist in significant quantity within bacteria (Chen et al. 2009; Cahová et al. 2015) and yeast (Walters et al. 2017). These 5′ nicotinamide caps, much like their 7-methylguanosine counterparts in eukaryotes, stabilize RNA against 5′ processing (Mackie 1998; Cahová et al. 2015; Bird et al. 2016; Vasilyev et al. 2019). Many bacterial NAD(H)–mRNAs are transcribed from protein-encoding genes, and other NAD(H)–RNAs transcripts are involved in regulatory processes (Zhang et al. 2021). Prior to degradation, NAD(H)–RNAs are decapped by specific enzymes like NudC (Cahová et al. 2015; Höfer et al. 2016). Unlike eukaryotic 5′–5′ 7-methylguanosine capping, which is a post-transcriptional modification, the nicotinamide adenine dinucleotides (NAD+, NADH) and flavin adenine dinucleotide (FAD) (Fig. 1E) are incorporated during transcription initiation (Bird et al. 2016; Vvedenskaya et al. 2018). The incorporation of such noncanonical initiator nucleotides (NCINs) by RNAP is sensitive to the interaction of the NCIN with the DNA template strand while in the RNAP active site (Bird et al. 2016; Vvedenskaya et al. 2018). We therefore speculated that NCIN capped pRNAs might occur using RNAP and the 6S RNA as a template, and that NCINs might play an important role in global 6S RNA-dependent transcriptional regulation.
RESULTS
Imaging the 6S RNA in stationary phase cells and purifying product RNA via RNA Mango
We endogenously modified the ssrS gene in E. coli using CRISPR technology (Zhao et al. 2017) to contain a fluorogenic RNA Mango III (MIII) tag (Dolgosheina et al. 2014; Autour et al. 2018) in the 6S RNA stem–loop, creating a MIII ssrS strain able to express RNA MIII-tagged 6S RNA (6S RNAM) (Supplemental Fig. S1, see Materials and Methods). This strain grew normally, and when grown into stationary phase and stained with TO1-Biotin (see Materials and Methods), only the MIII ssrS cells and not the wild-type cells were observed to display significant MIII-induced fluorescence (Fig. 2). These observations are consistent with the known accumulation of 6S RNA in stationary phase (Wassarman and Storz 2000). The MIII ssrS strain also enabled robust 6S RNAM pull-down experiments (Fig. 3A) from bacterial RNA extracts as previously demonstrated using plasmid-based Mango I-tagged 6S RNA expression (Panchapakesan et al. 2017). 6S RNAM:pRNA complexes extracted from bacterial outgrowth time points were immobilized on streptavidin magnetic beads using TO1-Biotin and washed. The immobilized 6S RNAM:pRNA was then subjected to reverse transcription to create a pRNA-cDNA chimera (cpRNA, cDNA radiolabeled) that extended a pRNA with cDNA to the 5′ end of the 6S RNAM. This cpRNA was then eluted using denaturing conditions for further analysis (Fig. 3, see Materials and Methods).
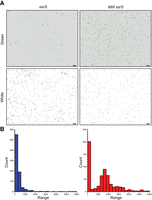
E. coli cells encoding RNA Mango III-tagged 6S RNA accumulate fluorescence during stationary phase. Cells grown overnight in media containing 20 µM TO1-Biotin were imaged at 40× magnification using an EVOS FL Auto 2 microscope. (A) Wild-type (ssrS) and CRISPR-modified (MIII ssrS) cells. Fluorescing cells from staining in TO1-Biotin were identified using the green channel (482 nm excitation and 524 nm emission) (top panels). Cell locations were identified using white light imaging (bottom panels). Scale bar in each panel is 10 µm. (B) Bar graphs quantifying the observed accumulation of green fluorescence in stationary phase cells. Blue refers to the ssrS strain (n = 848), and red refers to the MIII ssrS strain (n = 609). The raw integrated density for each cell was scored using ImageJ. “Range” refers to a set of raw integrated intensities, and “Count” refers to the number of cells quantified for each raw integrated intensity. Histograms were generated using KaleidaGraph.
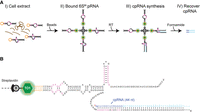
Mango III-dependent purification of the 6S RNA:pRNA complex and pRNA-cDNA chimera generation. (A) Schematic Mango purification protocol adapted from Panchapakesan et al. (2017) to include pRNA-cDNA chimera (cpRNA) synthesis. (I) Crude MIII ssrS RNA extracts were prepared from chilled, methanol fixed cell culture samples. 6S RNAM is shown in black with conserved regions in pink, and the MIII tag in orange. Hybridized pRNA in a 6S RNAM:pRNA complex is shown in blue. Extraneous cellular RNA is shown in brown. (II) 6S RNAM:pRNA complexes were immobilized on streptavidin magnetic beads (“S”) derivatized with TO1-Biotin (shown in green and light gray) and washed. (III) Reverse transcription (RT) generates bead-immobilized pRNA–DNA (cpRNA) chimeras. The cDNA of cpRNA is shown in light blue. (IV) Formamide elution recovers cpRNAs for further downstream analysis. (B) Secondary structure of a 6S RNAM:cpRNA complex bound to streptavidin beads. Radioactive cpRNA was generated by spiking the RT step with α-32P dATP. “B” of TO1-Biotin refers to biotin bound to streptavidin, and “TO1” refers to thiazole orange. For fully matured 6S RNA, this cpRNA is 44-nt-long. Dashed lines at the 6S RNAM 5′ end (cpRNA 3′ end) imply potentially longer 6S RNA and cDNA lengths resulting from immature 6S RNA.
Product RNA size and 6S RNA maturation are highly correlated
We used Mango-purified cpRNAs from bacterial outgrowth time points to explore the potential relationship between 5'-end processing of the 6S RNA and pRNA production (Fig. 4A). For each outgrowth time point, the greatest cpRNA band intensity was observed at 44 nt. The bands at cpRNA lengths longer than 44 nt were less intense and included sizes of 49 and 54 nt, as judged by a ssrS sequencing ladder. These bands were observed in the 0, 4, 8, and 16 min outgrowth time points and disappeared in later time points (Fig. 4B). Based on our optimization of alkaline hydrolysis conditions, we assume that removal of RNA residues by alkaline hydrolysis from the cpRNAs was complete: leaving only the radiolabeled cDNAs. The dominant 44 nt band now predominantly migrated as a 31 nt band consistent with the removal of a 13 nt pRNA observed in vitro (Wassarman and Saecker 2006; Panchapakesan and Unrau 2012). Notable bands of lesser intensity in the hydrolysis lanes were observed of size 32 nt and longer together with two bands shorter than 31 nt. This suggested that pRNAs of size 12 and shorter, together with pRNA longer than 13 nt are also generated biologically.
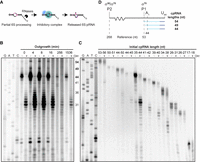
A range of 6S RNA processing events are associated with pRNA production in early outgrowth time points. (A) RNA transcription and ribonucleases process the 5′ termini of the 6S RNA (Kim 2004) prior to or during loading into the inhibitory complex, which are then released by pRNA synthesis. The RNAP core is shown in teal, and σ70 is shown in blue. (B) cpRNAs as a function of outgrowth time. Each outgrowth cpRNA sample purified from MIII ssrS bacteria was loaded either without or with alkaline hydrolysis treatment so as to measure the cDNA size. Dideoxy size ladders were generated by RT extension of synthetic DNA primer 5′-ATC GGC TCA GGG G-3′ adapted from the expected pRNA sequence. cpRNAs were labeled with α-32P dATP using RT. (C) Individual bands found in the 4 min time point shown in panel B were excised and subjected to complete alkaline hydrolysis. Bands are ordered by decreasing cpRNA length from left to right. The cpRNA bands indicative of 5′-precursor and matured 6S RNA species are marked by bold length numbers in the gap between the two gels. All samples purified by Mango and PAGE were normalized by cpRNA concentration and resolved using 10% denaturing PAGE. (D) Observed cpRNA sizes are related to 5′ mature 6S RNA as well as primary transcripts initiated at promoters P2 and P1.
To explore the relationship between the 6S RNA 5′ terminus and pRNA size more carefully, the cpRNA bands observed from 4 min of outgrowth were carefully excised from a gel and loaded into a second gel, each sample both without and after alkaline hydrolysis treatment (Fig. 4C). This allowed the length of the pRNA products found in each cpRNA band to be more precisely determined within separate ranges of initial cpRNA length (Fig. 4D). The 54 nt band partially hydrolyzed to a 41 nt band (Fig. 4C, lanes “53–56”), indicating the presence of a 13-nt-long pRNA in this cpRNA. The 54 nt length of this cpRNA is also one nucleotide longer than the known conserved TSS (Shephard et al. 2010) of the P1 promoter, suggesting that this cpRNA band resulted from the incomplete processing of the P2 transcript or could result from an untemplated extension by RT (Fig. 4D). The 49 nt band hydrolyzed to five bands ranging from 31- to 36-nt-long, indicating pRNAs of size 13 to 18 nt were present in this chimera, which could have resulted from either the P1 or the P2 primary transcripts. The dominant 44 nt band hydrolyzed to a 31 nt band as expected. Longer 32 and 33 nt hydrolysis products from this band were, respectively, 3- and 10-fold less intense than the 31 nt main band, and decreased intensities were also observed from a ladder of shorter hydrolysis products ranging from 30 to 22 nt in size (Fig. 4C, lanes “35–44”). Thus, pRNA of size 11 and 12 together with pRNA from 14 to 22 nt in size are present in the 6S RNA:pRNA complexes formed during exponential growth. The cpRNA bands shorter than 41 nt after hydrolysis revealed pRNA bands of comparable size to those observed in the longer cpRNA bands and are suggestive of degradation of the 6S RNA template at its 5′ terminus. Taken together, we have found evidence that pRNAs longer than 13 nt are routinely produced in vivo and that primary 6S RNA transcripts can be incompletely processed at their 5′ termini and still bind to RNAP, producing pRNAs in exponential growth. This effect disappears at longer outgrowth time points presumably due to bacteria transitioning to stationary phase where turnover of the 6S RNA is slower, allowing more complete maturation by RNase E and G (Kim 2004).
RNAP can utilize NCINs to release the 6S RNA in vitro
To investigate the effect of NCINs on 6S RNA release from the RNAP:σ70 complex, a native binding and release assay was performed on internally radiolabeled, synthetic 6S RNAM (Fig. 5). This assay relied on a previous observation that withholding ATP from release conditions substantially ablates 6S RNA:pRNA formation but can be rescued by the addition of AU dinucleotide (Wassarman and Saecker 2006; Panchapakesan and Unrau 2012). Addition of ATP initiated pRNA synthesis as expected, producing a 6S RNAM:pRNA band with slightly retarded mobility relative to the free 6S RNAM as previously observed. NAD+, NADH, and FAD in this assay also triggered 6S RNA release and 6S RNAM:pRNA formation after 32 min of incubation (Fig. 5). On the time scale of this experiment, release efficiency by NAD+ and NADH in the absence of ATP appeared comparable to that produced by ATP, while FAD was around twofold less effective as a pRNA transcriptional initiator. The nicotinamide redox cofactors that are present in stationary phase cells at high concentrations (Table 1) can thus initiate pRNA synthesis and trigger 6S RNAM:pRNA release in vitro.
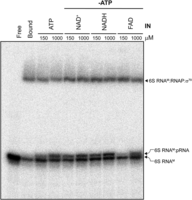
6S RNA release is enabled in vitro by NCINs when ATP is absent. Native shift assay of internally radiolabeled synthetic 6S RNAM releasing from RNAP, relative to free 6S RNAM and 6S RNAM:RNAP:σ70 controls (”Free” and “Bound”). IN refers to each “initiator nucleotide”: ATP, NAD+, NADH, and FAD. Two negative controls lacking ATP and NCIN were prepared: “free” (6S RNAM) and “bound” (6S RNAM:RNAP:σ70 complex). ATP was then added at 150 µM and 1000 µM as two positive controls. Each NCIN reaction was performed in the absence of ATP (“−ATP“) for 32 min using the indicated concentrations of NCIN. Samples were normalized by 6S RNAM specific activity and resolved in a 5% native gel containing 5% glycerol at 4°C.
Average metabolite concentrations during exponential phase and stationary phase in E. coli
We then synthesized radiolabeled pRNA initiated with NCINs for further investigation and found that high percentage polyacrylamide gels effectively resolved 5′-capped and 5′-triphosphorylated pRNAs. ATP-initiated, 5′-triphosphate pRNA moved faster than pRNAs initiated with NAD+ or NADH (Fig. 6A). NAD+-initiated pRNA having a slower mobility as the NAD+-pRNA nicotinamide cap is more positively charged than either the NADH cap or the triphosphate resulting from initiation with ATP. Denaturing gels cast together with 3-(Acrylamido) phenylboronic acid (APB) enhanced these cap-dependent mobility differences further (Fig. 6B; Nübel et al. 2017), providing further evidence of 6S RNA-dependent capped pRNA synthesis. We then applied various 5′-processing enzymes (Vvedenskaya et al. 2018) to the ATP, NAD(H) and FAD-pRNA species (Fig. 6C). As expected, CIP treatment removed the 5′ phosphates from ATP-initiated pRNAs and RppH treatment removed the 5′ pyrophosphate via pyrophosphorolysis (Fig. 6D). CIP treatment of internally labeled pRNAs produced a slower mobility only in the ATP-initiated pRNAs (Fig. 6E), consistent with the removal of 5′ phosphates at the ATP-initiated products but not of the NCIN-protected 5′ termini. Likewise, the pyrophosphorolysis activity of RppH had no effect on the NCIN-initiated bands and altered the mobility only for the ATP-initiated pRNAs. All NCIN-initiated pRNAs showed dramatically faster mobility upon the addition of NudC decapping enzyme, while the ATP-initiated pRNA mobility was left unaltered. This is consistent with enzymatic decapping of the NCIN-initiated RNA bands (Fig. 6E) as previously observed (Cahová et al. 2015; Bird et al. 2016) for mRNA capping. We therefore conclude that adenosine-containing metabolite caps such as NADH, NAD+ and FAD can initiate pRNA synthesis by bacterial RNAP.
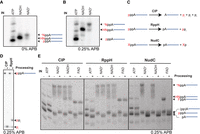
NAD(H) and FAD-modified pRNA products produced in vitro. (A) Denaturing gel analysis of NAD(H) containing pRNAs produced in vitro. (B) APB denaturing gel analysis of the same samples. Both gels in panels A and B were resolved using 20% denaturing PAGE. (C) RNA processing by CIP, RppH and NudC. The shared adenosine diphosphate is shown in black, whereas the differing upstream moiety is shown in red. X refers to a 5′ cap. (D) 5′ processing of in vitro synthesized pRNA using γ-32P ATP and processed with CIP and RppH. (E) 5′ processing of in vitro synthesized α-32P UTP radiolabeled pRNA species using CIP, RppH, and NudC. “(pp)A” refers to the 5′ terminal end of pRNAs containing either “ppA” or “A” (5′-OH), as these pRNA species migrate with similar velocities. 5′-triphosphorylated (“pppA”) pRNAs (ATP ± CIP conditions) shown in panel E run faster than A-pRNAs, given that pppA–pRNAs have more negative charges. The pA–pRNAs migrate faster than the pppA–pRNAs (panel E, lanes ATP ± RppH) due to less weight. These band patterns reflect a mixture of pRNAs initiated with a capped adenosine (slower mobility; NAD[H] or FAD) or ATP (fast mobility). Low amounts of HNppA–pRNA (NADH–pRNA) band are likely due to 5′ oxidation, resulting in +NppA–pRNA (NAD+-pRNA). The ppA–pRNAs are assumed to have come from cap degradation. Samples in panels D and E were normalized to the same pRNA specific activity after Mango purification and resolved using 23% denaturing PAGE containing 0.25% APB.
6S RNA sequence determines the efficiency of NAD+ initiation
We next explored the ability of NAD+ to compete with ATP for pRNA initiation and the effect of 6S RNA sequence (Fig. 7A) on NAD+ capping using an APB denaturing PAGE in vitro assay. Alongside ATP-only and NAD+-only initiator control lanes (each at 1 mM), NAD+ concentration was fixed at 1 mM and ATP was decreased from 100 to 10 to 1 µM, giving [NAD+]:[ATP] ratios of 10, 100, and 1000, respectively. The WT A45 sequence incorporated ∼50% NAD+ when the [NAD+]:[ATP] concentration ratio was 1000:1 (Fig. 7B), indicating that 6S RNA templated NCIN initiation prefers ATP over NAD+ as an initiator. Mutation of A45 to A45U increased NAD+ incorporation ∼30-fold relative to A45 (see Materials and Methods). A45C produced pRNA products rather weakly but had even higher NAD+ incorporation efficiency than A45U. In distinct contrast, A45G strongly preferred ATP initiation and showed no detectable NAD+ incorporation. It is interesting to note in this context that the A45 position is nearly absolutely conserved in the γ-proteobacteria with thirty sequences containing A45 and one sequence possessing A45G (Shephard et al. 2010).
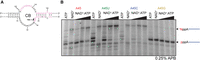
NAD+ capping efficiency is strongly modulated by 6S RNA sequence in vitro. (A) 6S RNA with A45 underlined. (B) Competitive in vitro pRNA synthesis using A45N 6S RNA templates with NAD+ concentration held constant at 1 mM and ATP decreasing from 100 to 10 to 1 µM. Samples were normalized by pRNA specific activity and resolved using 23% denaturing PAGE containing 0.25% APB.
Cellular pRNA synthesis can be initiated by NCINs
Finally, to determine whether NCINs initiate pRNA synthesis during exponential growth and upon entry into stationary phase, we analyzed the 5′ end of bacterially derived cpRNAs by enzymatic pyrophosphorolysis/decapping and RNA adapter ligation (Ebhardt et al. 2005; Vvedenskaya et al. 2018). We first incubated purified cpRNA chimeras with RppH to selectively ligate an adapter RNA sequence onto the 5′-monophosphate ends derived from 5′-triphosphorylated cpRNAs (Fig. 8A). In a second workflow, capped cpRNAs were specifically ligated. We first applied CIP to remove uncapped 5′ phosphates from the cpRNAs. Then, NudC was used to decap cpRNAs so as to allow capped cpRNAs to be ligated (Fig. 8B). Upon overnight adapter ligation and PAGE analysis, we then quantified the ligation efficiencies (Fig. 8C,D). The RppH pyrophosphorolysis assay indicated that 5′ triphosphate-containing cpRNAs decreased eightfold (from ∼40% ligated at 0 min to ∼5% ligated at 256 min). Interestingly, we saw a slight increase to ∼15% ligation at 1536 min in the “−RppH“ lane (Fig. 8A,C), perhaps suggesting an increase of intrinsic pyrophosphorolysis activity as bacterial outgrowth proceeds. The NudC decapping assay indicated that capped cpRNAs increased sixfold from a low level of ∼5% ligated at time 0 to ∼30% by the 1536 min time point. These ligation studies suggest that approximately twofold more capped cpRNAs than triphosphate cpRNAs exist in the late stage time point. The presence of a ligation product in the “−NudC” sample at 1536 min of outgrowth (Fig. 8B) could not be easily explained as our initial CIP treatment should have removed any 5′ phosphates from this sample material (Fig. 8B,D). We further verified the presence of capped cpRNAs by APB denaturing PAGE analysis of the 1536 min time point. Treatment here with NudC resulted in ∼30% of this cpRNA shifting downward in the gel, consistent with our ligation results and the presence of capped cpRNA species (Fig. 8E). Therefore, NCINs in bacterial cells rescue pRNA initiation when cellular ATP concentrations decrease as cells enter stationary phase.
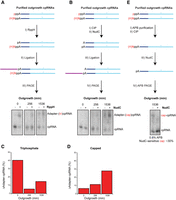
In vivo NCINs are used for pRNA initiation as cells enter stationary phase. Preparation and diagnosis of the 5′ end of Mango-purified, PAGE-purified outgrowth cpRNAs radiolabeled with α-32P dATP. (A) Triphosphate cpRNA ligation procedure. (I) RppH treatment. (II) 5′ RNA adapter (purple) ligation. (III) Separation of adapter ligation products and unligated cpRNA by 8% denaturing PAGE. (B) Capped cpRNA ligation procedure. (I) CIP treatment. (II) NudC treatment. Both ligation (III) and PAGE (IV) steps are the same as in II and III of panel A. (C) Quantification of ligation percentage from panel A triphosphate cpRNA procedure. (D) Quantification of ligation percentage from panel B capped cpRNA procedure. (E) Capped cpRNA APB gel analysis (1536 min of outgrowth, only). (I) APB Purification using 10% denaturing PAGE containing 0.8% APB. (II) CIP treatment. (III) NudC treatment. (IV) 10% denaturing PAGE containing 0.8% APB to resolve the cpRNAs. The histograms in panels C and D are determined from a single experiment.
DISCUSSION
The sequence requirements for optimal RNA-dependent NAD+ capping can be directly compared to DNA-dependent NCIN capping. Vvedenskaya et al. observed that DNA-dependent NAD+ capping is most strongly dependent on the TSS template base, which must be a T. This allows the adenine of NAD+ to base pair with the template strand during transcriptional initiation (Bird et al. 2016; Vvedenskaya et al. 2018). This requirement is fully met by the 6S RNA template, which initiates pRNA synthesis using template residue U44. The next most important DNA template position was found to be immediately upstream of the TSS. Optimal DNA-dependent capping required either a C or T template residue whereas A or G were found to inhibit capping, likely due to a clash between the nicotinamide base of NAD(H) and the upstream template purine (Vvedenskaya et al. 2018). We found under the assay conditions of Figure 7 that an RNA template with A45U directs NAD+ incorporation with the highest overall efficiency, that the A45C variant was even more selective for NAD+ than ATP (although with reduced initiation efficiency), and that A45G prevents NAD+ incorporation nearly entirely. This agrees almost completely with the RNA capping patterns determined by Vvedenskaya et al. using DNA promoters. A45, which only allows low levels of capping, is highly conserved in the γ-proteobacteria. Since in vitro 6S RNA mutations can strongly influence the efficiency of NCIN-based initiation this suggests but does not prove that evolution has faced a selective pressure to incorporate NCINs at a particular rate that is set by A45.
A possible reason for the natural selection of A45 could be to respond to changing cellular ATP concentrations. It is notable that when measuring single cell ATP concentrations in exponential phase, the average ATP concentration value per cell has a large standard deviation and skew (Yaginuma et al. 2014). This is consistent with a very broad range of cellular ATP concentrations existing within individual cells (Table 1). The instantaneous concentration of ATP, however, might be much lower and could reasonably be expected to fluctuate markedly. It might therefore be important to initiate pRNA synthesis using NAD(H) when ATP concentrations are transiently very low. We observe ∼5% capping in exponential phase and ∼30% capping in stationary phase E. coli (Fig. 8), indicating that NAD(H) can strongly compete for pRNA initiation. We estimate from our in vitro data (Fig. 7B) that this would correspond to an ATP concentration of ∼1 µM in stationary phase assuming an average NAD(H) concentration of 880 µM in stationary phase (Table 1; Fig. 7). This is much lower than published stationary phase average ATP concentrations. Similarly, very low levels of ATP appear to be present in exponential growth where ∼5% of the pRNAs are capped. This data would be difficult to explain with a model of pRNA synthesis using only known average ATP levels (Table 1), where ATP should easily outcompete NAD(H) as an initiator. Our data, however, would make sense if ATP concentrations can dramatically fluctuate on short time scales as just speculated, characterizing NAD(H) as a robust initiator when cellular ATP varies.
Related to this hypothesis, it is interesting that if a pRNA initiates with NAD(H), it appears likely that ATP concentration can be measured a second time by the 6S RNA system. As NAD(H) levels remain relatively high in stationary phase, NCIN-dependent initiation can still allow pRNA synthesis even when ATP concentrations drop to levels that might otherwise preclude initiation (Gaal et al. 1997). After initiation of pRNA synthesis, a second ATP is added at position 9 of the pRNA in E. coli 6S RNA template position U36 (Fig. 1C,D). In the γ-proteobacteria, this position is well conserved: encoding either ATP (30/31) or GTP (1/31) (Shephard et al. 2010). By using AU dinucleotide to initiate pRNA synthesis in the absence of ATP, we have previously demonstrated in vitro that the 6S RNA release rate is dramatically slowed in the absence of ATP but can still occur due to the wobble pair incorporation of GTP with respect to the U36 6S RNA template found at position 9 of the pRNA sequence. Since this position is immediately before the pRNA extension length required to trigger 6S RNA:pRNA release (Panchapakesan and Unrau 2012), this suggests that cellular ATP levels are in fact monitored twice: First, during initiation of pRNA synthesis when NCINs can be used when ATP levels are very low, and then a second time at position 9 of the pRNA when either ATP or GTP can be incorporated at rates dependent on their instantaneous cellular concentrations. This system of NCIN incorporation and secondary sampling could therefore allow the 6S RNA to respond in an extremely dynamic fashion to large fluctuations in ATP concentration.
In vivo, 5′-end maturation of the 6S RNA primary transcripts is carried out by RNase E and G (Kim 2004). Our data demonstrates that immature 6S RNA transcripts can bind to RNAP and produce a pRNA. As the −35 region of the 6S RNA plays the most critical role in RNAP:σ70 binding (Shephard et al. 2010; Chen et al. 2017), it appears unlikely that the exact 5′ and 3′ maturation of the 6S RNA plays a significant role in determining the on-rate of this RNA to RNAP. The presence of a cpRNA construct that extends 1 nucleotide upstream of the P1 transcript start site (Fig. 4) suggests that this product is derived from the P2 TSS start site. The existence of these products clearly indicates that immature 6S RNA products are viable constructs for RNAP holoenzyme-binding and pRNA production in exponential phase. The disappearance of this 54 nt band and the 49 nt band in stationary phase is consistent with increasing 5′-end maturation of the 6S RNA in stationary phase.
Given the discovery of NAD(H) capping in global 6S RNA-dependent transcriptional regulation and its sensitivity to cellular ATP levels, it would be interesting to explore how the cellular state in different nutrient conditions influences the efficiency of mRNA capping. Such mRNA capping which reaches a maximum of ∼20% in mid-exponential phase (Vvedenskaya et al. 2018) could be dramatically enhanced as stationary phase is approached—as we have found with the pRNA. Capped mRNAs have increased lifetimes (Mackie 1998; Deana et al. 2008; Bird et al. 2016), and there may be a currently unknown biological significance to impeding 5′-exonucleases and/or extending the life span of a pRNA with a cap. It is also possible that NCIN caps may contribute to increased pRNA lifetimes by limiting pRNA decay to 3′-exonucleases, although NudC is much less efficient at targeting capped RNA found in a duplex (Höfer et al. 2016). In Salmonella, Grad-Seq data suggests that pRNA is found to accumulate in a RNP complex of relatively low molecular weight distinct from the 6S RNA:RNAP complex (Smirnov et al. 2017). Further studies on possible interactions between 6S RNA:NAD(H)–pRNA complexes and cellular enzymes like RNase BN (Chen et al. 2016) could serve to further expand the biological function of NCINs in 6S RNA-mediated gene regulation.
MATERIALS AND METHODS
Cell imaging
A 1 µL aliquot of overnight grown wild-type (ssrS) E. coli and MIII ssrS E. coli cultures were each inoculated into tubes containing 500 µL LB media spiked with 20 µM TO1-Biotin. The inoculated tubes were then shaken at 250 rpm for 13.5 h at 37°C. An amount of 5 µL of each culture containing 20 µM TO1-Biotin was then pelleted at 4000 RCF for 5 min at room temperature and resuspended in 5 µL 1× M9 minimal salts and 20 µM TO1-biotin. A 2 µL aliquot of each resuspended strain was then added to a Poly-l-Lysine coated glass slide and, respectively, sealed with a coverslip. Afterwards, nail polish was added to secure the coverslip at its edges. This prepared slide was incubated at room temperature for 30 min to dry the nail polish and covered in aluminum foil to protect TO1-Biotin from light. The cells of each strain were then visualized at 40× magnification and 0.5 sec exposure using an EVOS FL Auto 2 microscope (Thermo Fisher). White light and the GFP (green) channel were used for cell imaging. Image processing and cell quantification for each image (Fig. 2) was performed using ImageJ, in which the total number of cells and their respective raw integrated intensity were counted in each green channel image.
In vivo pRNA extraction
Outgrowth of MIII ssrS E. coli
MIII ssrS E. coli were grown overnight to stationary phase via 250 rpm shaking at 37°C for 25.6 h to an OD of 1.9 in presterilized 1× LB media (1% Tryptone, 0.5% Yeast Extract, 1% NaCl) upon 1:100 inoculation with MIII ssrS culture, then resuspended in fresh 1× HK buffer (15 mM HEPES [pH 7.5], 90 mM KCl). The stationary cultures were then pelleted at 3000 RCF for 5 min at room temperature prior to resuspending to their original concentration with 1× HK Buffer (15 mM HEPES [pH 7.5], 90 mM KCl). 10× LB was then added to induce outgrowth at 180 mL of the resuspended culture to achieve 1× LB concentration. After gently shaking this culture for ∼5 sec, 16 mL was quenched with 20 mL of quench solution (99% methanol containing 1 mM EDTA) prechilled in a dry ice-ethanol bath as the 0-min time point. Subsequent shaking at 250 rpm, at 37°C, was applied to grow separate 16 mL culture aliquots with quenching at 4, 8, 16, and 1536 min as just described. Quenched outgrowth samples were stored at −80°C prior to further preparation.
TRIzol extraction
Total RNA extraction was performed using TRIzol (Sigma). Quenched outgrowth samples were pelleted at 16,000 RCF for 5 min and resuspended in 2 mL 1× HK supplemented with 1 mM EDTA. Cells were vortexed with 6 mL TRIzol to lyse cells, incubated at room temperature for 5 min, and then vortexed with 1.2 mL Chloroform. The tubes were kept still for 15 min at room temperature, then centrifuged at 7500 RCF for 15 min and 12,000 RCF afterwards for 5 min at 4°C. The aqueous layer was then recovered and mixed with 3 mL isopropanol and incubated at room temperature for 10 min. Afterwards, the samples were centrifuged at 12,000 RCF for 10 min at 4°C. Twice, the RNA pellets were washed with chilled 75% ethanol via 5 sec of vortex and centrifuged at 7500 RCF for 5 min at 4°C prior to decanting the supernatant. Pellets were then air-dried for 10 min, resuspended in ddH2O, and stored as aliquots at −80°C.
Mango purification of 6S RNAM:pRNA complexes and chimeric pRNA generation
Preparation of Mango purification (Fig. 3A) was adapted from Panchapakesan et al. (2017) using Streptavidin M-270 Dynabeads (Invitrogen) and a DynaMag-2 Magnet (Thermo Fisher). Wash is defined as 2 min of rotation, followed by 1 min of being still with the magnet. Starting volumes of beads each received 1 mL 1× HK, then washed in 1 mL 1× HK. The beads were then washed twice with 1 mL Buffer A (0.1 M NaOH and 0.05 M NaCl), then three washes with 1 mL 1× HK buffer. Beads were derivatized to TO1-Biotin by rotating in 1× HK equal to their starting volume containing 8 µM TO1-Biotin for 15 min at room temperature, then washed thrice with 1× HK buffer and resuspended in 5× Buffer B (5× HK containing 5 mM EDTA, 5 mM DTT, 500 µg/mL heparin). This 5× Buffer B-bead mix was then added to each outgrowth time point RNA for 300 ng/µL RNA (length assays); 1000 ng/µL RNA (decapping assay) to acquire 1× Buffer B containing 1× Beads, followed by 15 min of rotation at room temperature to bind 6S RNAM(:pRNA). The beads were washed thrice with 1 mL 1× Buffer B then once with 1× NEBuffer2 equivalent to the starting beads volume. The beads mix was then suspended to 10× with reaction mix containing 10% w/v DNase I and 1× DNase buffer (NEB), mixed, then incubated at 37°C for 30 min to degrade residual DNA before diluted with 1 mL 1× Buffer B as the first post-DNase wash. The beads were washed two more times with 1× Buffer B, then once with 1× reverse transcription (RT) buffer (pH 8.3) (Thermo Fisher). Beads were afterwards resuspended to 10× concentration in 1× RT buffer conditions containing 10 U/µL Maxima RT H- (Thermo Fisher) and 500 µM dTTP, dCTP, and dGTP. Reactions were spiked with α-32P dATP to radiolabel the cpRNA products. The tubes were incubated at 37°C for 30 min to elongate pRNAs into chimeras (Fig. 3B) and subsequently cooled to room temperature for 10 min. Afterwards, the beads were washed five times with 1 mL 1× BB-EDTA, with the last wash matching the bead volume during the RNA-binding step to help collect the beads. The beads were resuspended to 1× in 99% Formamide with 10 mM EDTA then heated at 65°C for 5 min to elute the radiolabeled cpRNAs. The eluted cpRNAs were subsequently purified by ethanol precipitation and/or 10% denaturing PAGE. At least 10% w/v more beads than needed was prepared per pull-down to minimize loss prior to binding RNA. Tubes containing beads, during and after derivatization of TO1-Biotin, were covered by aluminum foil to protect TO1-Biotin from light.
In vivo pRNA length assays
ddNTP Ladder preps
pRNA-adapted DNA oligo 5′-ATC GGC TCA GGG G-3′ α-phosphorylated by PNK (NEB) using γ-32P ATP was PAGE-purified and initially heated at 80°C for 2 min then 50°C for 5 min with synthetic precursor 6S RNAM derived from ssrS Promoter 2. Four reactions containing this mix and one of ddATP; ddTTP; ddCTP; ddGTP were then incubated at 37°C for 30 min in 1× RT buffer with 25 nM radiolabeled 5′-ATC GGC TCA GGG G-3′, 250 nM synthetic 6S RNAM, 16 nM ddNTP, 25 µM dNTP of the ddNTP analog, 50 µM of dTTP, dCTP and dGTP, and 10 U/µL Maxima RT H-. The 10 µL ddNTP ladder reactions were then quenched with 30 µL 1.33× quench solution containing 67% Formamide, 0.067% Bromophenol blue, 0.067% Xylene cyanol, 10.67 mM EDTA, 5 mM HEPES (pH 7.5), and 30 mM KCl, then heated. Volumes were scaled accordingly for more ladders as necessary and radiolabeled 5′-ATC GGC TCA GGG G-3′ was increased to 40 nM after at least one half-life (Fig. 4B).
Hydrolysis of chimeric pRNAs
Based on initial optimization experiments (data not shown), purified chimeric pRNAs were ethanol precipitated and normalized to an RNA concentration of 4.5 ng/µL using a Nanodrop spectrophotometer. The samples were then diluted twofold and heated to 95°C for 15 min in 100 mM KOH to induce RNA hydrolysis. 2× denaturing dye was then added to each sample prior to loading alongside with the ddNTP ladders described earlier for 10% denaturing PAGE using 1× Tris/Borate/EDTA (TBE) buffer (Fig. 4C).
Preparation of amplicon templates encoding synthetic 6S RNAM
Testing of pRNA species initiated by ATP and NAD(H) in APB conditions utilized synthetic 6S RNA. Template encoding the 6S RNA was first assembled by the annealing and extension of two oligos (from NCBI Accession NC_000913, Region: 3055983…3056165 followed by the addition of a T7 promoter): 5′-CTC CGC GGT TGG TGA GCA TGC TCG GTC CGT CCG AGA AGC CTT AAA ACT GCG ACG ACAC ATT CAC CTT GAA CCA AGG GTT CAA GGG TTA CA and CGA GCA TGC TCA CCA ACC GCG GAG CGC CAC ATT CTT GTG GTA TGA AAT ATC GGC TCA GGG GAC TGG CCC GCT TGC GAA CAT CTC AGA GAA-3′. The final construct was generated by PCR using primers 5′-ttc taa tac gac tca cta taG GAT TTC TCT GAG ATG TTC GCA AGC-3′ and 5′-GGA ATC TCC GAG ATG CCG CCG CAG GCT GTA ACC CTT GAA CCC TTG GT-3′ (Underlined primer regions correspond to complementarity between both primer sets, T7 promoter is in lower case). PCR was performed using 10 mM Tris at pH 8.3, 50 mM KCl, 1.5 mM MgCl2, 0.1% gelatin, 200 µM each dNTP, and 2.5 U/100 mL Taq polymerase, with each primer held at 0.5 µM. Ethanol precipitated amplicons encoding 6S RNAM for downstream analyses were generated from MIII ssrS total nucleic acid and colonies for T7 transcription in vitro using Q5 PCR (NEB), with the following primer pairs at 0.5 µM: 5′-TAA TAC GAC TCA CTA TAG GAC AAA ATT TCT CTG AGA TGT TCG CAA GCG-3′ and 5′-GTG CCA GAT AAG AAG GGA ATC TCC G-3′ to generate 6S RNAM template for pRNA processing and native 6S RNA binding-and-release assays; and 5′-TAA TAC GAC TCA CTA TAG GAC TGA ACA GTT GGT CTT CAT TGC CG-3′ and again 5′-GTG CCA GAT AAG AAG GGA ATC TCC G-3′ to generate synthetic precursor phase 6S RNAM for ddNTP ladders. For 6S RNAM constructs varying at N45, amplicon templates were generated by two PCR rounds. The first round utilized inner PCR primer pairs with each of the forward primers 5′-GGG CCA GTC CCC TGA GCC GAT ATT TCA TAC C-3′ (wild-type A45), 5′-GGG CCA GTC CCC TGA GCC GAT TTT TCA TAC C-3′ (A45T), 5′-GGG CCA GTC CCC TGA GCC GAT CTT TCA TAC C-3′ (A45C), and 5′-GGG CCA GTC CCC TGA GCC GAT GTT TCA TAC C-3′ (A45G) paired with reverse primer 5′-GGC TGT AAC CCT TGA ACC CTT GGT TCA AGG-3′. The second round utilized outer forward primer 5′-TAA TAC GAC TCA CTA TAG CAA AAT TTC TCT GAG ATG TTC GCA AGC GGG CCA GTC CCC-3′ and reverse primer 5′-GAA GGG AAT CTC CGA GAT GCC GCC GCA GGC TGT AAC CCT TGA ACC C-3′ on diluted first round products as PCR template optimized by PCR cycling to generate transcription template for transcribing N45 6S RNAM variants. Amplicons encoding for each of the N45 variants were verified by Sanger Sequencing (Eurofins) using DNA primers 5′-TAA TAC GAC TCA CTA TAG CAA AA-3′ and 5′-GAA GGG AAT CTC CGA GAT G-3′.
32P (Mango III-tagged) 6S RNA binding and release assays
In vitro transcription of synthetic 6S RNAM
PCR amplicons encoding synthetic 6S RNAM products were ethanol precipitated and resuspended with ddH2O to 10X DNA concentration for transcription input, whereas PCR amplicons encoding N45 6S RNAM variants were purified using the QIAquick PCR purification kit (Qiagen). The transcription reactions contained 5 mM DTT, 6 mM MgCl2, 40 mM Tris-HCl (pH 7.5), 10 mM NaCl, 2 mM spermidine, 16% w/v T7 RNA polymerase (abm), and the following (NTPs) at 8 mM GTP, 5 mM CTP, 5 mM ATP, and 2 mM UTP. The reactions were then incubated at 37°C for 2 h. Reactions were spiked with α-32P UTP (PerkinElmer) when synthesizing 32P body-labeled constructs. Post-transcription, RNA was purified via 5% denaturing PAGE, ethanol-precipitated, and resuspended in ddH2O prior to use.
Native binding and release of 32P labeled 6S RNA with ATP, NAD+, NADH, and FAD
6S RNA binding and release procedures were adapted from Panchapakesan and Unrau (2012). 32P body-labeled, PAGE-purified synthetic 6S RNAM at 16 nM was initially heated at 80°C for 2 min and 50°C for 5 min. The heated 6S RNAM was then diluted to 10 nM and incubated with 40% w/v RNAP holoenzyme (NEB) for 20 min at 37°C in 1× HK buffer containing 1 mM DTT, 100 µg/mL heparin (Sigma), and 0.2 mg/mL BSA (NEB) to generate “Bound” 6S RNAM (complexed to RNAP holoenzyme). “Free” 6S RNAM was prepared likewise but without holoenzyme. 6S RNAM release was triggered by preparing each 6S RNAM-containing tube to have 150 µM CTP, GTP, and UTP, and 3.6 mM MgCl2. Each of ATP, NAD+, NADH, and FAD was added separately as an IN into two sets of samples. One set of samples contained each IN at 150 µM, and the other set contained each IN at 1000 µM. Furthermore, no IN was present for both “Free” and “Bound” negative control samples. “Free,” “Bound,” and samples containing an IN were then incubated for 32 min at 37°C to induce release. The release reactions were quenched with 2× native gel loading solution (50% glycerol, 40 mM HEPES [pH 7.5], 120 mM KCl, 10 mM EDTA) and samples were loaded onto a 5% native polyacrylamide gel with 5% glycerol for gel electrophoresis in 1× TBE buffer at 4°C. The native gel was exposed overnight to a Phosphoimager plate at −20°C then imaged at 25 µm using a GE Typhoon Phosphoimager (Fig. 5).
32P pRNA synthesis and processing assays using CIP, RppH, and NudC
Dephosphorylating Mango 6S RNAM
An amount of 1 µM PAGE-purified synthetic 6S RNAM was treated with 2 U/µL Quick CIP (NEB) at 20 µL in 1× NEBuffer r3.1, then ethanol precipitated and resuspended to 420 nM concentration in ddH2O.
Synthesis of pRNAs
5′-Dephosphorylated 6S RNAM was heated at 80°C for 2 min and 50°C for 5 min at 100 nM, then incubated with 20% w/v RNA polymerase holoenzyme for 20 min at 37°C in 1× HK buffer, 1 mM DTT, 200 µg/mL heparin, and 0.2 mg/mL BSA. Synthesis of pRNA was induced by addition of CTP, GTP, and UTP each to 150 µM, and one of the initiators to 1 mM: ATP, NAD, NADH, or FAD, with MgCl2 at 4.5 mM. γ-32P ATP/α-32P UTP was included during release for pRNA radiolabeling. ATP was added to 150 µM when γ-32P ATP was included. Each reaction was afterwards quenched with 2X HK containing 12 mM EDTA. The initial, Supplemental pRNA species test using 6S RNA without the Mango III tag was prepared likewise but at 100 nM during the binding step with 30 min of incubation at 37°C, without BSA.
Mango purification of synthetic pRNAs
This was adapted from the previous Mango purification that isolated biological cpRNAs. An amount of 1 mL 1× HK containing 0.05% Tween-20 was added to 70 µL of streptavidin magnetic beads, resuspended, then placed on the magnet for 1 min. Afterwards, the supernatant was removed. An amount of 1 mL 1× HK containing 0.05% Tween-20 was once again added for an additional wash, with the tube rotating for 5 min on the rotator at room temperature. This was followed with two Buffer A washes then three 1 mL 1× HK buffer washes as described earlier. Beads were derivatized to TO1-Biotin as in the previous protocol. Each quenched pRNA reaction at 6 µL was then increased to 11 µL with Buffer B at 1× (assuming the quenched pRNA buffer, salt and EDTA concentrations are constant), then added to 10 µL of dry beads. The beads rotated for 30 min to bind the 6S RNAM:pRNA complexes at room temperature, and were washed thrice with 1× Buffer B. Beads were then resuspended in 20 µL displacer solution containing 80% Formamide, 2 µM (c)pRNA displacer oligonucleotide 5′-GTA TGA AAT ATC GGC TCA GGG GAC TGG CCC GCT TGC GAA CAT CTC AGA GAA ATT TTG TCC-3′ containing a C3 spacer, 15 mM HEPES (pH 7.5), and heated at 65°C for 5 min. The tubes were then cooled for 5 min to room temperature. Eluates were subsequently ethanol precipitated into pellets with 40 µg glycogen and resuspended in 6.5 µL ddH2O containing 2 µM pRNA displacer to help displace any remaining pRNA.
Processing of Mango-purified, ethanol precipitated pRNAs
Purified pRNAs were processed with 25% w/v Quick CIP (NEB); RppH (NEB); NudC (NEB) in 1× NEBuffer 2; r3.1 (with 5 mM DTT for NudC) reaction conditions as recommended by NEB, at 9 µL, and incubated at 37°C for 30 min. The reactions were then quenched with 10 µL 2× denaturing dye and heated at 65°C for 5 min, then diagnosed using 23% denaturing sequencing PAGE with 0.25% APB (Fig. 6).
32P pRNA synthesis competition assays using synthetic 6S RNAM mutants
Competitive synthesis of pRNA (NAD+ and ATP)
6S RNAM templates varying at A45N were heated and bound to RNAP holoenzyme as described earlier, at 200 nM. pRNA synthesis reactions with A45N 6S RNAM diluted to 100 nM were initiated with CTP, GTP, and UTP at 150 µM, and MgCl2 at 4.5 mM. Relative to ATP-only and NAD+-only IN controls in which ATP and NAD+ are each at 1 mM, NAD+ was held constant at 1 mM with ATP concentrations of 1;10;100 µM. Tubes were incubated at 37°C for 32 min to induce pRNA synthesis with α-32P UTP for radiolabeling. Reactions were quenched with 2× denaturing dye and heated at 65°C for 5 min, prior to analysis using 23% denaturing PAGE containing 0.25% APB (Fig. 7).
Quantification of pRNA bands
ImageQuant TL was used to quantify the dominant band intensities of the shifted NAD+-pRNA bands relative to the unshifted pRNAs in a 23% denaturing 0.25% APB gel. Background subtraction was done using the Rolling Ball algorithm. The NAD+-initiated pRNA band was normalized to the unshifted pRNA bands. The proportion of shifted NAD+-initiated pRNA for each [ATP]:[NAD+] ratio was then used to estimate the ratio at which the amount of NAD+ capping would be 50%.
In vivo chimeric pRNA 5′ processing, adapter ligations, and APB diagnosis
RppH treatment
Mango-purified, PAGE-purified in vivo outgrowth cpRNAs radiolabeled by α-32P dATP as shown earlier (Fig. 3) were normalized by specific activity, then incubated in 1× NEBuffer 2 (NEB) with 0.5 U/µL RppH (10% w/v) for 30 min at 37°C. One aliquot was prepared to have 0.5 U/µL RppH (10% w/v), relative to a RppH-free control. Reactions (Fig. 8A) were incubated at 37°C for 30 min then ethanol precipitated with 20 µg glycogen. Pellets were then incubated at 65°C for 5 min to deactivate the enzyme.
NudC treatment
Purified in vivo outgrowth cpRNAs as above were incubated in 1× NEBuffer r3.1 (NEB) with 1 U/µL Quick CIP (20% w/v) for 10 min at 37°C at 10 µL, then quenched with 125 nmol EDTA (pH 8.0) to chelate 100 nmol MgCl2 and heated at 80°C for 2 min to deactivate Quick CIP. DTT and MgCl2 were then added to 5 mM and 10 mM, respectively, and split into two aliquots. One aliquot was prepared to have 1 µM NudC (10% w/v), relative to the other prepared as a NudC-free control. Reactions (Fig. 8B) were incubated at 37°C for 30 min then ethanol precipitated with 20 µg glycogen. Pellets were then heated at 65°C for 5 min to deactivate the enzyme.
Adapter ligations
Heated in vivo cpRNAs processed above were incubated overnight at 16°C in 1× T4 RNA Ligase Buffer (NEB) containing 2 µM 5′-GUU CAG AGU UCU ACA GUC CGA CGA UC-3′ adapter oligo (Vvedenskaya et al. 2018), 1.5 mM ATP, 250 nM 5′-ATT TCT CTG AGA TGT TCG CAA GCG-3′ ligation blocker, and 1 U/µL T4 RNA Ligase I. Samples were quenched with 2× denaturing dye to 6 mM EDTA then heated at 65°C for 5 min and resolved via 10% denaturing PAGE. A Phosphoimager plate was exposed to gel overnight at −20°C then imaged at 25 µm using the GE Phosphoimager (Fig. 8A,B).
Quantification of cpRNA bands
ImageQuant TL was used to quantify the observed adapter-cpRNA and cpRNA band intensities. Background subtraction was done using the Rolling Ball algorithm. The adapter ligation efficiency in percentage was calculated per lane by dividing the adapter-cpRNA band by the sum of both it and the cpRNA band, then multiplying by 100. The ΔAdapter-cpRNA percentage was calculated by the difference within each −;+ pair of RppH and NudC (Fig. 8C,D).
Diagnosis of boronated-purified capped cpRNA
Additional Mango-purified, PAGE-purified 1536 min outgrowth cpRNA prep was APB-purified via 10% denaturing PAGE containing 0.8% APB, then processed with Quick CIP and NudC as described earlier. NudC− and NudC+ reactions were quenched then incubated at 65°C for 5 min and resolved in a 10% denaturing sequencing gel containing 0.8% APB (Fig. 8E).
Quantification of capped cpRNA sensitivity to NudC
ImageQuant TL was used to quantify the cpRNA band intensities and percentages (Fig. 8E). Background subtraction was done using a manual baseline algorithm. The cap-cpRNA percentage was calculated respectively for the NudC−;+ lane by dividing the cap-cpRNA band intensity by the sum of both it and that of the uncapped cpRNA band, then multiplying by 100. The NudC-sensitive percentage in the APB procedure was calculated by subtracting the remaining cap-cpRNA band percentage due to NudC treatment from the untreated cap-cpRNA band percentage.
SUPPLEMENTAL MATERIAL
Supplemental material is available for this article.
ACKNOWLEDGMENTS
We would like to thank Dr. Dipankar Sen, Dr. Timothy Audas, and members of the Unrau laboratory from the Department of Molecular Biology and Biochemistry at Simon Fraser University for critical feedback of the manuscript. We appreciate the National Science and Engineering Research Council of Canada for an operating grant to P.J.U. and a Canada Graduate Scholarship–Master's Fellowship to C.D.B.
Footnotes
-
Article is online at http://www.rnajournal.org/cgi/doi/10.1261/rna.079356.122.
- Received July 13, 2022.
- Accepted September 21, 2022.
This article is distributed exclusively by the RNA Society for the first 12 months after the full-issue publication date (see http://rnajournal.cshlp.org/site/misc/terms.xhtml). After 12 months, it is available under a Creative Commons License (Attribution-NonCommercial 4.0 International), as described at http://creativecommons.org/licenses/by-nc/4.0/.
REFERENCES
MEET THE FIRST AUTHOR

Meet the First Author(s) is a new editorial feature within RNA, in which the first author(s) of research-based papers in each issue have the opportunity to introduce themselves and their work to readers of RNA and the RNA research community. Christopher Bonar is the first author of this paper, “E. coli 6S RNA complexed to RNA polymerase maintains product RNA synthesis at low cellular ATP levels by initiation with noncanonical initiator nucleotides.” Chris is a biochemist who recently finished his Master's degree studying bacterial regulatory RNAs under Dr. Peter J. Unrau's supervision from the department of Molecular Biology and Biochemistry at Simon Fraser University.
What are the major results described in your paper and how do they impact this branch of the field?
The E. coli 6S RNA binds to RNA polymerase to suppress σ70-dependent housekeeping gene expression in low nutrient conditions. It has been hypothesized that the rate of the 6S RNA release process depends on cellular ATP levels. We have discovered that this release process occurs slowly when ATP levels are low, via noncanonical initiator nucleotides such as NAD(H). Our results further characterize the bacterial 6S RNA as a likely bacteriostatic target and the importance of NAD–pRNAs in controlling cellular metabolism.
What led you to study RNA or this aspect of RNA science?
The idea of unraveling new metabolic pathways after engineering my Mango III bacterial strain. At the time, I was just hoping to get into a lab, and Peter gave me a chance. Characterizing the growing field of NAD-RNAs and metabolic pathways occurred to me after engineering that strain. These RNAs are part of an exciting metabolic network that continues to grow in popularity and importance!
What are some of the landmark moments that provoked your interest in science or your development as a scientist?
My first ever international conference talk was at the 2019 RiboClub conference, where I presented my Mango III bacterial strain to Nobel Laureates and other prestigious scientists. After my session was over, Dr. Victor Ambros came over and shook my hand. I also met Dr. Andrew Fire the next day. Along with continued talks with Peter, I learned that science requires not only creativity but also hard work and self-responsibility.
If you were able to give one piece of advice to your younger self, what would that be?
Always keep your head up and have a positive attitude. You will have ups and downs in science. Do not feel demoralized when experiments fail; do not feel overconfident when experiments succeed. Always question everything, have an open mind, and keep learning. Work hard and smart!




