


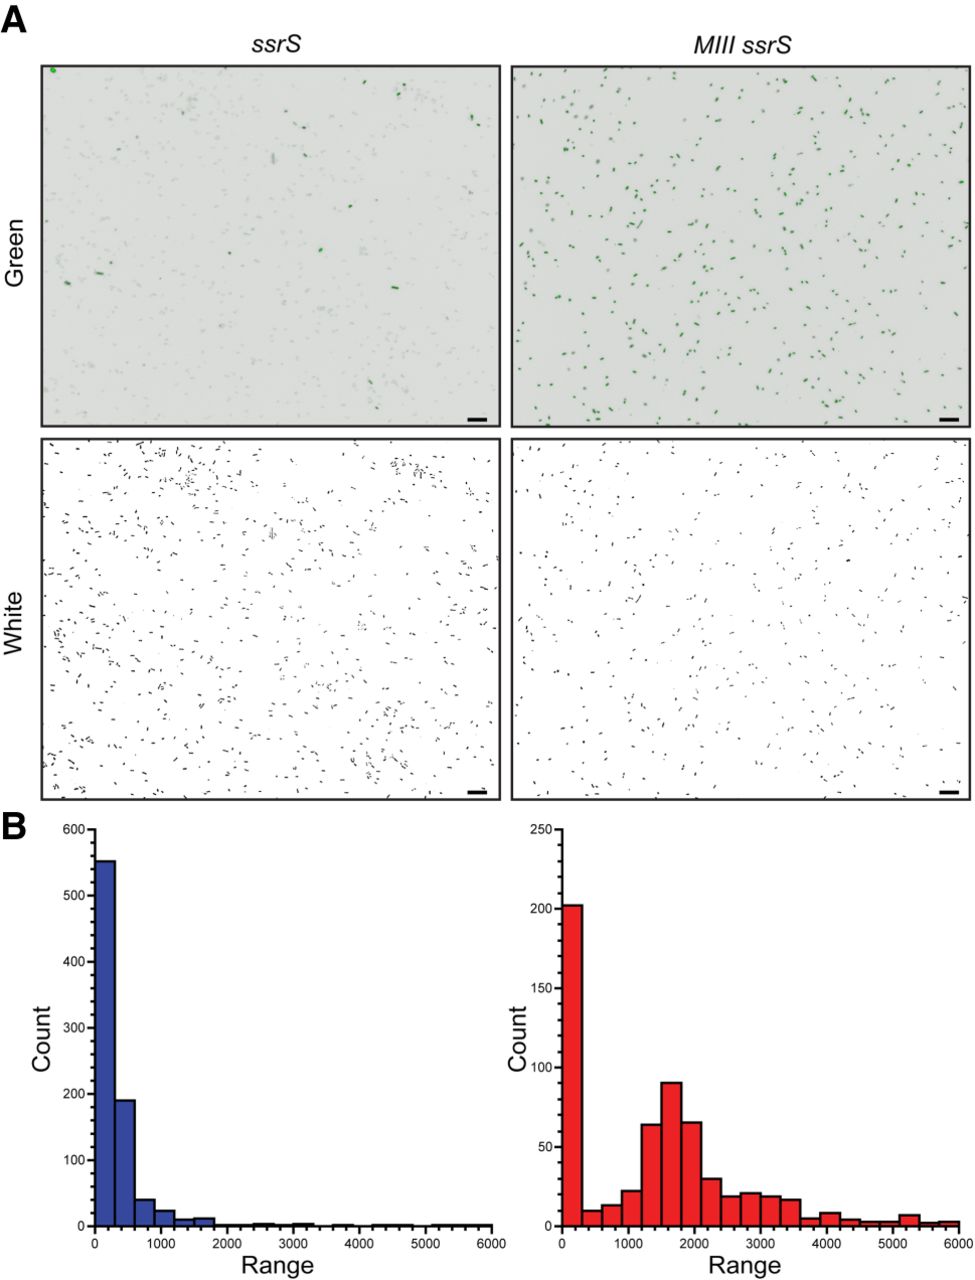
E. coli cells encoding RNA Mango III-tagged 6S RNA accumulate fluorescence during stationary phase. Cells grown overnight in media containing 20 µM TO1-Biotin were imaged at 40× magnification using an EVOS FL Auto 2 microscope. (A) Wild-type (ssrS) and CRISPR-modified (MIII ssrS) cells. Fluorescing cells from staining in TO1-Biotin were identified using the green channel (482 nm excitation and 524 nm emission) (top panels). Cell locations were identified using white light imaging (bottom panels). Scale bar in each panel is 10 µm. (B) Bar graphs quantifying the observed accumulation of green fluorescence in stationary phase cells. Blue refers to the ssrS strain (n = 848), and red refers to the MIII ssrS strain (n = 609). The raw integrated density for each cell was scored using ImageJ. “Range” refers to a set of raw integrated intensities, and “Count” refers to the number of cells quantified for each raw integrated intensity. Histograms were generated using KaleidaGraph.




