


Alternative RISC assembly: Binding and repression of microRNA–mRNA duplexes by human Ago proteins
- Maja M. Janas1,2,3,7,
- Bingbing Wang1,2,3,8,
- Abigail S. Harris4,
- Mike Aguiar5,
- Jonathan M. Shaffer4,
- Yerramilli V.B.K. Subrahmanyam4,
- Mark A. Behlke6,
- Kai W. Wucherpfennig1,
- Steven P. Gygi5,
- Etienne Gagnon1,9,10 and
- Carl D. Novina1,2,3,10
- 1Department of Cancer Immunology and AIDS, Dana-Farber Cancer Institute, Harvard Medical School, Boston, Massachusetts 02115, USA
- 2Department of Microbiology and Immunobiology, Harvard Medical School, Boston, Massachusetts 02115, USA
- 3Broad Institute of MIT and Harvard, Cambridge, Massachusetts 02141, USA
- 4Qiagen, Inc., Frederick, Maryland 21703, USA
- 5Department of Cell Biology, Harvard Medical School, Boston, Massachusetts 02115, USA
- 6Integrated DNA Technologies, Coralville, Iowa 52241, USA
Abstract
MicroRNAs (miRNAs) are small noncoding RNAs that post-transcriptionally regulate protein output from the majority of human mRNAs. In contrast to the consensus view that all miRNAs are associated with Argonaute (Ago) proteins, we determine that miRNAs are expressed in a 13-fold excess relative to Agos in HeLa cells and that miRNAs are bound to mRNAs in a sevenfold excess relative to Agos, implying the existence of miRNA–mRNA duplexes not stoichiometrically bound by Agos. We show that all four human Agos can repress miRNA–mRNA duplexes, but only Ago2 can cleave small interfering RNA–mRNA duplexes in vitro. We visualize direct Ago binding to miRNA–mRNA duplexes in live cells using fluorescence lifetime imaging microscopy. In contrast to the consensus view that Agos bind miRNA duplexes, these data demonstrate that Agos can bind and repress miRNA–mRNA duplexes and support a model of catalytic Ago function in translational repression.
Keywords
INTRODUCTION
Members of the evolutionarily conserved Ago family of proteins bind small noncoding guide RNAs to mediate sequence-specific repression of genes essential for the regulation of diverse biological processes (for reviews, see Hutvagner and Simard 2008; Schirle and MacRae 2012). The canonical model of RNA-induced silencing complex (RISC) loading indicates that Argonautes (Agos) first bind to endogenous microRNA (miRNA) or exogenous small interfering RNA (siRNA) duplexes, passenger strands are then discarded, and guide strands are incorporated into Agos, and finally, mature RISC is guided to complementary target mRNAs. When the guide strands bind with imperfect complementarity to target mRNAs, the result is usually reduced translation and/or stability of target mRNAs (for review, see Filipowicz et al. 2008). When the guide strands bind with perfect complementarity to the target mRNA, RISC endonucleolytically cleaves the target mRNA (Liu et al. 2004; Meister et al. 2004).
Structural studies of archeal (Song et al. 2004; Rivas et al. 2005), eubacterial (Yuan et al. 2005; Wang et al. 2008b,c, 2009b), and human (Elkayam et al. 2012; Schirle and MacRae 2012) Agos have revealed critical insights into the mechanisms of guide strand loading into RISC. Agos are defined by the presence of PAZ (Piwi-Argonaute-Zwille), MID, and PIWI (P-element induced wimpy testis) domains (Bohmert et al. 1998). The N-terminal PAZ domain has an oligonucleotide/oligosaccharide-binding (OB) fold and binds the 3′ hydroxylated end of a guide strand, while the MID domain anchors the 5′ monophosphorylated end. The remaining interactions between Ago and the loaded guide strand are mediated by the sugar-phosphate backbone of the guide strand such that bases 2–8 of the small RNA (the seed region) are solvent-exposed and primed for binding to the target mRNA, which itself does not interact with Ago (Song et al. 2004). These structural data imply a specific molecular architecture necessary for loading mature miRNAs into RISC and also imply a tight association between Agos and miRNAs for the lifetime of the mature miRNA (Elkayam et al. 2012).
Several observations suggest that the association between miRNAs and Agos may be flexible and not constrained by the molecular architecture of miRNA and siRNA duplexes. In contrast to the canonical model of RISC loading, Agos can form active RISC using single-stranded RNAs or DNAs ranging from 9–36 nucleotides (nt) (Wang et al. 2008b), precursor miRNAs (pre-miRNAs) (Tan et al. 2009), and long unstructured single-stranded RNAs (Tan et al. 2009), suggesting flexibility in length and structure of oligonucleotides that can bind to Agos. Additionally, we (Wang et al. 2006, 2007, 2008a, 2009a) and others (Ricci et al. 2011) have functionally shown that preannealed miRNA–mRNA duplexes can bind Agos and are translationally repressed in vitro.
miRNAs are thought to be stabilized by their tight association with Ago proteins (Grishok et al. 2001; Vaucheret et al. 2004; Diederichs and Haber 2007; O'Carroll et al. 2007), which implies that all miRNAs are bound by Ago proteins. In contrast to this expectation, several observations indicate that Agos are limiting relative to miRNAs in several organisms. First, Agos are limiting for gene silencing in Arabidopsis (Martinez de Alba et al. 2011) as well as Xenopus laevis oocytes and early embryos (Lund et al. 2011). Second, exogenous addition of miRNA or siRNA duplexes into human cells leads to up-regulation of endogenous miRNA targets (Sood et al. 2006; Khan et al. 2009), suggesting that miRNAs compete for Ago binding. Third, Ago overexpression leads to accumulation of mature miRNAs (Diederichs and Haber 2007), and Ago depletion leads to reduction in mature miRNA levels (Grishok et al. 2001; O'Carroll et al. 2007). Thus Agos are likely limiting relative to small RNAs across phyla.
Here we demonstrate binding and repression of preannealed miRNA–mRNA duplexes by Agos in cells and show that Ago2 can cleave preannealed siRNA–mRNA duplexes in vitro. We develop a fluorescence lifetime imaging microscopy (FLIM) method to measure fluorescence resonance energy transfer (FRET) between a protein (Ago) and a miRNA–mRNA duplex in live cells. Because Agos can bind preannealed miRNA–mRNA duplexes, RISC activity may not be limited by equimolar ratios between Agos and miRNAs. This catalytic model of miRNA-mediated repression is consistent with our absolute quantitation of Agos and miRNAs, which demonstrated a 13-fold excess of miRNA molecules relative to Ago1–4 molecules in a HeLa cell and a sevenfold excess of miRNA molecules relative to Ago1–4 molecules bound to mRNAs. Our data suggest enzymatic properties of Agos in miRNA-mediated translational repression, similar to the enzymatic properties of Ago2 in target mRNA cleavage.
RESULTS
Ago-free miRNAs are stable
Mature miRNAs are stabilized by binding to Agos (Grishok et al. 2001; Sood et al. 2006; Diederichs and Haber 2007; O'Carroll et al. 2007; Khan et al. 2009), and it is unlikely that unbound mature miRNAs exist free-floating in the cell. Consistent with these observations, the canonical model of RISC assembly assumes that miRNAs remain functionally associated with Agos throughout RISC loading and target mRNA repression processes, implying equimolar ratios between mature miRNAs and Ago1–4 proteins. However, the absolute ratios of mature miRNAs to Agos have never been determined for any cell type.
To quantitate miRNA copy numbers per HeLa cell, we first determined that a HeLa cell contains 35 pg of total RNA by measuring total RNA extracted from known numbers of HeLa cells (Supplemental Fig. S1A). We then spiked a known amount of total RNA with a pool containing equal copy numbers of three synthetic miRNAs that are not expressed in human cells (cel-miR-39, cel-miR-54, and artificial CXCR4 miRNA) (Fig. 1A). We performed reverse transcription using the miScript PCR system specific for mature miRNAs, followed by the Human miRNome miScript miRNA PCR Array. The Ct values directly corresponded to spiked miRNA copy numbers regardless of the identity of the miRNA or the primer sets used for amplification. This allowed unbiased, direct conversion of Ct values for endogenous miRNAs into copy numbers based a standard curve generated by the spiked controls (Fig. 1B). We detected a total of 669 different miRNA species and determined the total number of miRNA molecules per HeLa cell to be 202,765 (Fig. 1C; Supplemental Table S1). For the majority of detected miRNAs, we did not detect a significant correlation between our absolute miRNA copy numbers per cell and previously reported miRNA deep sequencing reads (Shin et al. 2010) after normalization of both data sets to the most abundant miRNA, miR-21. However, the top 100 most-abundant miRNAs detected by both methods had a correlation coefficient of 0.8334, while the top 50 most-abundant miRNAs detected by both methods had a correlation coefficient of 0.9347 (Supplemental Fig. S1B). These correlations suggest that deep sequencing can identify previously unknown miRNAs in a qualitative manner, while RT-qPCR can determine absolute copy numbers of high- and low-abundance miRNAs in a quantitative manner.
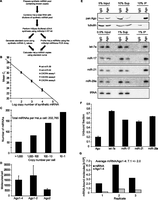
Absolute copy number quantitation and Ago binding of HeLa miRNAs. (A) Workflow used to determine absolute miRNA copy numbers per HeLa cell. A pool containing equal copies of three synthetic miRNAs (cel-miR-39, cel-miR-54, and CXCR4 miRNA) was prepared. Next, three experimental samples were prepared, each with a fixed amount of total RNA isolated from HeLa cells and an increasing copy numbers of the synthetic miRNA pool (either 5.2 × 10⁶, 5.2 × 10⁵, or 5.2 × 10⁴ copies per synthetic miRNA). cDNA samples were diluted to 1 ng/μL HeLa cDNA and either 1 × 10⁴ copies/μL, 1 × 10³ copies/μL, or 1 × 10² copies/μL of each synthetic miRNA and used as templates in real-time PCR. The resulting Ct values for the synthetic miRNAs were used to generate a standard curve to calculate endogenous miRNA copy number. For profiling of endogenous miRNAs expressed in HeLa cells, the remaining diluted cDNA samples were combined and used as a template in real-time PCR with the Human miRNome miScript miRNA PCR Array. The full experiment, from cDNA synthesis to real-time PCR, was performed in triplicate. The copy number for each miRNA expressed in HeLa cells was individually calculated using the mean Ct values for the endogenous miRNA and the experimentally determined amount of total RNA (35 pg) found in a single HeLa cell (Supplemental Fig. S1A). (B) miScript Ct values directly correspond to miRNA copy numbers independently of primer set sequences. The Ct values obtained from the real-time PCR assays targeting the synthetic miRNAs were plotted against the copy number of the synthetic miRNAs present in the real-time PCR reaction. The equation generated from the averaged synthetic Ct values was y = −3.4386x + 37.011 with R2 = 1. (C) Distribution of miRNA copy numbers for HeLa cells. Absolute copy numbers were binned and charted, demonstrating the range of miRNA expression in HeLa cells. A total of 669 different miRNA species were detected, and the total number of miRNA molecules per HeLa cell was determined to be 202,765. (D) Absolute quantitation of Ago molecules per HeLa cell using tandem mass spectrometry and synthetic isotope-labeled Ago peptides as internal standards that mimic native peptides formed by proteolysis. Known numbers of HeLa cells were lysed, and separated on a Coomassie gel. Proteins were extracted from the 85–110 kDa gel fragment containing Agos, spiked with synthetic Ago peptides (covering Agos1–4, Ago1–2, and specific to Ago2) and analyzed on a Thermo Orbitrap XL2 LCMS. Integrated peak areas around heavy (spiked Ago peptides) and light (endogenous Ago peptides) peaks were used for quantitation. (E) A large fraction of miRNAs exist in an Ago-free form in cells. Ago1–4 were depleted with the anti-pan Ago antibody, and the indicated fractions of inputs, supernatants, and precipitates either were Western blotted for Ago1–4 (with the anti-pan Ago) and normalized to tubulin or were Northern blotted for four abundant HeLa miRNAs (let-7a, miR-17, miR-21, and miR-29a) and normalized to tRNA. (F) Quantitation of the fraction of Ago1–4 and miRNAs left in the unbound supernatant fraction after anti-pan Ago IPs showed in E. Whereas 80% of Ago1–4 was depleted, only as much as 50% of a given miRNA species was codepleted, indicating that at least 30% of a given miRNA population is Ago-free. (G) mRNAs are associated with a sevenfold excess miRNA molecules relative to Ago1–4 molecules. Polyadenylated HeLa mRNAs were pulled down with oligo(dT) dynabeads, and absolute numbers of miRNA and Ago1–4 molecules were quantified as in C and D, respectively. To control for nonspecific binding, parallel pulldowns were performed with Streptavidin dynabeads. Bar graphs, mean ± SD from three independent experiments.
To determine the number of Ago1–4 molecules per HeLa cell, we used the AQUA strategy for absolute protein quantitation by tandem mass spectrometry (Gerber et al. 2003). Ago1 and Ago4 are expressed as single isoforms, while Ago2 and Ago3 each have two isoforms. We spiked the trypsin digest of a gel fragment containing Agos (85–110 kDa) with known amounts of the following synthetic stable-isotope–labeled (heavy) peptides as internal standards: YTPVGR covering all Agos, AVQVHQDTLR covering Ago1 and the two Ago2 isoforms, and DHQALAK covering specifically the two Ago2 isoforms. Based on the integrated peak areas around the m/z of each light (endogenous Ago) and heavy (spiked control) peptide, we determined that there are approximately 15,000 Ago1–4 molecules per HeLa cell based on the YTPVGR peptide standard (Fig. 1D). This result is nearly identical to recently published Ago1–4 quantitation (14,000–17,000 molecules) in mouse melanocytes and human melanoma cells (Wang et al. 2012). Virtually the entire Ago population in a HeLa cell consists of Ago1 and Ago2 based on the AVQVHQDTLR peptide standard, with ∼40% representing Ago2 based on the DHQALAK peptide standard (Fig. 1D).
Together, these absolute quantitations of miRNAs and Ago1–4 on a per cell basis demonstrate that there is about a 13-fold excess of miRNA molecules (about 202,000) relative to Ago 1–4 molecules (about 15,000) in a HeLa cell. Thus, Ago1–4 are expressed at substoichiometric amounts relative to miRNAs. To show that not all miRNA molecules are bound by Agos, we depleted Ago1–4 from HeLa lysates using anti-pan Ago antibody (Nelson et al. 2007) and quantitatively probed the unbound supernatant fractions for Ago1–4 and miRNAs (Fig. 1E). Whereas 80% of Ago1–4 was depleted, at most 50% of the four abundant miRNAs (miR-21, miR-17, miR-29a, and let-7a) were codepleted (Fig. 1F), suggesting that at least 30% of these miRNAs are not bound to Ago1–4. These data imply that a large fraction of miRNAs is Ago-free, yet stable.
We hypothesized that Ago-free miRNAs may be protected from degradation by binding to target mRNAs. To determine whether endogenous Ago-free miRNA–mRNA duplexes exist in a cell, we pulled down polyadenylated mRNAs using oligo(dT) beads under nondenaturing conditions and determined absolute copy numbers of copurifying miRNA and Ago1–4 molecules as above (Fig. 1G; Supplemental Table S2). We identified a sevenfold excess of miRNAs relative to Ago1–4 bound to mRNAs, consistent with excess miRNAs relative to Ago1–4 in a cell. These data indicate that preformed miRNA–mRNA duplexes exist endogenously and may be noncanonical substrates for Ago-mediated repression.
Agos bind miRNA–mRNA duplexes in cells
Two independent lines of evidence suggested a mechanism of miRNA persistence that is dependent on target mRNAs. First, miRNA-targeted mRNAs can stabilize miRNAs in cells (Song et al. 2003; Chatterjee and Grosshans 2009). Second, Agos can bind and repress preannealed miRNA–mRNA duplexes in vitro (Wang et al. 2006, 2007, 2008a, 2009a; Ricci et al. 2011). To test whether Agos can be recruited to preannealed miRNA–mRNA duplexes in cells, we transfected Hemagglutinin-tagged Ago2 (HA-Ago2)–expressing HeLa cells (Supplemental Fig. S2A) with Alexa568-labeled artificial CXCR4 miRNA preannealed to its target mRNA, neither of which is expressed in HeLa cells. To form miRNA–mRNA duplexes, Alexa568-labeled CXCR4 was preannealed to in vitro transcribed, capped, and polyadenylated firefly luciferase mRNA (FL6X) with six imperfectly complementary CXCR4 binding sites in its 3′ UTR (Supplemental Fig. S2C) by heating and cooling prior to transfection. To ensure that every CXCR4 and FL6X molecule was preannealed, FL6X was incubated with substoichiometric amounts of antisense CXCR4 (fourfold molar excess over FL6X) such that four out of six CXCR4 binding sites in FL6X 3′ UTR were occupied on average. We confirmed that this preannealing procedure efficiently produced CXCR4–FL6X duplexes that were stable for least 24 h at 37°C (Supplemental Fig. S2E).
Sixteen hours after CXCR4–FL6X transfection, cells were stained with Alexa488-labeled anti-HA antibody. All punctate HA-Ago2 foci colocalized with Alexa568-labeled CXCR4 preannealed to FL6X (Fig. 2A). However, most fluorescent miRNA–mRNA duplexes were not associated with Ago2 foci at the time of imaging, likely due to artifacts of transfection, excess exogenous miRNA–mRNA duplexes, accumulation in endosomes, or the dynamic nature of Ago2 recruitment of miRNA–mRNA duplexes preventing substantial steady-state colocalization with fluorescent miRNA–mRNA duplexes. Similar to results obtained using HA-Ago2, all punctate HA-Ago1 foci colocalized with preannealed CXCR4–FL6X duplexes (Supplemental Fig. S3A). As expected, CXCR4 also colocalized with all HA-Ago2 and HA-Ago1 foci when FL6X was cotransfected with the double-stranded CXCR4 (Supplemental Fig. S3B). However, no observable CXCR4 colocalized with HA-Ago2 or HA-Ago1 foci when FL6X was cotransfected with single-stranded CXCR4 at equimolar amounts to preannealed CXCR4 (Supplemental Fig. S3E). This control rules out the possibility that preannealed CXCR4 dissociated from FL6X and was first bound by Agos prior to recruitment to FL6X. Together, these data demonstrate that Agos can colocalize with miRNA duplexes and miRNA–mRNA duplexes in cells. Though colocalization is not direct evidence of miRNA–mRNA duplex loading by Agos, these data suggest that Agos can bind mRNAs preannealed to miRNAs in cells.
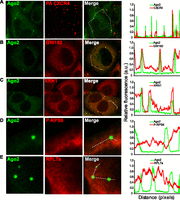
Ago2 colocalizes with preannealed miRNA–mRNA duplexes in P-bodies. (A) Ago2 colocalizes with preannealed CXCR4–FL6X duplexes. HeLa cells were transiently transfected with HA-Ago2, and 24 h later, FL6X preannealed to Alexa568-labeled CXCR4 was transfected. After 16 h, immunostaining with Alexa488-labeled anti-HA antibody and DAPI was performed. (B–E) Ago2- and CXCR4-containing loci are P-bodies. HeLa cells were transfected with HA-Ago2 and immunostained 24 h later with antibodies against endogenous (B) GW182, (C) XRN1, (D) phospho-RPS6 (P-RPS6), and (E) RPL7a, followed by detection with Alexa647-labeled secondary antibodies. Relative fluorescence along the indicated paths was quantified using ImageJ and graphed as a function of distance.
Immunofluorescence analyses of mammalian Agos and target mRNAs have shown a diffuse cytoplasmic distribution and punctate foci colocalizing with P-bodies and stress granules (Jakymiw et al. 2005; Liu et al. 2005a,b; Leung et al. 2006). Overexpressed HA-Ago2 and endogenous Ago2 demonstrated similar accumulation in punctate foci (Supplemental Fig. S2F), as observed previously in P-body colocalization analyses (Jakymiw et al. 2005; Liu et al. 2005a,b; Leung et al. 2006). To characterize the punctate Ago foci colocalizing with CXCR4–FL6X duplexes, we costained HA-Ago2–expressing HeLa cells with the known P-bodies markers GW182 or XRN1 and performed a pixel-by-pixel colocalization analyses (Fig. 2B,C). Our data show that Ago2 foci are P-bodies (Pearson's coefficient factors of 0.70 ± 0.1 for GW182 and 0.69 ± 0.09 for XRN1, n = 15). Similarly, all Ago family members were readily observed in P-bodies with similar Pearson's coefficient factors (Supplemental Fig. S3C,D). P-bodies are macromolecular complexes of proteins and untranslatable mRNAs that exclude essential components of active translation such as ribosomes (Anderson and Kedersha 2009). To verify Ago association with P-bodies, we performed colocalization analyses by costaining the HA-Ago2–expressing HeLa cells with known markers of active translation, phosphorylated small ribosomal protein S6 (P-RPS6) and large ribosomal protein L7a (RPL7a) (Fig. 2D,E). These colocalization analyses confirmed that Ago2 was enriched in a translation-poor subcellular environment as revealed by negative Pearson's coefficient factors for both P-RPS6 and RPL7a (−0.14 ± 0.10 and −0.48 ± 0.15, respectively, n = 15). These data confirm the accumulation of Agos in P-bodies and demonstrate that preannealed miRNA–mRNA duplexes can be recruited to these foci.
Ago2 directly binds to miRNA–mRNA duplexes in cells
To assess direct binding of miRNA–mRNA duplexes to Agos in cells, we developed a FRET-based assay using Alexa568-labeled miRNA as the acceptor fluorophore and Ago2 N-terminally tagged with monomeric eGFP as the donor fluorophore. FRET occurs when two fluorescent components with overlapping spectral properties are within 10 nm of each other. In this assay, the emission spectrum of the donor fluorophore (eGFP-Ago) overlaps with the excitation spectrum of the acceptor fluorophore (Alexa568-miRNA). Steady-state intensity-based FRET can be calculated through either sensitized emission or donor quenching/dequenching (Kenworthy 2001). However, these approaches are not suitable for assays with very large molar differences between donor and acceptor molecules (Morton and Parsons 2011) such as this assay.
One FRET approach that allows the calculation of energy transfer between FRET pairs with large differences in concentration is the measurement of changes in the intrinsic fluorescence lifetime of the donor fluorophore when in proximity to acceptor molecules. This approach measures the fluorescence decay of the donor fluorophore through time-correlated single photon counting (TCSPC) (Morton and Parsons 2011). To determine the binding of preannealed miRNA–mRNA duplexes to Agos, eGFP-Ago2–expressing HeLa cells (Supplemental Fig. S2B) were transfected with fluorescently labeled or unlabeled preannealed CXCR4–FL6X duplexes 16 h prior to imaging. Preannealing was performed by heating and cooling of a 4:1 CXCR4:FL6X mixture, as above (Supplemental Fig. S2E). The N-terminal tagging of Ago2 with eGFP did not alter its subcellular localization, as it was primarily found in P-bodies (Supplemental Fig. S4). Cells showing substantial accumulation of CXCR4–FL6X duplexes in P-bodies were considered for FLIM analysis (Fig. 3A), and fluorescence lifetime was calculated to generate color-coded images and histogram distribution of eGFP lifetime in P-bodies by selecting a region of interest (ROI) encompassing only the P-bodies (Fig. 3B).
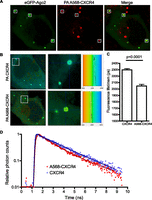
Ago2 directly binds preannealed miRNA–mRNA in live cells. HeLa cells transiently expressing a chimeric human Ago2 with an N-terminal monomeric eGFP protein were transfected with Alexa568-labeled CXCR4 preannealed to the target FL6X and incubated for an additional 16 h before imaging. (A) Confocal image showing colocalization of eGFP-Ago2 and P-body–targeted miRNA–mRNA duplexes (white squares). (B) Color-coded FLIM image of HeLa cells expressing eGFP-Ago2 transfect with nonlabeled (CXCR4) or Alexa568-labeled (568CXCR4) miRNA preannealed to target mRNA. Higher magnification FLIM acquisition shown in inset (center panels) features a red ROI, which was used to generate color-coded FLIM histogram (right panels). (C) Fluorescence lifetimes were measured for 30 cells in each condition, and mean lifetime was displayed as bar graph. A decrease of 11% of fluorescence lifetime was measured only in the presence of labeled miRNA, which indicates the presence of FRET. Differences were statistically significant, with a P-value of less than 0.0001. (D) A single pixel (blue cross) was chosen from the ROI in B in order to generate a fluorescence decay curve to which was fitted the FLIM values for the remainder of the pixel within the image. Displayed are relative photon counts per nanosecond, where the highest density of photons measured was set at the value of 1. Curve fitting was optimized to a χ2 nearest to one (1.00 for CXCR4 and 1.02 for 568CXCR4) using single or double exponential curve fitting algorithms.
FLIM calculations indicate that P-body–targeted Ago2-eGFP has a fluorescence lifetime of 2.3 ± 0.02SEM nsec in the presence of Lipofectamine2000-transfected unlabeled CXCR4–FL6X duplexes (Fig. 3D). This value is similar to previously described fluorescence lifetime for eGFP as an N-terminal tag (Stubbs et al. 2005). Addition of the Alexa568 label to the CXCR4–FL6X duplex caused a decrease in the fluorescence lifetime of eGFP-Ago2 in P-bodies to an average of 2.05 ± 0.02 SEM, indicating the presence of FRET (Fig. 3C). FRET calculations indicate an average energy transfer of 11% (P < 1 ± 10−4). The fluorescence decay calculation of photons acquired and curve fitting for a single pixel is marked by a blue cross-hair (Fig. 3B). Each curve fitting used for FLIM calculations resulted in a χ2 of 1.00 ± 0.02, indicating that calculations were accurate based on the parameters used.
The fluorescence decay of eGFP-Ago2 in the presence of acceptor (red dots and curve in Fig. 3D) is visibly reduced for each time point following initial photon emission (time, >1 nsec). The dual exponential decay aspect of the decay curve calculated from the FRET experiment is also observable, and curve fitting using this method resulted in a decrease of the χ2 value closer to 1. This indicates that two separate species of fluorophores are emitting photons within that pixel, a short-lived fluorophore (with half-life between 1.1 and 1.4 nsec) that is in FRET state, and a long-lived fluorophore (with half-life of 2.3 nsec) that is not in FRET state. This approach indicated an average FRET efficiency of 55% for the eGFP-Ago2 interacting pairs, although the percentage of eGFP molecules in a FRET state varied among P-bodies and ranged from 10%–20%. The apparent FRET value of 11% thus correlates with the amount of fluorescent CXCR4 detected in a P-body and is a combination of the percentage of interacting FRET partners and true FRET value. Together, these data demonstrate that Ago2 directly binds to preannealed miRNA–mRNA duplexes in living cells.
Agos repress miRNA–mRNA duplexes in cells
To independently confirm that Agos can bind and repress mRNAs preannealed to miRNAs, we performed immunoprecipitation (IP) of N-terminally Flag-tagged Agos (Flag-Ago) following transfection of preannealed CXCR4–FL6X duplexes. Preannealing was performed by heating and cooling of a 4:1 CXCR4:FL6X mixture, as above (Supplemental Fig. S2E). Sixteen hours after transfection, we tested FL expression by luciferase assay (Fig. 4A) and Ago binding by anti–Flag-Ago IP (Fig. 4B). As expected, the strongest repression (50%) was observed when FL6X was cotransfected with the fourfold molar excess of double-stranded CXCR4. Importantly, no significant repression was observed when FL6X was cotransfected with a fourfold molar excess of free antisense CXCR4. However, FL6X preannealed to a fourfold molar excess of CXCR4 prior to transfection was repressed by 20%. Together these data demonstrate that FL6X and CXCR4 did not separate prior to Ago loading, which is supported by in vitro assessment of preannealing stability (Supplemental Fig. S2E). Thus preannealed miRNA–mRNA duplexes can be repressed in human cells, although with reduced efficiency relative to the canonical RISC assembly pathway.
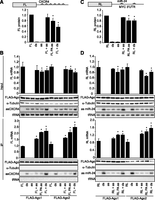
Ago1 and Ago2 bind and repress preannealed miRNA–mRNA duplexes in cells. (A) Preannealed artificial mRNA–miRNA duplexes are repressed in cells. HeLa cells were transfected with in vitro transcribed, capped, and polyadenylated FL mRNA containing six imperfect CXCR4 binding sites in its 3′ UTR (FL6X; top) and with antisense (as), preannealed (PA), or double-stranded (ds) CXCR4. After 16 h, luciferase assays were performed and normalized to untargeted Renilla luciferase control. (B) Ago1 and Ago2 are recruited to FL6X preannealed to CXCR4. HeLa cells were transfected with constructs expressing Flag-Ago1 or Flag-Ago2, and 24 h later, FL6X was transfected along with indicated forms of the CXCR4 miRNA. After 16 h, anti-Flag immunoprecipitation (IP) was performed and verified by Western blotting for Flag and α-tubulin. CXCR4 in the input and IP fractions was detected by Northern blotting and normalized to tRNA, and FL mRNA was detected by RT-qPCR and normalized to GAPDH. (C) Preannealed endogenous target mRNA–miRNA duplexes are repressed in cells. A549 cells were transfected with in vitro transcribed, capped, and polyadenylated Renilla (RL) mRNA containing MYC 3′ UTR with two imperfect miR-24 binding sites in its 3′ UTR (RL-MYC 3′ UTR; top) and with antisense (as), preannealed (PA), or double-stranded (ds) miR-24. After 16 h, luciferase assays were performed and normalized to untargeted Renilla luciferase control. (D) Ago1 and Ago2 are recruited to RL-MYC 3′ UTR preannealed to miR-24. A549 cells were transfected with constructs expressing Flag-Ago1 or Flag-Ago2, and 24 h later, RL-MYC 3′ UTR mRNA was transfected along with indicated forms of miR-24. After 16 h, anti-Flag G IP was performed and verified by Western blotting for Flag and α-tubulin. MiR-24 in the input and IP fractions was detected by Northern blotting and normalized to tRNA, and RL mRNA was detected by RT-qPCR and normalized to GAPDH. Bar graphs, mean ± SD from three independent experiments. (*) P < 0.05; Student's t-test.
To assess recruitment of Agos to preannealed CXCR4–FL6X duplexes, CXCR4 and FL6X were transfected into HeLa cells transiently expressing Flag-Ago1 or Flag-Ago2, and anti–Flag-Ago IPs were analyzed for CXCR4 and FL6X by Northern blotting and RT-qPCR, respectively (Fig. 4B). Consistent with repression efficiencies, FL6X cotransfected with double-stranded CXCR4 was most highly enriched (2.5-fold) in Ago1 and Ago2 IPs compared with untargeted FL6X. Importantly, FL6X preannealed to CXCR4 was enriched twofold, while FL6X cotransfected with free antisense CXCR4 was enriched 1.5-fold. Both free and preannealed antisense CXCR4 associated equally efficiently with Ago1 and Ago2, but to a much lesser extent than double-stranded CXCR4. This result is consistent with previous observations that both antisense and double-stranded (CXCR4) miRNA stability and association with Ago1 and Ago2 is increased in the presence of an (FL6X) mRNA target (Song et al. 2003; Chatterjee and Grosshans 2009). In support of functional association of Ago1 and Ago2 with the preannealed CXCR4–FL6X duplexes in P-bodies, a 20% decrease of FL6X mRNA levels was observed when FL6X mRNA was preannealed to CXCR4 or cotransfected with double-stranded CXCR4. Consistent with Ago1 and Ago2 results, Flag-Ago3 and Flag-Ago4 were also recruited to FL6X preannealed to CXCR4, and analogous patterns were observed in CXCR4 association (Supplemental Fig. S5). Thus, Agos can be functionally recruited to mRNAs preannealed to miRNAs to mediate translational repression and mRNA destabilization in cells.
To test whether the effects of preannealing were mRNA or miRNA specific, we next assayed Ago binding to and repression of in vitro transcribed, capped, and polyadenylated Renilla luciferase mRNA containing endogenous MYC 3′ UTR (Lal et al. 2009) with two imperfectly complementary binding sites for miR-24 (RL-MYC 3′ UTR) (Supplemental Fig. S1D). For these experiments, we used A549 cells, which express negligible levels of miR-24 (Fig. 4D), and 1:1 molar ratio of RL-MYC 3′ UTR and antisense miR-24 to ensure complete preannealing. We observed 20% repression for both preannealed RL-MYC 3′ UTR and RL-MYC 3′ UTR cotransfected with a double-stranded miR-24 (Fig. 4C). This lower degree of canonical miRNA duplex–triggered repression compared with the CXCR4–FL6X duplex is likely due to fewer miRNA binding sites in RL-MYC 3′ UTR mRNA.
Consistent with the FL6X results, significant repression was not observed when free antisense miR-24 was used to initiate repression, again demonstrating that repression observed with preannealed miRNA–mRNA duplexes was not a result of dissociation of miRNAs from target mRNAs followed by Ago binding of free antisense strands and recruitment to target mRNAs. When Flag-Ago1 or Flag-Ago2 IPs were analyzed for the presence of RL mRNA, we observed a 1.5-fold enrichment of RL-MYC 3′ UTR mRNA when it was either preannealed or cotransfected with double-stranded miR-24 (Fig. 4D). Lower enrichment of RL-MYC 3′ UTR (1.2-fold) was observed with the free antisense miR-24. Similar to FL6X results, RL mRNA levels were reduced by ∼20%, suggesting that mRNA degradation was induced by the presence of miR-24 either preannealed or in double-stranded RNA forms. Consistent with CXCR4 results, Ago associated with miR-24 when preannealed to c-MYC 3′ UTR and stronger association with miR-24 when transfected as a miRNA duplex. Together these results show that Agos can bind and repress preannealed artificial and endogenous-mimicking miRNA–mRNA duplexes in an mRNA-independent and miRNA sequence–independent manner.
Ago2 can cleave siRNA–mRNA duplexes in vitro
To test whether preannealed siRNA–mRNA duplexes can directly and functionally recruit Agos to mediate target mRNA cleavage, we used a minimal assay composed only of a small RNA, a target mRNA, and a bacterially expressed recombinant human Ago protein (Wang et al. 2009a). Ago-mediated target mRNA cleavage occurs at a defined position on the target mRNAs opposite the phosphodiester bond between the 10th and 11th nucleotide of the guide strand (Elbashir et al. 2001) and is characteristic for siRNA-mediated mRNA cleavage.
First, in vitro transcribed, 5′-radiolabeled, 80-nt target mRNA containing one perfectly complementary site for CXCR4 was preannealed to CXCR4 by heating and cooling. The CXCR4–mRNA duplex formed with 90% efficiency (Fig. 5A) and was gel-purified under native conditions to remove free CXCR4 and free mRNA that failed to anneal to CXCR4. We then used this gel-purified, preannealed CXCR4–mRNA duplex as a substrate for in vitro target mRNA cleavage reactions (Fig. 5B). Ago2 endonucleolytically cleaved the preannealed mRNA, generating the expected 48-nt cleavage fragment with 5% efficiency in the presence of CXCR4, demonstrating that Ago2 is functionally recruited to siRNA–mRNA duplexes.
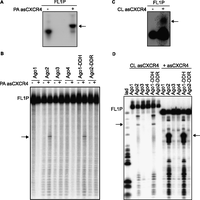
Ago2 can cleave preannealed siRNA–mRNA duplexes in vitro. (A) Efficiency of preannealing. In vitro transcribed, radiolabeled firefly mRNA with one perfect CXCR4 site (FL1P) was heated with (+) or without (−) the antisense strand of CXCR4 and allowed to anneal by cooling to room temperature. FL1P mRNA was resolved on 8% native urea-PAGE gel. Preannealed CXCR4–FL1P is indicated by an arrow. (B) Ago2 can cleave preannealed siRNA–mRNA duplexes. Recombinant wild-type Ago1–4 or mutant Ago1 (Ago1-DDH) and Ago2 (Ago2-DDR) with swapped RNase III catalytic triads were incubated either with the CXCR4 (dsCXCR4) containing radiolabeled passenger/sense (sCXCR4) strand or with radiolabeled FL1P with (+) or without (−) preannealed CXCR4 (PA asCXCR4). The products were resolved on 8% denaturing urea-PAGE gels. Cleavage products are indicated by arrows. (C) Efficiency of covalent BrdU-mediated UV crosslinking. In vitro transcribed, radiolabeled FL1P mRNA was incubated with (+) or without (−) BrdU-modified antisense strand of the CXCR4 (CL asCXCR4) and crosslinked by UV exposure. FL1P mRNA was resolved on 8% denaturing urea-PAGE gel. Crosslinked CXCR4–FL1P is indicated by an arrow. (D) Ago2 and Ago1-DDH can cleave crosslinked FL1P–CXCR4 duplexes in vitro. Recombinant wild-type Ago1–4 or mutant Ago1-DDH and Ago2-DDR were incubated either with radiolabeled FL1P crosslinked to CXCR4 (CL asCXCR4) or with radiolabeled FL1P and CXCR4 (+asCXCR4). The products were resolved on 8% denaturing urea-PAGE gels. Cleavage of the crosslinked FL1P produced specific cleavage product of >48 nt (arrow on the left) due to covalent crosslink between the 3′ end CXCR4 and the cleavage product, while cleavage of the uncrosslinked FL1P produced specific cleavage product of 48 nt as expected (arrow on the right). Partial RNaseT1 digestion of FL1P was used as the ladder.
Ago2-mediated mRNA cleavage requires DDH in the PIWI domain to coordinate Mg2+ at the scissile bond in the target mRNA. Ago1 lacks the DDH motif and therefore does not support siRNA-mediated mRNA cleavage (Wang et al. 2009a). To test the specificity of functional Ago recruitment to siRNA–mRNA duplexes, we generated an Ago1 mutant containing a Ago2-mimicking catalytic triad (DDR replaced with DDH in the PIWI domain; Ago1-DDH) and an Ago2 mutant containing a Ago1-mimicking catalytic triad (DDH replaced with DDR in the PIWI domain; Ago2-DDR). Importantly, Ago1-DDH cleaved the preannealed mRNA with similar efficiency in the presence of CXCR4. On the other hand, Ago2-DDR did not cleave the preannealed mRNA, consistent with our previous report that Ago2, but not Ago1, possesses target mRNA cleavage activity (Wang et al. 2009a). Also consistent with our previous report that both Ago1 and Ago2 can cleave the passenger strand of a perfectly complementary siRNA duplex (Wang et al. 2009a), both Ago1-DDH mutant and Ago2-DDR mutant cleaved the 5′-radiolabeled passenger strand of the perfectly complementary CXCR4 siRNA duplex in vitro (Supplemental Fig. S6A). Thus Ago2 and Ago1-DDH can slice, and thus functionally bind, preannealed siRNA–mRNA duplexes.
To prove that preannealed siRNA–mRNA duplexes did not dissociate during the course of this reaction (allowing the possibility that Agos might first bind to single-stranded siRNAs and then bind to target mRNAs), we covalently crosslinked the CXCR4 to the target mRNA, thus preventing dissociation of CXCR4 from the target mRNA. The CXCR4 guide strand substituted with 5-bromo-2′-deoxyuridine (BrdU) at the next-to-last nucleotide at the 3′ end of CXCR4 was crosslinked to 5′-radiolabeled 80-nt target mRNA with UV light. The CXCR4–mRNA duplex formed with 4% efficiency and was gel-purified under denaturing conditions to remove free CXCR4 and free target mRNA that failed to covalently crosslink to CXCR4 (Fig. 5C). Crosslinked CXCR4–mRNA duplex was incubated with recombinant Agos to assess target mRNA cleavage efficiency (Fig. 5D; Supplemental Fig. S6B). Consistent with results for the preannealed CXCR4–mRNA duplex, only the Ago2 and the Ago1-DDH mutant cleaved the UV-crosslinked CXCR4–mRNA duplex, generating the expected >48-nt cleavage fragment, albeit with lower efficiency compared with the efficiency of target mRNA cleavage triggered with free antisense CXCR4 (8% vs. 65%). Together, these data demonstrate that Ago2 and Ago1-DDH can slice preannealed siRNA–mRNA duplexes while maintaining characteristic hallmarks of siRNA-directed target mRNA cleavage.
DISCUSSION
In contrast to catalytic siRNA-mediated mRNA cleavage, miRNA-mediated repression is thought to be a stoichiometric process whereby miRNA-containing Ago complexes remain associated with target mRNAs. Here we report the existence of Ago-free miRNA–mRNA duplexes that can be functionally bound by Agos in cells and in vitro, suggesting that miRNA-mediated repression can be catalytic.
Previous studies suggested that Agos are likely limiting relative to small RNAs across phyla (Grishok et al. 2001; Vaucheret et al. 2004; Sood et al. 2006; Diederichs and Haber 2007; O'Carroll et al. 2007; Khan et al. 2009; Lund et al. 2011; Martinez de Alba et al. 2011). Here we quantitate the number of Ago1–4 molecules per HeLa cells to be about 15,000 using quantitative mass spectrometry on samples spiked with internal Ago peptide standards. A recent study used mass spectrometry to quantify Ago proteins on a per cell basis (Wang et al. 2012) and detected nearly identical copies per cell as reported here. Based on the stoichiometric model of miRNA-mediated repression, the investigators of this study concluded that there are at most 14,000–17,000 miRNA copies per skin cell or melanoma cell.
We describe a novel method for absolute quantitation of miRNA species per cell. We determined the absolute number of miRNA molecules per HeLa cell to be 202,765, demonstrating a 13-fold excess over Ago1–4 molecules. Western blotting of Ago immunoprecipitates and supernatants showed that ∼80% of Agos were in precipitates and ∼20% in supernatants (Fig. 1E). In contrast, <50% of the four abundant miRNAs (representing 16% of all miRNAs) were detected in Ago immunoprecipitates. Our IP data suggest that at least 30% of miRNAs (∼60,000 miRNA molecules) are not bound by Ago proteins in a HeLa cell, while our absolute quantitation suggest that 90% of miRNAs are not bound by Ago proteins in a HeLa cell (200,000 miRNAs vs. 15,000 Agos). Consistent with these data, we find that mRNAs are associated with a sevenfold excess of miRNA molecules relative to Ago1–4 molecules. Our data are not consistent with the stoichiometric model of miRNA-mediated repression, but rather support the catalytic model of miRNA-mediated repression.
MiRNAs can destabilize target mRNAs (Bagga et al. 2005; Lim et al. 2005; Wu and Belasco 2005; Behm-Ansmant et al. 2006; Giraldez et al. 2006; Schmitter et al. 2006; Wakiyama et al. 2007; Fabian et al. 2009). However, an underappreciated area of investigation is that target mRNAs can stabilize cognate miRNAs (Song et al. 2003; Chatterjee and Grosshans 2009). While it is not clear from published studies how target mRNAs stabilize cognate miRNAs, our data suggest a mechanism whereby miRNAs can be bound to mRNAs in the absence of stable Ago association with the miRNA–mRNA duplex. Our data imply a model in which Agos may bind miRNA duplexes, anneal guide strands to target mRNAs, dissociate from miRNA–mRNA duplexes, and bind new miRNA duplexes (Fig. 6). In this RNA chaperone model of Ago function (Wang et al. 2009a; Kwak and Tomari 2012), the repression capacity of mature miRNAs would be maximized when miRNAs are present in molar excess relative to Agos because limiting Agos could transiently bind and repress multiple miRNA–mRNA duplexes simultaneously. Our results may also help explain the specificity of miRNA sponges (Ebert et al. 2007; Gentner et al. 2009; Ebert and Sharp 2010) and competing endogenous RNAs (ceRNAs) (Salmena et al. 2011). For sponges and ceRNAs to be miRNA specific, Ago proteins cannot be limiting and sequestered along with the miRNA. Thus, it is likely that Agos deposit miRNAs onto complementary sites in miRNA sponges and ceRNAs and dissociate to mediate repression of genuine miRNA targets. This model implies that sponges and ceRNAs may exist in complex with miRNAs in the absence of Agos.
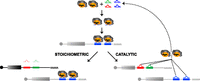
Models of miRNA-mediated repression. According to the stoichiometric model of miRNA function (left), Ago–miRNA complexes are stably associated with target mRNAs during repression, which results in mRNA destabilization (transparent black) and miRNA stabilization (opaque blue). When Agos are limiting, miRNAs compete for Ago loading, Ago-free miRNAs are destabilized (transparent red and green), and Ago-free mRNAs are stabilized (opaque black). According to the catalytic model of miRNA function (right), Ago–miRNA complexes are recruited to target mRNAs as in the stoichiometric model but Agos may dissociate from mRNA–miRNA duplexes, allowing (1) transient association of Agos with multiple miRNA–mRNA complexes during repression and (2) multiple rounds of miRNA loading and recruitment to target mRNAs (dashed lines). Thus Agos function as RNA chaperons (Wang et al. 2009a; Kwak and Tomari 2012) and are not limiting. In the catalytic model, Ago-free miRNAs are stabilized (opaque red, green, and blue) by binding to target mRNAs, and target mRNAs are destabilized (transparent black) when their miRNA recognition elements are occupied by miRNAs, allowing transient Ago binding. The catalytic model explains how substoichiometric amounts of Agos are capable of binding suprastoichiometric amounts of miRNAs and regulating suprastoichiometric amounts of miRNA recognition elements.
We used FRET-based approaches to visualize Ago binding to miRNA–mRNA duplexes in P-bodies in live cells. Ago–siRNA interactions have been previously studied by fluorescence correlation and cross-correlation spectroscopy (Ohrt et al. 2008). We developed the fluorescence lifetime microscopy-based FRET method to study the miRNA pathway, specifically Ago recruitment to miRNA–mRNA duplexes. Previous attempts at identifying protein–RNA interactions using steady-state, intensity-based FRET approaches had not yielded comprehensive results (David Gerecht et al. 2010), most likely due to molar excess of one of the FRET partners that results in low FRET efficiency due to high donor signal bleed through or acceptor cross-talk (Pietraszewska-Bogiel and Gadella 2011). Though this situation is ideal when using the donor dequenching method, some fluorophores display altered excitation and emission profiles after photobleaching, which can have drastic effects on FRET (Zhang et al. 2011).
FLIM-based FRET makes use of the changes in the photon-emitting properties of the donor fluorophore in the presence of acceptor. Contrary to steady-state intensity-based FRET, FLIM is independent of local concentration and of molar ratios between donor and acceptor (Morton and Parsons 2011) because the “FRET-ing” population can be detected by focusing on the short-lived fluorophores using a dual-exponential analysis of the fluorescence lifetime of the donor. Though FLIM-based FRET is still a fairly new technique due to limited availability of detectors, it is the most accurate way to measure FRET efficiencies, as it is directly correlated with energy transfer.
In our assays, the concentration of eGFP-Ago was in vast excess relative to Alexa568–miRNA. Thus sensitized emission and donor quenching/dequenching could not be used because fluorescence property changes would be hard to assess. Although a high concentration of donor fluorophores is present (eGFP-Ago2 in P-bodies), only a small proportion of these fluorophores are in proximity to low concentration of acceptor fluorophores (Alexa568–CXCR4 in P-bodies). Indeed, even if 10% of donor fluorophore were to FRET with an efficiency of 50% with the acceptor (i.e., within 6 nm in our experimental setup), apparent FRET measurement would be 5%, which is typically within the natural variability and noise of such assays. Instead, using the TCSPC (Morton and Parsons 2011) method, we observed an apparent FRET measurement of 11% (Fig. 3), providing a clear signal above noise.
The methods described here can be more broadly applied to study protein–RNA and RNA–RNA interactions in other processes (Lorenz 2009; David Gerecht et al. 2010). There are several advantages of using FLIM measurements to quantify FRET. Most importantly, clustering of a fluorescent protein does not alter its fluorescence lifetime. In contrast, conventional approaches to FRET measurement (such as donor dequenching) require precise quantification of donor and acceptor fluorophores, making such methods very difficult to use when these proteins dynamically cluster into larger assemblies. FLIM measurements are made on a pixel-by-pixel basis, enabling FRET measurements to be made at high spatial resolution. Furthermore, FLIM enables dynamic changes in molecular assemblies to be readily monitored in live cells.
Several confocal microscopy approaches have localized Agos, miRNAs, and target mRNAs into P-bodies (Jakymiw et al. 2005; Liu et al. 2005a,b; Leung et al. 2006), sites of mRNA storage and decay, though none of these studies determined whether Agos directly associate with miRNAs and bound target mRNAs in the cytosol or in P-bodies. Our data demonstrate miRNA–mRNA duplex colocalization with the P-body markers GW182 and XRN-1 and mutually exclusive localization with the small or large ribosomal subunit proteins P-RPS6 and RPL7a (Fig. 2). These observations could imply a role for alternate RISC assembly in marking particular miRNA–mRNA duplexes for decay. These observations do not necessarily imply that Agos load miRNA–mRNA duplexes in P-bodies. Our data demonstrate only that preannealed miRNA–mRNA duplexes are primed for repression, either by RISC-mediated translational repression and/or by shuttling to P-bodies. Our data do not rule out the possibility that Agos could bind miRNA–mRNA duplexes during other processes prior to P-body assembly and that detection of Ago loading onto miRNA–mRNA duplexes was possible only after concentration of complexes in P-bodies. Finally, the canonical model of P-body function is that mRNAs complexed in P-bodies are destined for decay (Sheth and Parker 2003). However, mRNAs (and miRNAs) have been reported to shuttle out of P-bodies to participate in active translation (Brengues et al. 2005). If repression in P-bodies is irreversible, RISC may direct miRNAs and target mRNAs to P-bodies for degradation, and Agos may be recycled back to the cytoplasm. If repression in P-bodies is reversible, then miRNAs bound to Agos or to target mRNAs may be recycled back to the cytoplasm to participate in subsequent rounds of translation or translational repression.
We tested Ago recruitment to artificial and natural miRNA–target mRNA duplexes. MYC 3′ UTR contains two miR-24 binding sites: an upstream seedless miR-24 binding site and a downstream seed-containing miR-24 binding site (Lal et al. 2009). MiR-24 is an example of a growing number of miRNAs that can bind target mRNAs without perfect seed region complementarity. The absence of seed region binding is typically associated with greater 3′ end complementarity and thus may have higher thermodynamic stability. The seedless miRNA interactions could therefore suggest an atypical association with Agos. However, we did not find statistically significant differences in the ability of seedless (e.g., miR-24) and seed-region–containing (e.g., CXCR4) miRNA–mRNA duplexes to recruit Agos or be repressed (Fig. 4). Ago binding to miRNA–target mRNA duplexes might contribute to target mRNA repression by seedless miRNAs, but the increased thermodynamic stability of seedless miRNA–target mRNA duplexes does not appear to improve Ago recruitment to miRNA–target mRNA duplexes.
In conclusion, we report a novel mechanism of RISC assembly in which Ago proteins load onto preannealed miRNA–mRNA duplexes. Ago proteins are substoichiometric relative to miRNA molecules in HeLa cells and on purified mRNAs, and HeLa-expressed miRNAs are stable without binding to Agos. There may be several mechanisms to stabilize miRNAs in the absence of Ago binding other than complexing with target mRNAs. The model presented here could explain miRNA target specificity between ceRNAs when Agos are limiting. Further analysis is required to establish roles for alternate RISC assembly in miRNA function.
MATERIALS AND METHODS
Determination of absolute Ago1–4 copy numbers
The AQUA strategy we used was according to the method described previously (Gerber et al. 2003), with minor modifications. Briefly, a gel region encompassing the Ago proteins (85–110 kDa) was excised, minced into 1-mm cubes, destained to remove Coomassie, lyophilized, resuspended in a trypsin digestion solution (5 ng/μL trypsin in 5% acetonitrile and 50 mM ammonium bicarbonate), and incubated for 1 h on ice and then overnight at 37°C. The following day, the samples were acidified with 5% formic acid, spiked with 200 fmol of each of the four Ago AQUA peptides (Thermo Scientific; AVQVHQDTLR covering Ago1, Ago2 isoform 1, and Ago2 isoform 2; DHQALAK covering Ago2 isoform 1 and Ago2 isoform 2; YTPVGR covering Ago1, Ago2 isoform 1, Ago2 isoform 2, Ago3 isoform a, and Ago4), and extracted to recover all peptides present. Extracts were filtered to remove particulates, and lyophilized. The sample was resuspended in 5% formic acid and analyzed three times using 1/10th of the sample for each analysis on a Thermo Orbitrap XL2 LCMS with a 120-min reversed phase gradient. Quantitation was based on integrated peak areas using extracted-ion chromatograms from survey scans (MS1 with 60,000 resolution) with 3-ppm ranges around the m/z of each light and heavy peptide. MS2 scans were also collected in a data-dependent fashion, identifying several hundred proteins in the gel region.
Determination of absolute miRNA copy numbers
Total RNA from HeLa cells was extracted with Trizol (Invitrogen). Synthetic single-stranded miRNAs for the naturally occurring cel-miR-39 (UCACCGGGUGUAAAUCAGCUUG) and cel-miR-54 (UACCCGUAAUCUUCAUAAUCCGAG), as well as the synthetic CXCR4 miRNA (UGUUAGCUGGAGUGAAAACUU), were reconstituted in 0.1× TE buffer to a fixed copy number. These miRNA sequences are not found in the human genome, and the copy number was determined using the following formula: (X g/μL RNA/molecular weight) × 6.02 × 10²³. Equal copy number amounts of the three synthetic miRNAs were combined and serially diluted to create three synthetic miRNA pools containing 5.2 × 10⁶ copies/μL, 5.2 × 10⁵ copies/μL, or 2.6 × 10⁴ copies/μL of each synthetic miRNA.
cDNA synthesis and real-time PCR were performed using the miScript PCR System (Qiagen). Three reverse-transcription reactions were assembled following the manufacturer's instructions using 5× miScript HiSpec Buffer. Each reaction had a fixed amount of RNA prepared from HeLa cells (520 ng) mixed with different amounts of the synthetic miRNA mimic pool prepared as above, containing 5.2 × 10⁶ copies, 5.2 × 10⁵ copies, or 5.2 × 10⁴ copies of each synthetic miRNA. The reactions were then incubated for 60 min at 37°C followed by a heat inactivation for 5 min at 95°C. Each cDNA was then diluted to a final volume of 520 μL using RNase-free water, resulting in three cDNA samples, each containing 1 ng/μL HeLa cDNA and 1 × 10⁴ copies/μL, 1 × 10³ copies/μL, or 1 × 10² copies/μL of each miRNA mimic present in the synthetic pool.
To generate a standard curve for the synthetic miRNA Ct values, the three cDNA samples were used as templates in real-time PCR using the miScript SYBR Green PCR Kit and miScript Primer Assays targeting the exogenous miRNAs (one assays each for cel-miR-39 and cel-miR-54 and three different assays for CXCR4). Real-time PCR was performed on an ABI-7900HT (Applied Biosystems) using the miScript cycling program, which consists of an initial hold for 15 min at 95°C followed by 40 cycles 15 sec at 94°C, 30 sec at 55°C, and 30 sec at 70°C. The Ct values at all three copy number amounts (1 × 10⁴, 1 × 10³, and 1 × 10²) were averaged across the five miScript Primer Assays to generate a standard curve for the synthetic miRNAs (Ct vs. synthetic miRNA copy number).
For profiling of endogenous miRNA expression in HeLa cells, the remaining volumes of the three cDNA samples were pooled and used as a template (1 ng cDNA per well) in real-time PCR using the miScript SYBR Green PCR Kit and the Human miRNome miScript miRNA PCR Array (assays current through miRBase version 16). Real-time PCR was performed on an ABI-7900HT (Applied Biosystems) using the miScript cycling program described above. A miRNA was deemed to be expressed if its Ct value was less than 35, its dissociation curve was a single-sharp melt peak, and its dissociation curve temperature was indicative of specific miRNA amplification.
Oligo(dT) pulldown
HeLa cells (10 × 106 to 20 × 106) were used for each control pulldown with M-270 Streptavidin dynabeads (Invitrogen) or test pulldown with oligo(dT) dynabeads (Invitrogen). Cells were lysed for 15 min at room temperature in 1 mL lysis buffer containing 20 mM Hepes (pH 7.6), 150 mM NaCl, 1 mM EDTA, 0.5% NP-40, 1× protease inhibitors (Roche), and 0.4 U/μL murine RNase inhibitors (NEB). After spinning for 15 min at 25,000g at room temperature, lysates were rotated for 30 min at room temperature with beads washed with wash buffer containing 20 mM Hepes (pH 7.6), 150 mM NaCl, 1 mM EDTA, and 0.5% NP-40. After washing three times with wash buffer, complexes were eluted by heating for 3 min at 75°C in 50 μL 10 mM Hepes (pH 7.4). RNA was extracted with Trizol-LS (Invitrogen).
Transfections and cell culture
HeLa and A549 cells were cultured in DMEM supplemented with 10% ABS. Transfections were performed using Lipofectamine2000 (Invitrogen) according to manufacturer's instructions.
Plasmids
The following plasmids were used in this study: PCD FL6X (Addgene plasmid 12566), RL-MYC 3′ UTR (gift from Dr. Ashish Lal), pIRESneo-Flag/HA Ago1 (Addgene plasmid 10820), pIRESneo-Flag/HA Ago2 (Addgene plasmid 10822), pIRESneo-Flag/HA Ago3 (Addgene plasmid 10823), pIRESneo-Flag/HA Ago4 (Addgene plasmid 10824), N-terminally tagged (Flag) Ago1/2 subcloned from pIRES into pcDNA3.1, and N-terminally tagged eGFP- and Ametrine-Ago1/2 subcloned from pIRES into lentiviral pHAGE vector.
Antibodies
The following antibodies were used: Ago1 07-599 (Millipore), Ago2 2897 (Cell Signaling), Ago2 4F9 (Santa Cruz), pan Ago2 2A8 (Millipore), Flag 2368 (Cell Signaling), P-RPS6 2215 (Cell Signaling), RPL7a A300-749A (Bethyl), GAPDH 2118 (Cell Signaling), Alexa488-HA 2350 (Cell Signaling), GW182 A302-330A (Bethyl), XRN1 SAB4200028 (Sigma), Alexa Fluor 568 goat anti-rabbit IgG (Invitrogen), and Alexa Fluor 647 goat anti-rabbit IgG (Invitrogen).
RNA
FL6X and RL-MYC 3′ UTR mRNAs were in vitro transcribed using RiboMax kit (Promega), capped using the ScriptCap m7G Capping System (CellScript) and polyadenylated using the Poly(A) Polymerase Tailing Kit (Epicentre) according to the manufacturers' instructions. Alexa568-labeled and unlabeled CXCR4 sense and antisense strands were synthesized by Integrated DNA Technologies (IDT).
RT-qPCR
RNA was extracted with Trizol (Invitrogen). Reverse transcription was performed using random hexamer primers with SuperScript III (Invitrogen) after DNase I treatment according to the manufacturer's instructions. Platinum SYBR Green qPCR SuperMix-UDG with ROX (Invitrogen) was used for qPCR detection. The following primer pairs were used: FL (Fwd, CGTTGACCGCCTGAAGTCTCTGATTA; Rev, GGGTGTTGGAGCAAGATGGAT), RL (Fwd, AATGGCTCATATCGCCTCCTGGAT; Rev, TGGACGATGGCCTTGATCTTGTCT), and GAPDH (Fwd, GAAGGTGAAGGTCGGAGT; Rev, GAAGATGGTGATGGGATTTC).
Luciferase assay
Cells were lysed in 1× Passive Lysis Buffer (Promega), incubated for 15 min at room temperature, and transferred to white 96-well plates. FL and RL were measured using the Dual-Glo Luciferase Assay System (Promega).
Northern blotting
To detect miRNAs, RNA was resolved on 12% urea-PAGE in 1× TBE, and gels were equilibrated in 0.5× TBE and transferred onto Hybond membrane (GE Healthcare) using a semi-dry transfer cell (BioRad). RNA was UV crosslinked to the membrane and prehybrizided for 1 h at 42°C in 5× SSPE, 2× Denhardt's solution, and 0.1% SDS containing denatured salmon sperm DNA. Membranes were incubated overnight at 42°C with antisense RNA probes labeled at the 5′ ends with gamma-ATP. Membranes were washed for 10 min at room temperature with 2× SSC, 0.1% SDS and for 10 min with 0.2× SSC, 0.1% SDS.
Immunoprecipitation
HeLa cells were lysed for 15 min on ice in lysis buffer containing 50 mM Tris (pH 7.4), 100 mM NaCl, 0.5 mM EDTA, 1% Triton X-100, 0.4 U/μL RNase inhibitors, and protease inhibitor cocktail tablet and centrifuged at 12,000g for 15 min at 4°C. Mouse IgG Agarose (Sigma) and anti-Flag M2 Agarose (Sigma) were washed in TBS (50 mM Tris at pH 7.4, 100 mM NaCl, 0.5 mM EDTA, 1% Triton X-100). After preclearing lysates for 1 h at 4°C with mouse IgG Agarose, IPs were performed for 1 h at 4°C with anti-Flag Agarose preblocked with BSA and tRNA. After washing the beads five times with TBS, complexes were eluted with 150 μg/mL Flag peptide in lysis buffer by shaking for 30 min at 4°C.
Immunostaining
Cells were cultured on autoclaved 15-mm coverslips (Fisher) in 24-well plates, fixed with 4% paraformaldehyde in PBS for 10 min, and permeabilized with 0.5% NP-40 in PBS for 2 min. Cells were blocked for 1 h with 3% BSA and 10% Sea Block (Thermo Scientific) in PBS at room temperature and incubated with primary antibodies in the blocking solution for 1 h at room temperature, followed by incubation with secondary antibodies in the blocking solution for 1 h at room temperature. Cover slips were mounted on slides with Prolong Gold (Invitrogen). Confocal image acquisition for the immunofluorescence experiments was performed on a Leica SP5X white-light laser microscope using sequential scanning mode as to reduce signal cross-talk and bleed through. Typically, an average of two to three scans were used to generate images using a resolution of 512 × 512 dpi and an average zoom of 3×–4× using a 63× oil immersion objective. Laser excitation and spectral detector wavelength determination were done according to the suggested settings by the Leica software: briefly, DAPI (405 EX; 420–480 nm EM), Alexa488 (488 nm EX; 596–546 EM), Alexa568 (568 nm EX; 576–636 nm EM), and Alexa647 (650 nm EX; 660–610 EM).
FLIM
Stably transfected eGFP-Ago2–expressing HeLa cells were cultured in untreated MATEK dishes overnight at a density of 10 × 105 cells/mL 2 d prior to imaging. Fluorescently labeled CXCR4 and target FL6X were transfected 16 h prior to imaging. Before imaging, the culture medium was removed and cells were washed and kept in Ringer's solution to minimize auto-fluorescence. Cells were mounted on an LSM710 upright microscope and observed using a 63× water dipping lens. Confocal images were acquired using single-photon lasers, Ar-488 for eGFP and HeNe-561 for Alexa568. Emission of fluorescence was detected using spectral detectors with a 60-nm bandwidth, 596–556 nm for eGFP and 570–630 for Alexa568. Sample acquisition for FLIM was done using a Coherent Chameleon vision 2 using a 140-fsec second pulse at a 80-MHz pulse rate with a laser intensity set at 4% and at 860-nm wavelength. The sample was continuously scanned for 20 sec using a pixel dwell time of 0.79 msec and a 0.487-sec frame rate to minimize donor fluorophore photobleaching during acquisition. This typically yielded 3 × 10⁴–4 × 10⁵ photons per second, which were detected using the Becker & Hickl TCSPC module mounted of the microscope and a deflection plate to redirect emitted light path toward the detectors. Images generated by the software were saved and then exported to SPCimage for analysis. Determination of fluorescence lifetime of P-bodies–associated eGFP-Ago2 was done on a pixel by pixel analysis using a single exponential curve fitting where the χ2 was nearest to 1.00 (average of 1.00 ± 0.02, n = 20). This resulted in the calculation of 2.3 nsec. For FLIM determination of the FRET samples, single and/or fixed dual exponential decay curve fittings were used to calculate overall FLIM and to determine the fraction of donor fluorophore in the FRET state. Curve fittings typically had a higher χ2 when single exponential curve fitting was used in the calculation of overall FLIM in the FRET experiments, an indication of the presence of more than one population of fluorophores with different fluorescence lifetime. Processed data analysis was done using Prism GraphPad.
In vitro slicer assays
Fifty pmol of FL1P mRNA was preannealed or UV crosslinked to 200 pmol CXCR4 or CXCR4 internally labeled with BrdU, and the slicer assays were performed according to the method described previously (Wang et al. 2009a).
SUPPLEMENTAL MATERIAL
Supplemental material is available for this article.
ACKNOWLEDGMENTS
We thank Dr. Lisa Cameron for help with microscopy, Dr. Ashish Lal (National Institutes of Health) for the RL-MYC 3′ UTR reporter plasmid, and Dr. Zissimos Mourelatos (University of Pennsylvania) for anti-pan Ago antibody. All microscopy was performed at the confocal microscopy core at Dana-Farber Cancer Institute. This work was supported by the Cancer Research Institute Post-doctoral Fellowship to E.G. and a Distinguished Young Scholars Award from the W.M. Keck Foundation to C.D.N.
Footnotes
-
↵10 Corresponding authors
E-mail etienne.gagnon{at}umontreal.ca
E-mail carl_novina{at}dfci.harvard.edu
-
Article published online ahead of print. Article and publication date are at http://www.rnajournal.org/cgi/doi/10.1261/rna.035675.112.
- Received July 26, 2012.
- Accepted August 22, 2012.
- Copyright © 2012 RNA Society




